
January 1st, 2022 was the deadline for Week 7 of Season 5 to accept your homework, I want to thank the 53 students who tried and worked hard this week submitting their essays to complete the assignment and get the best grades.
This week we introduced the SuperTrend indicator makes it possible to identify a trend by filtering price movements, it also allows the placement of protection stops.
Comparable to the SAR indicator, it varies according to the evolution of prices and time, a trend reversal can be identified when prices are crossed with the Super Trend.
So, if the movement does not continue after a bearish or bullish movement, the Super Trend will not change direction until a price reversal is effective.
The stronger the movement, the faster the Super Trend indicator will approach prices. However, unlike SAR, it will not change direction with the slightest correction.
The Super Trend moves above or below the prices depending on whether the trend is upward or downward.
It accompanies the prices as a trailing stop with the difference that it does not progress or does not close on the prices during periods of congestion.
This gives classes more space and time to evolve, giving you the opportunity to capture more movement.
I hope all users who have researched this week will benefit from the set of information and analysis provided to determine how much of an asset that typically moves in a given time period to set profit goals and decide whether or not to try to negotiate.
We always affirm that the main goal of our Steemit Crypto Academy community is to ensure knowledge and promote quality, fair and inclusive learning opportunities in the field of cryptocurrency for all.
Then I asked the students a few questions to gauge how well they understood the topic and to assess the cognitive gains they had made from reading the lesson.
The questions to be answered are:
1. Show your understanding of the SuperTrend as a trading indicator and how it is calculated?
2. What are the main parameters of the Supertrend indicator and How to configure them and is it advisable to change its default settings? (Screenshot required)
3. Based on the use of the SuperTend indicator, how can one predict whether the trend will be bullish or bearish (screenshot required)
4. Explain how the Supertrend indicator is also used to understand sell / buy signals, by analyzing its different movements.(screenshot required)
5. How can we determine breakout points using Supertrend and Donchian Channel indicators? Explain this based on a clear examples. (Screenshot required))
6. Do you see the effectiveness of combining two SuperTrend indicators (fast and slow) in crypto trading? Explain this based on a clear example. (Screenshot required))
7. Is there a need to pair another indicator to make this indicator work better as a filter and help get rid of false signals? Use a graphic to support your answer. (screenshot required)
8. List the advantages and disadvantages of the Supertrend indicator:
9. Conclusion:

Show your understanding of the SuperTrend as a trading indicator and how it is calculated?
One of the indicators most appreciated by traders is the SuperTrend, which was introduced to optimize the moment of exit from an operation but which is excellent for following the trend of a trend and exploiting it for our operations.
This powerful tool is very popular because it allows you to obtain a lot of information on a visual level in a simple and direct way . And above all it is very effective.
The SuperTrend recognizes two major advantages:
it works in an almost universal way: in fact it is applicable on any time scale (from the very short timeframe up to the long one, even if we will then make some clarifications later ...) and to all financial instruments ( stocks, crypto, forex).
Unlike many other trend following indicators (also called " lagging indicators ") it takes into account the volatility of the market .
The others (such as the Parabolic SAR) do not and this often pushes the trader to exit the market too early because simple corrections are exchanged as a possible end of the trend. Instead the SuperTrend filters these moments, and this allows us to hold the position open for as long as necessary.
Now, even if the calculation is done automatically on our trading platform, it is still useful to do some hints.
The SuperTrend is calculated starting from the average volatility of an asset in the reference period .
To extrapolate the volatility, another well-known indicator is used, namely the Average True Range . A multiplier coefficient (usually 3) is then applied to the volatility in relation to a certain observation period on which the volatility is calculated (usually 10).
Wanting to be very synthetic, what to focus on are these two parameters. The greater or lesser effectiveness of the SuperTrend depends on them.
What are the main parameters of the Supertrend indicator and How to configure them and is it advisable to change its default settings?
At the beginning we said that this indicator has the advantage that it can be used in any time situation: short, very short or long. However, it should be noted that the effectiveness can vary a lot depending on the time you choose.
In general, for too short periods (under an hour) it loses its effectiveness, but in any case there is no single rule, so to decide the best setting it is advisable to make some attempts on the financial instrument we intend to trade .
It thus happens that if in some cases using a multiplier parameter equal to 3 (the one that is by default on the platform) can anticipate the exits from the market too much, in other cases, however, setting it to 4 or 5 can have the opposite effect. Testing historical data can help us better choose the right parameter.
However, this is true in general for all indicators when it comes to deciding the best time frame for trading .
Based on the use of the SuperTend indicator, how can one predict whether the trend will be bullish or bearish .
The green line indicates the market periods with a positive trend, while the red line identifies the periods characterized by a negative trend.
When the indicator line is above the chart, it means that the trend is bearish and it is therefore preferable to open positions for sale or short; when the line is below the chart, it means that the trend is bullish and it is therefore preferable to buy or long positions.
As can be seen from the graph, a trend reversal occurs when the price bars cross the indicator line, positioned at a certain level, from one side to the other; this level is referred to as a roof or floor, depending on whether it is above or below the price scale.
What happens when the super trend line changes color?
The SuperTrend switches from bearish to bullish or vice versa when the price candle closes above its level. At that moment the indicator provides the trend reversal signal.
Explain how the Supertrend indicator is also used to understand sell / buy signals, by analyzing its different movements.
It is very easy to use as it is not very detailed and complex structure. The indicator also generates buy and sell signals when the indicator starts to chart above or below the closing price. A supertrend is a 'buy' signal when the price closes above the candle and a 'sell' signal when it falls below the closing price.
Extremely simple to use, the supertrend indicator works well on both uptrends and downtrends. The buy and sell signal can be easily identified when the indicator crosses the closing price. Super Trend generates a 'buy' signal when the price goes below and the color turns green. On the other hand, the supertrend is used as a 'sell' signal when it goes above the price and turns red.
Do you see the effectiveness of combining two SuperTrend indicators (fast and slow) in crypto trading?
This strategy is very easy to incorporate into a trading environment and for crypto. The strategy works best when the market is trending. The system is based on two complementary supertrends:
- A long / short position statement supertrend with parameters 3 and 10 (red color).
- An exit supertrend (~ stop-loss) with parameters 2 and 10 (green color).
The strategy is simple:
- A position is taken when the supertrends intersect. If the red supertrend crosses the green supertrend downwards, we enter long (green cycle), conversely we enter short (red cycle).
- The green supertrend serves as a dynamic stop-loss, it is adapted over time. Each time the price touches or ends up in the closing cloud, a profit is taken (red circles). Drill bits in the cloud are ignored.
- When the supertrends meet again, the position is closed.
We can then immediately take advantage of the next cycle and alternate long / short positions.

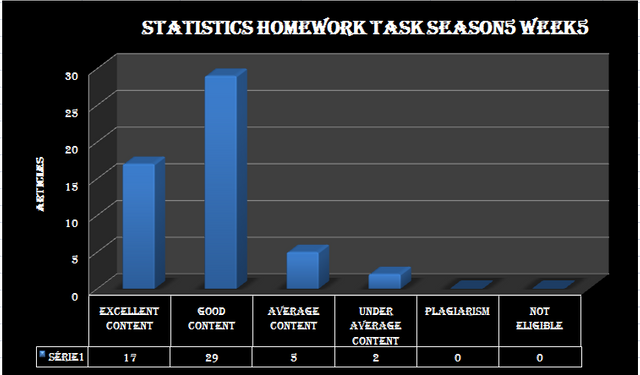
The seventh week of the fifth season, which took place from December 25, 2021 to January 1, 2022, witnessed a slight increase in participation compared to the fifth season, which confirms the success of this week and its passage in the best conditions as usual.
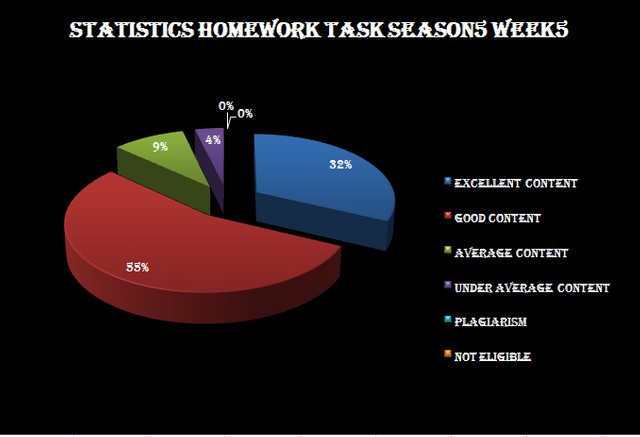
We note an increase in the proportion of articles with excellent content, reaching 32% of the total writing, an increase of 4% compared to the previous week,
With a high percentage of good content articles as usual 55%, maintaining the same high percentage as last week,
Articles with medium content saw a 4% drop, being rated at 9%.
Thus, the percentage of successful homework with a positive overall vote is over 96% versus 4% who fail to get a grade above average, and if that's anything to be said, the seriousness with which students get what they are asked and their success. Their eagerness to learn and do their best to get the highest grades and best results.
We also see 0% of plagiarism posts which we look forward to combating and it remains our great hope that students will continue to write articles without these practices which remain the number one and most dangerous enemy towards improving their level and developing their knowledge.
We also saw that no participant was excluded from the competition due to non-compliance with the conditions of participation, and it must be remembered that the conditions of participation require a reputation of 65 and 900SP regarding the expiration time and fulfillment of the conditions for participation in the #club5050 event, so we invite participants to abide by it. Conditions so that no preparation effort is wasted without getting evaluation and reward.

We would like to first thank all the participants for their challenges and inspiring achievements, and we hope that the spirit of this competition will continue for as long as possible, and we hope that the culture of challenge and facing obstacles will spread in all communities.
We are pleased to announce the names of the three winners of the 7th week of the 5th season competition :


Cc:-
@steemitblog
@steemcurator01
@steemcurator02


Thank you Professor @kouba01 for your effort in the academy.
Downvoting a post can decrease pending rewards and make it less visible. Common reasons:
Submit
Woow thanks a lot Prof @kouba01 for choosing me amongst the three best students. Your lesson was really indeed worth learning, I pray to continue with this same spirit. Congrats 👏🎉 to the other Selected candidates
Downvoting a post can decrease pending rewards and make it less visible. Common reasons:
Submit
brother i want to start crypto academy so would you please tell me how can i start from 0
actually i have not knowledge about crypto so that i want start from zero.
Downvoting a post can decrease pending rewards and make it less visible. Common reasons:
Submit