This is a repost for my previous post that was not curated by @steemcurator02 and i will be grateful if its put into consideration.
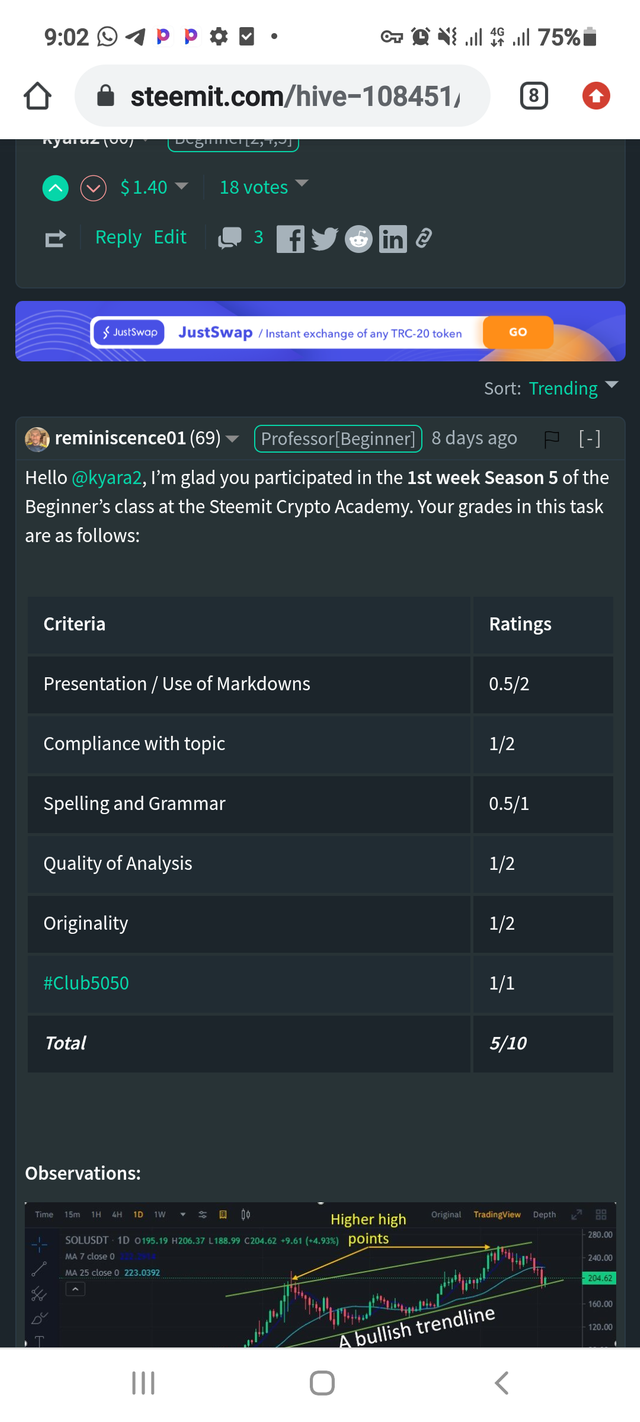
Thank you @reminiscence01 for the lecture on this homework.
What do you understand by a trending market?
A trending market is a market that involves the movement of price in one direction. Sometimes the price could go against the trend occasionally, but when you look at the longer time frames it would vividly show that those were market retracements. Trends are usually recognized after they have formed higher highs, higher lows, and lower highs, lower lows in an uptrend and downtrend, respectively.
The time interval is a key element when identifying a trending market. The weekly and monthly charts show the major trends more clearly than the daily charts, that is to say, longer-term charts remove the noise that interferes with seeing the bigger picture. The most successful traders start with evaluating the weekly and monthly charts and then apply the lines and values developed on those charts to a daily chart. The weekly chart provides direction while the daily chart and the lower time frames are used for timing entries and exits.
What is a bullish and bearish trend? (screenshot required)
Bullish Trend.
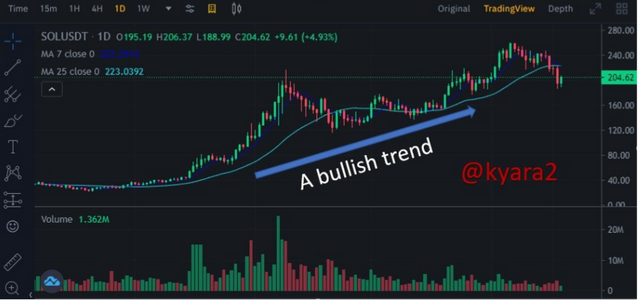
A bullish trend in the cryptocurrency market is when the price of an asset continues to rise in an upward direction, that is to say, immediately the prices breaks above the resistance level forming higher highs and higher lows indicates that the market is so bullish and the buyers are increasing the demand of the particular asset causing the upward momentum of the prices thus bullish trend.
Bearish Trend.
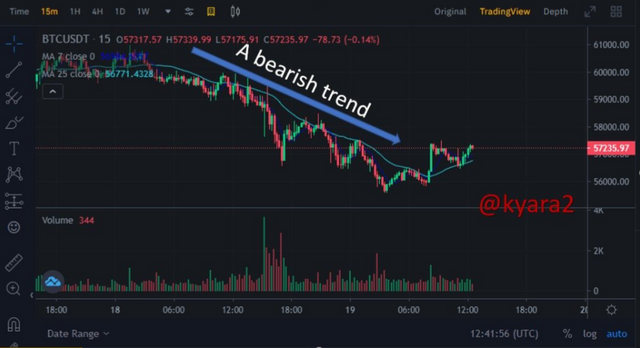
The bearish trend is the opposite of the bullish trend whereby the market condition is characterized by falling prices which generally shows a pessimistic outlook. In this market trend, traders begin selling rather than buying as they try to get out of losing positions, that is to say, in the bearish trend the market price of an asset will continue in the downward direction forming lower lows and lower highs.
Explain the following trend identification and give an example of each of them. (Original screenshot needed from your chart). Do this for both bullish and bearish trends.
(i) Market structure.
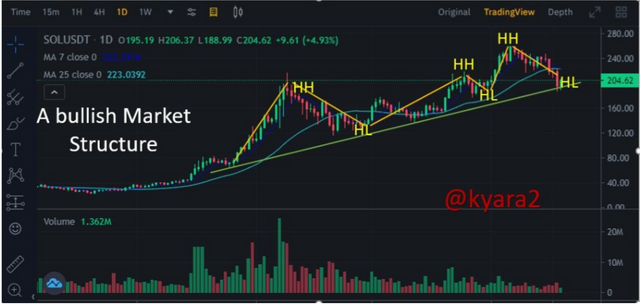
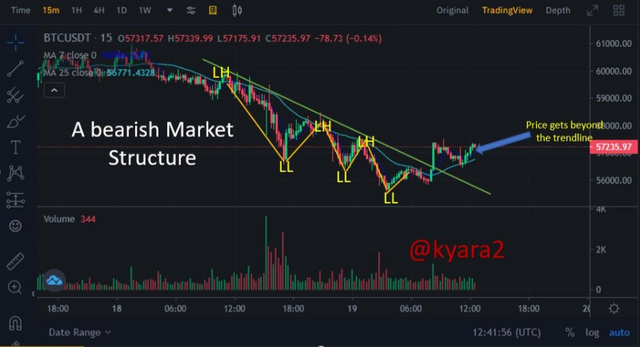
Market structure is a general term used to describe where prices are, be it in terms of an uptrend, a downtrend, or sideways. It is the characteristics that buyers encounter and sellers face in a given industry, that is to say, market structure helps a trader to define the current market condition so that they are acknowledged whether to be buying, selling, or staying out of the market.
The higher time frame market structure is always going to be more important than the lower time frame because it gives a trader a clear view of the current market trend, however, you can notice the market trend change from the lower time frames on the cryptocurrency chart.
Bullish Market Structure.
Bearish Market Structure.
(ii) Trendlines.
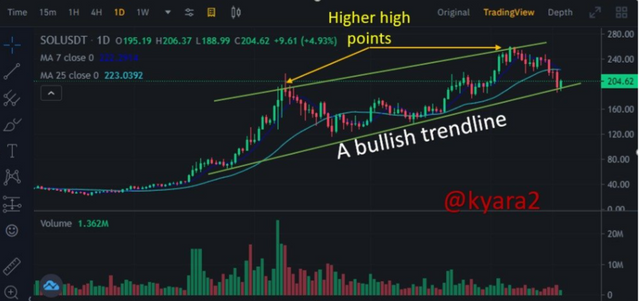
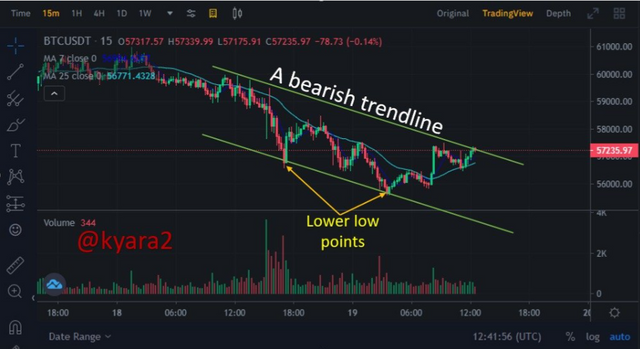
In order to master a trending market, you must get acknowledged about trend lines that determine the current direction of price movement, and often identify the specific point at which the direction will change, that is to say, the trendline is the most popular and recognized tool of chart analysis. In an uptrend, a trader will look to join the lows of the price movement and in a downtrend, a trader will join the highs of the price movement. A rational trendline joins two or more points that clarify the trend, that is, trendlines are mapped on higher time frames and later checked for confirmation of the lower time frames. In this way, you will identify the areas of support and resistance, the most significant levels being on the higher time frames.
An uptrend line has a positive line that can acts as a support as long and as the market price remains above this trendline, the uptrend is considered intact. If the price closes beneath the uptrend line then a change in trend could be on the cards.
A downtrend line has a pessimistic incline which functions as resistance and when the price remains beneath this trendline, the downtrend is contemplated justifiable. When the prices close over the uptrend line which indicates that a change in trend is about to happen. Here is a classic downwards trendline which connects the highest price with other price swings. When price shifts past the trendline continuing upwards, the downtrend has been impaled that could cause the culmination of the downtrend or mainspring another downtrend line to be mapped.
Explain trend continuation and how to spot them using market structure and trendlines. (Screenshot needed). Do this for both bullish and bearish trends.
Trend continuation is a general term used to describe the continuous movement of the price of a particular asset in the same direction after a continuation pattern has been formed exactly as did before. There are various ways technical analysts spot trend continuation in the cryptocurrency market, for example, formation of the bullish flag pattern, bullish pennant pattern, bullish falling wedge, bearish flag pattern, bearish pennant pattern, and the bearish rising wedge.
Bullish flag pattern.
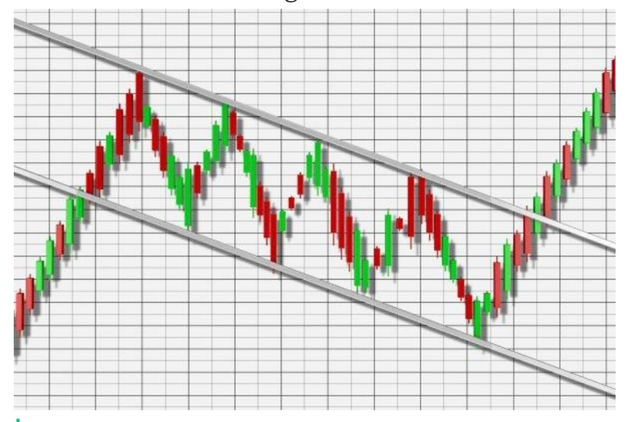
Bullish flags are created when there are strong uptrends, that is to say, they earned the name bull flags because the pattern looks like a flag on a pole. The pole is the rally up and it shows a period of consolidation. The flag is often angled down away from the current trend and can also be a horizontal rectangle.
source
Bearish Flag pattern.
Bearish flags are found within strong downtrends and they are called bear flags because the pattern resembles a flag on a pole, that is to say, the pole is the pullback, and the flag shows a period of consolidation. The flag can be a horizontal rectangle as well but is often angled up away from the current trend.
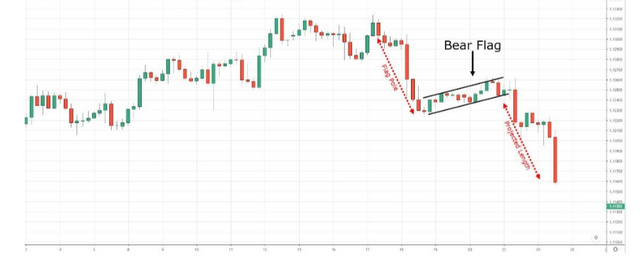
source
Bullish pennant pattern.
Bullish pennants are continuation patterns that occur in strong uptrends. The pennant is created from an upward flagpole, a consolidation period, and then the continuation of the uptrend after a breakout.
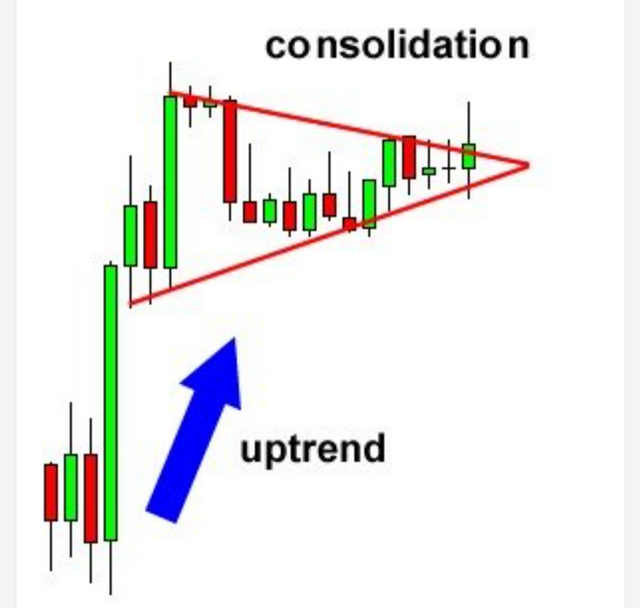
source
Bearish pennant pattern.
Bearish pennants are continuation patterns that occur in strong downtrends and are formed from a downward flagpole, a consolidation period, and then the continuation of the downtrend after a breakdown.
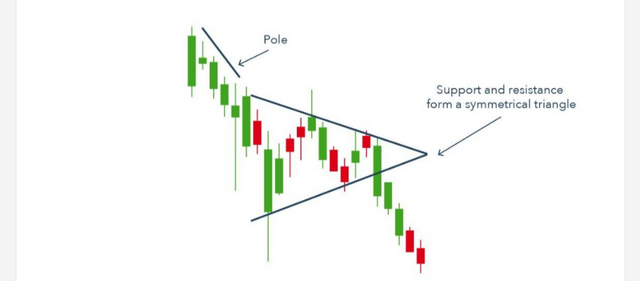
source
Bullish falling wedge.
The falling wedge pattern is a continuation pattern created after the price recoils between two downward inclining converging trendlines. It is considered a bullish pattern but can indicate both reversal and continuation patterns depending on where it appears in the trend.
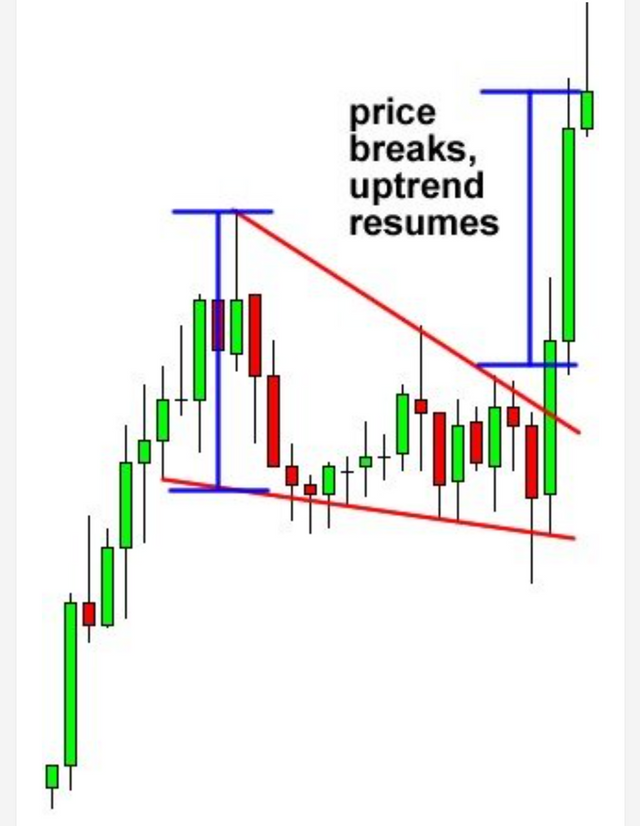
source
Bearish rising wedge.
The rising wedge pattern is a continuation or reversal pattern formed when price bounces between two upward sloping converging trendlines. This is considered a bearish pattern but can indicate both reversal and continuation patterns depending on where it appears in the trend.
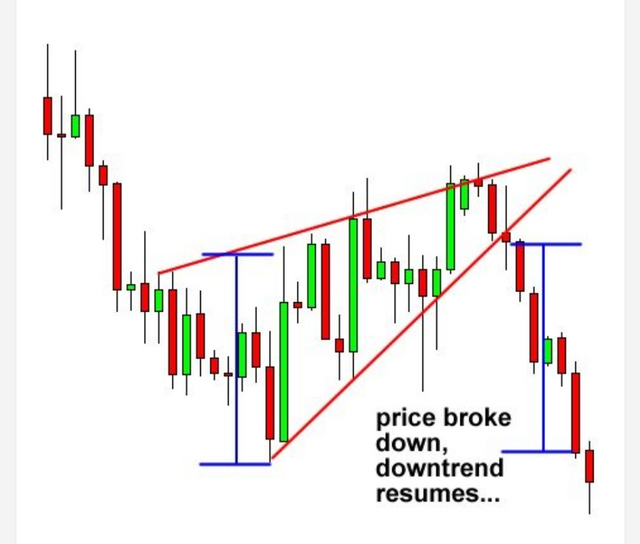
source
Pick up any crypto-asset chart and answer the following questions.
(i) Is the market trending?
To correctly answer the above question, I chose the crypto market chart of SOL/USDT because the trend is clearly shown to be in the upward movement thus uptrend. In this sense, my answer to the question above is yes the market is trending, that is to say the price of SOL/USDT is respecting the laws of an uptrend market by creating higher highs and higher lows in the price chart.
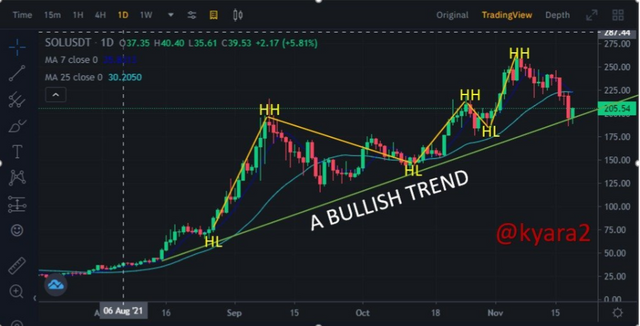
(ii) What is the current market trend? (Use the chart to back up your answers.)
Currently, the trend of the market is bullish. If you keenly look at the cryptocurrency market chart above you will notice that the market is moving in the upward direction. This is seen by connecting both the higher highs and the higher lows which is formed due to the momentum brought about by buyers in price movements of SOL/USDT on the market chart.
Conclusion.
There 3 major types of trends and traders need to keenly study the market using different techniques to know exactly what the market trend is so that they are not caught off guard trading against the trend for example by using trendlines to connect or join 2 peaks and confirm with the third peak to get acknowledged about the market trend.
This is a repost of my previous post which expired without getting curated by the steemcurators.
Cc; @reminiscence01
You have been curated by @yohan2on, a country representative (Uganda). We are curating using the steemcurator04 curator account to support steemians in Africa.
Always follow @ steemitblog for updates on steemit
Downvoting a post can decrease pending rewards and make it less visible. Common reasons:
Submit