1.In your own words define the random index and explain how it is calculated
Random index also known as KDJ indicator is an indicator which is used by investors and crypto traders in technical analysis to know when best to buy or sell crypto currencies based on the fluctuations in the price. It is also useful in knowing market trends (upward and downward), good entry and exit points.
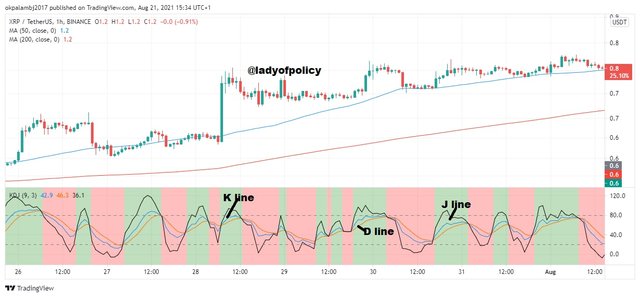
Random index or KDJ is composed of three lines which are K-line, D-line and J-line hence the name KDJ. The first two lines “K” and “D” are similar to the stochastic oscillator which is also an indicator that precedes the random index. This makes both indicators look the same. The main and only difference between the both listed indicators is the third line which is the J-line. It is the J-line that distinguishes the random index from the stochastic oscillator.
Random index calculation
Random index can be calculated by knowing the immature random index value, the K value, D value and J value with other parameters involved. Below is an example of calculation formula involving random index.
N-day RSV= (CN LN) /(HN LN) X 100
“N” here denotes number of days. Days could be weeks or even months. Depending on the value given.
CN is the closing price on the nth day.
LN is the lowest price in n days
HN is the highest price in n days
Then the K, D and J value are calculated thus;
K value= 2/3 x K value of the previous day + 1/3 x RSV of the day
D value= 2/3 x D value of the previous day + 1/3 x K value of the day
The J value is calculated if there isn’t any K and D value. Which is equal to 3 x k value of the day – 2 x D value of the day
Info source
Note that I got few ideas which I used in answering these question from the source stated above

2.Is the random index reliable? Explain

The random index works based on the functioning of the three lines. When all three lines “K”, “D” and “J” intercept we have a signal. This signal can be used to tell when an asset is oversold or overbought depending on the percentage maximum or minimum levels being set. The function of an indicator is to make sure that trades end up being successful. It isn’t fully good in quality or performance because when the market is flat, the random index can give false signals. Hence it isn’t fully reliable.
Several indicators have been present but so far KDJ is the most reliable when compared to it’s predecessors. Even if it isn’t fully perfect, it is the most current and way better than the other indicators invented before it. That’s the reason it can be used to answer lots of questions.

3.How is random index added to a chart and what are the recommended parameters ?

Trading view.com was used for this task and when I got there I clicked on charts and was taken to charts
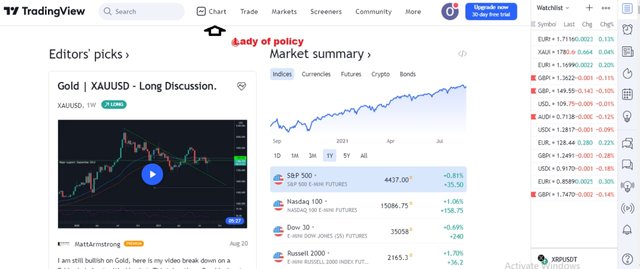
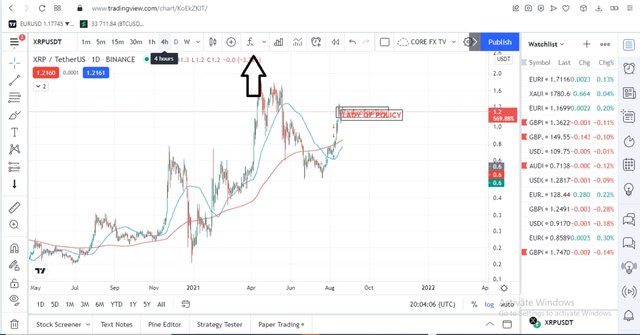
The next step was to click the f with the subscript sign in the chart. after that a dialogue box will be shown and then KDJ indicator is typed and searched for. But a particular model of KDJ is used here. which is the one produced by "ll21LAMBOS21"
-———————————————
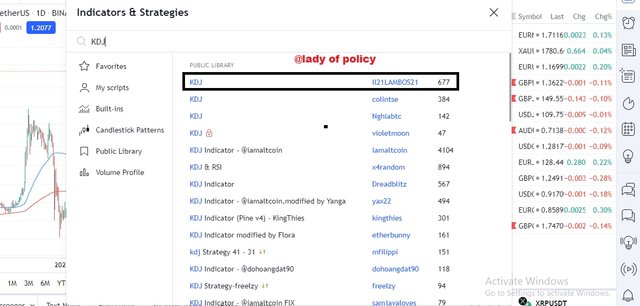
The chart then looks like this once the modified KDJ indicator is being used

4.Differences between KDJ,ADX and ATR

ADX
It is a one line indicator with ranges which shows different trends in the market.
0-25- no trend or a weak trend is involved
25-50- there is a trend in the market
50-75- there is a strong trend in the market
75-100-a very strong trending market
Source
Note that I got few ideas from this site stated above).
ATR
It is derived from a 14 period moving average of true ranges which is used to measure the volatility in the market.source

5. Use the signals of the random index to buy and sell any two crypto currencies. (Screenshots required)

Buy signal
There are three different conditions needed to be met before seeing a buy signal and they are;
a. When the J-line crosses the K and D line
b. When the colour of the background indicator changes to green.
c. When the J line has fallen below the K and D line but at this time below the minimum value being set. usually 0-20.
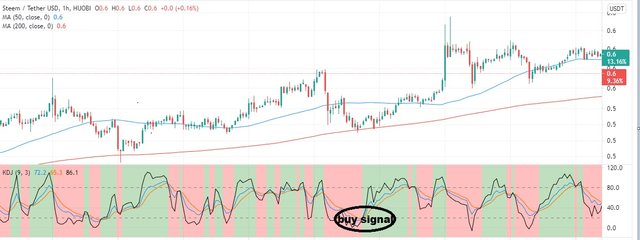
Example of a trade (STEEMUSDT) :
Seeing a cross of the J line above the other line K and D and a change of the background colour to green we get a confirmed buy signal.
Sell signal
This is the opposite of the buy signal. There are also different conditions that when met you can know it's a sell signal
a. When the J line falls below the K and D line
b. When the background colour changes from green to red
c. When the J line is above the other two lines but here also above the maximum percentage being
A sample trade is given below with (STEEMUSDT):
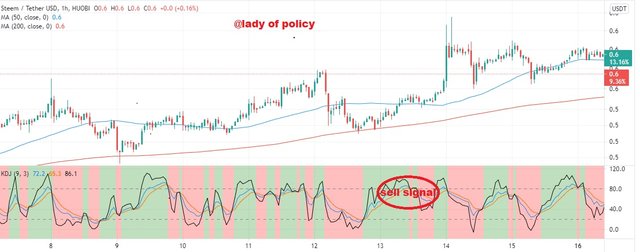
Seeing a cross of the J line below the K and D line and the change of the background colour to red indicates a go sell signal.

Conclusion

The random index is a very powerful technical analysis tool used in indicating the trends in the market(upward and downward). A good investor or trader with good experience won't make high mistakes or costly decisions that'll affect his trade once he applies the knowledge of the KDJ indicator.
Thank you so much professor @asaj for this awesome lectures.
Hi @ladyofpolicy, thanks for performing the above task in the eighth week of Steemit Crypto Academy Season 3. The time and effort put into this work is appreciated. Hence, you have scored 5 out of 10. Here are the details:
Remarks
Overall, you have displayed a good understanding of the topic. You have performed the assigned task. However, you did not provide new information to this course, as most of the points mentioned have been indicated by several participants.
That said, thanks again for your contributing your time and effort to the academy.
Downvoting a post can decrease pending rewards and make it less visible. Common reasons:
Submit
Thanks Prof. @asaj
Hope to do better next time
Downvoting a post can decrease pending rewards and make it less visible. Common reasons:
Submit
How did you create those demarcating lines? @ladyofpolicy
Downvoting a post can decrease pending rewards and make it less visible. Common reasons:
Submit
Is it these lines.
Downvoting a post can decrease pending rewards and make it less visible. Common reasons:
Submit
Yes. @ladyofpolicy
Downvoting a post can decrease pending rewards and make it less visible. Common reasons:
Submit
Hold on that line and download it dear then you upload it as a picture
Downvoting a post can decrease pending rewards and make it less visible. Common reasons:
Submit