
INTRODUCTION
Greetings friends and everyone in steemit cryptoacademy. It's such an amazing week as professor @allbert took his time to explain this topic which has to do with trading with Accumulation and distribution (A/D) indicators. There are indeed other indicators used in trading but he was specific to talk about this particular indicator and having gone through the lesson,I will proceed to answer the questions.

QUESTION NO 1.
EXPLAIN IN YOUR OWN WORDS WHAT THE A/D INDICATOR IS AND HOW AND WHY IT RELATES TO VOLUME. (SCREENSHOTS NEEDED).

For a trader to carryout a successful transactions (buying and selling of any crypto asset),there are things that he needs which will help him understand the market in order not to be at loss and that which he needs is called "indicator". So in a lay man's English, indicators are tools which helps a trader to carry out a successful transaction in the crypto market in order not to have much lost but rather to gain more profit. There are different types of indicators which the A/D indicators are one of them.
What is A/D indicators?
A/D indicators is the abbreviation for accumulation and distribution indicator. It is a tool or type of indicator which enables a trader to determine whether an asset is being accumulated or distributed in the market.
There are times people tends to hold a particular asset and there are times they still sell off that particular asset so the only thing that helps a trader to know when an asset is being on hold (which means it's limited) or is being sold off (which means it's in circulation) is if such trader uses the accumulation and distribution indicator.
This particular indicator uses the price of an asset and the volume flow of the asset to ascertain what is going to happen next and this helps a trader to know whether it's good to enter or leave the market.
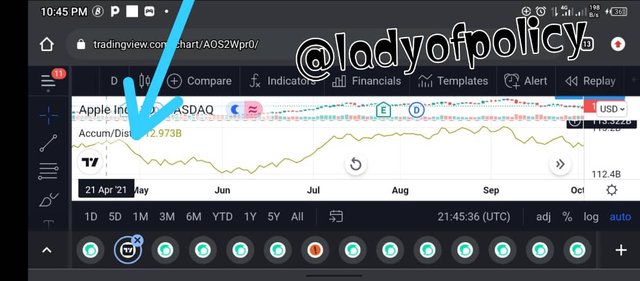
Screenshot from Tradingview
How abd why A/D indicator relates to volume
Like I said earlier, A/D indicator makes use of the price and volume of a particular asset to determine the state of such asset in the market.
Remember that A/D indicators occurs when there is an accumulation and distribution of an asset in the market so this is where volume comes in or relates to it. When there is accumulation, it simply means that at this point the price of an asset is down which makes many people or traders to start buying up that particular asset, as they are buying the asset the volume of that particular asset will keep pumping up which means that as a trader once you enters the market and check a particular asset and notice that the volume of that asset is going high, it's a clear indication that you can make a purchase and accumulate as much asset as possible.
The same thing is applicable to distribution,it still volume that helps traders to detect when to sell the asset in their holding in order to make enough profit. This occurs when the price of an asset reaches the break point,at this point the price of that particular asset has gone very high meaning that it's not adviceable for the trader to buy the asset but rather to sell (distribute) the assets he has in order to gain.
So in essence what am saying is A/D indicator is a very important tool which help traders to have a better understanding of how the market flows in respect to buying up and selling off of coins using the volume and price of the asset.

QUESTION NO 2
THROUGH SOME PLATFORMS, SHOW THE PROCESS OF HOW TO PLACE THE A/D INDICATOR (SCREENSHOTS NEEDED).

In order to answer this question,I will like to explore Tradingview.com.
• When I logged in to Tradingview.com,the first page that opened shows that my Gmail is logged in already in tradingview so all I did was to click on the three horizontally lines that is at the left hand side of the homepage. The screenshot below shows the place to click.

Screenshot from Tradingview.com
• When you click the three lines,it will open up a new page where there are many options,click on "chart". It is indicated in the below screenshot.
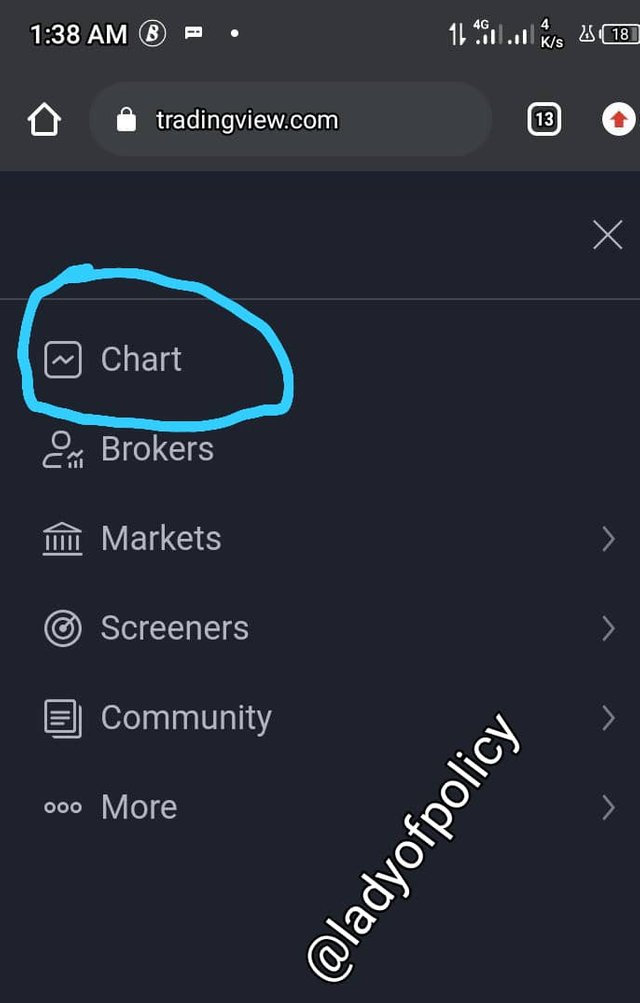
Screenshot from Tradingview.com
• Once you click on the chart,it will open up another page and there a chart will appear. The chart page has a lot of tools on it which one of them is indicators so I clocked on the indicators as displayed in the screenshot below.
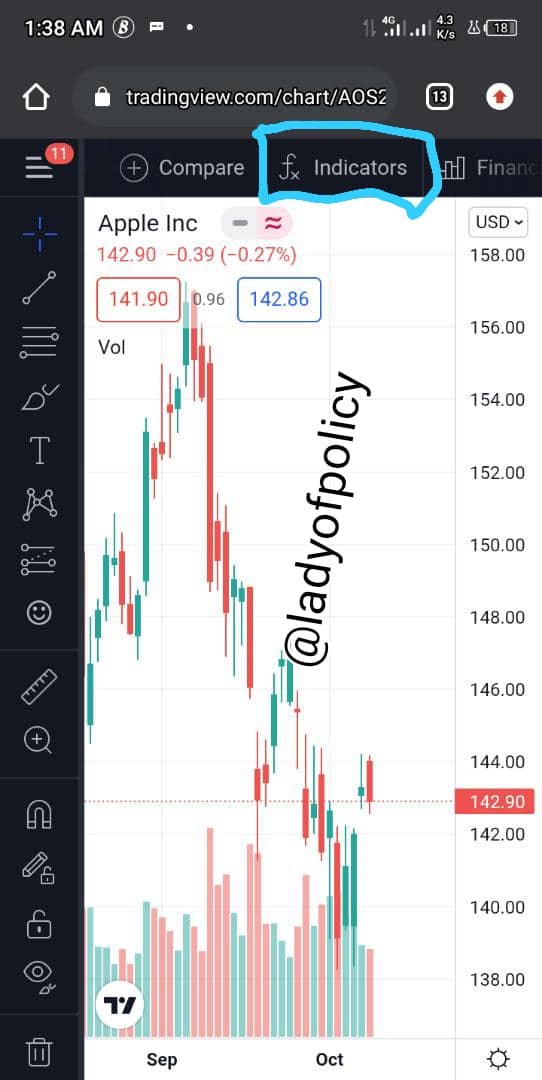
Screenshot from Tradingview.com
• As I clicked the indicator,the next page that opened contains different types of indicators used for trading so I selected accumulation/distribution indicator as shown in the screenshot below.
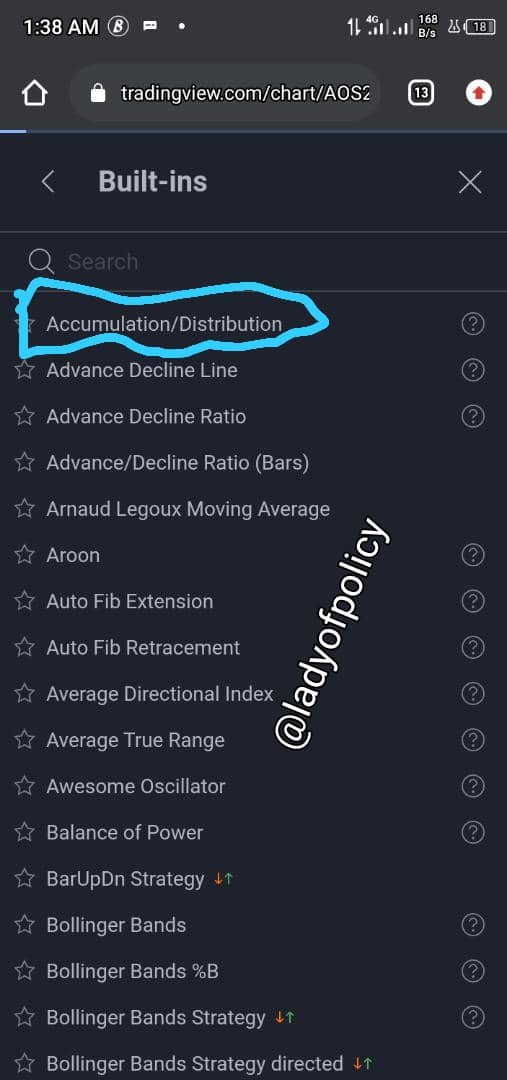
Screenshot from Tradingview.com
• The moment I clicked on the accumulation/distribution indicators,it reflected on the chart immediately as shown in the screenshot below.
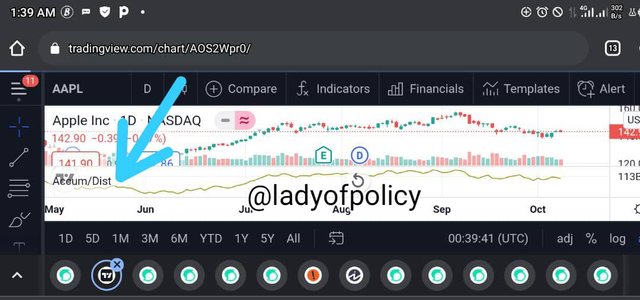
Screenshot from Tradingview.com
• With this, we have successfully added A/D indicator to a chart.

QUESTION NO 3.
EXPLAIN THROUGH AN EXAMPLE THE FORMULA OF THE A/D INDICATOR. (ORIGINALITY WILL BE TAKEN INTO ACCOUNT).

In this particular question,I will like to explain the A/D indicator formulae with an example.
In calculating A/D indicators,the formulae has three parameters which are;
•### Money Flow Volume and it's formulae is
Close = Closing price of a period
High = The highest price of a period
Low = The lowest price of a period
The Flow of Money is calculated when we subtracts the from the close price in the given period minus the difference between the highest and closing prices. The result is then divided by the highest and lowest price difference.
Now I will use an example taken from BTCUSD chart from tradingview.com to explain the formulae.
Let's first calculate money flow multiplier from a real example taken from BTCUSD Chart.
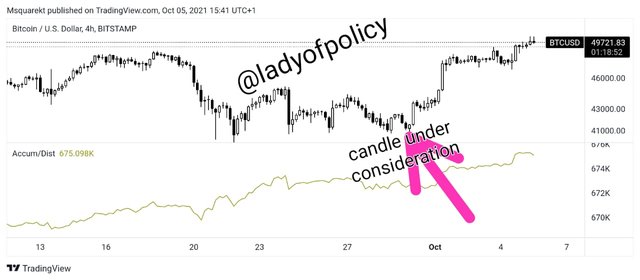
Screenshot Showing Candle under consideration
source
The screenshot above shows BTC/USD Chart of a weekly time frame. The arrow in the screenshot shows candle under consideration which is 7 day period.
I will like to find the value of the high, close and low of this period.
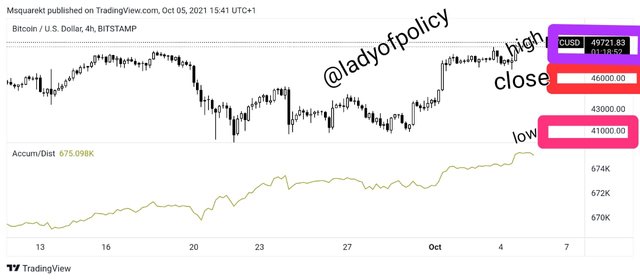
Screenshot showing the value of low,closed and high under consideration
Source
Calculate for the Money Flow Volume.
MFV = MFM × VP
Where,
MFM is money flow multiplier
VP = Volume of the period
The Money Flow Volume can be calculated by multiplying the money flow by the period volume (the asset volume being traded at the given period)
How to calculate accumulation and distribution line.
Where;
A/D = Accumulation/Distribution
P(A/D) = Previous accumulation and distribution
MFM = Money flow multiplier
MFV = Money flow volume.
The Accumulation/Distribution indicator line can be derived from the multiplication of the previous A/D line by the Current money flow volume. If it’s the first calculation, use the money flow volume value as the first value.

QUESTION NO 4.
HOW IS IT POSSIBLE TO DETECT AND CONFIRM A TREND THROUGH THE A/D INDICATOR? (SCREENSHOTS NEEDED)

I will like to explain how you can detect and confirm a trend using the A/D indicators. Whether it's an uptrend or a downtrend,you can use A/D indicator to explain the current situation in the market whether an asset is undergoing accumulation or distribution phase.
• Uptrend
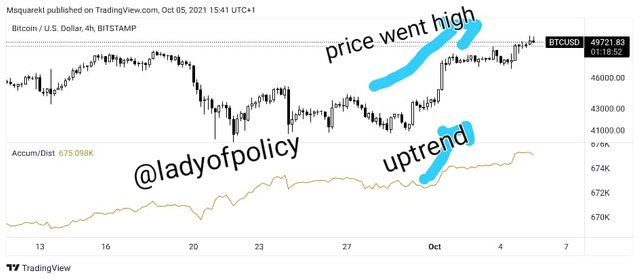
Screenshot from tradingview.com*
Looking at the screenshot above you can clearly see that the price is going up,which shows higher high and higher lows. Now if you take a closer look at yeh A/C indicator,you will also notice that it's moving high in accordance with the price which also shows higher high and higher lows,this is the easiest way to detect and confirm a trend using A/D indicator.
Also note that for the price of an asset to be on uptrend and the A/D line is moving up, it means that money is circulating into the asset and traders are buying up and holding on to the asset. This means the asset is in demand, and the buying pressure is higher than the selling pressure which shows that it's accumulation phase of that asset.
• Downtrend
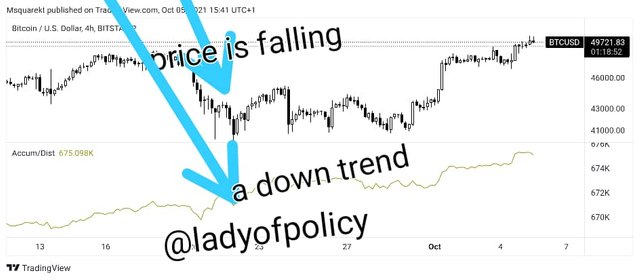
Screenshot from tradingview.com*
Taking a closer look at the screenshot above you will notice that the price is going down and also the A/D indicator is going down as well. This simply mean that at this particular point,the trend is bearish means that money is moving out of the asset and the investors are distributing of the asset.
This simply means that a downtrend occurs at a point where there is a decrease in the demand of an asset thereby causing distribution of assets.

QUESTION NO 5
THROUGH A DEMO ACCOUNT, PERFORM ONE TRADING OPERATION (BUY or SELL) USING the A/D INDICATOR ONLY. (SCREENSHOTS NEEDED).


QUESTION NO 6
WHAT OTHER INDICATOR CAN BE USED IN CONJUNCTION WITH THE A/D INDICATOR. JUSTIFY, EXPLAIN AND TEST. (SCREENSHOTS NEEDED).

Although A/D indicators are good for trading but it still has its lapses in the sense that it's not sensitive enough to movements or in other English it lacks trading signals. Aside that, it doesn't consider changes of price in periods but only consider the period close.
So considering the lapses of A/D indicators, it will be good if it can be used alongside other indicators in other to get a perfect result.
I will go with RSI indicator because it's easier for me and I understand it better than other indicators. The RSI indicator is a momentum oscillator that shows the overbought and oversold levels in an asset and when paired with A/D oscillator it will give an amazing result because the RSI indicator will act as an excellent complementary tool.
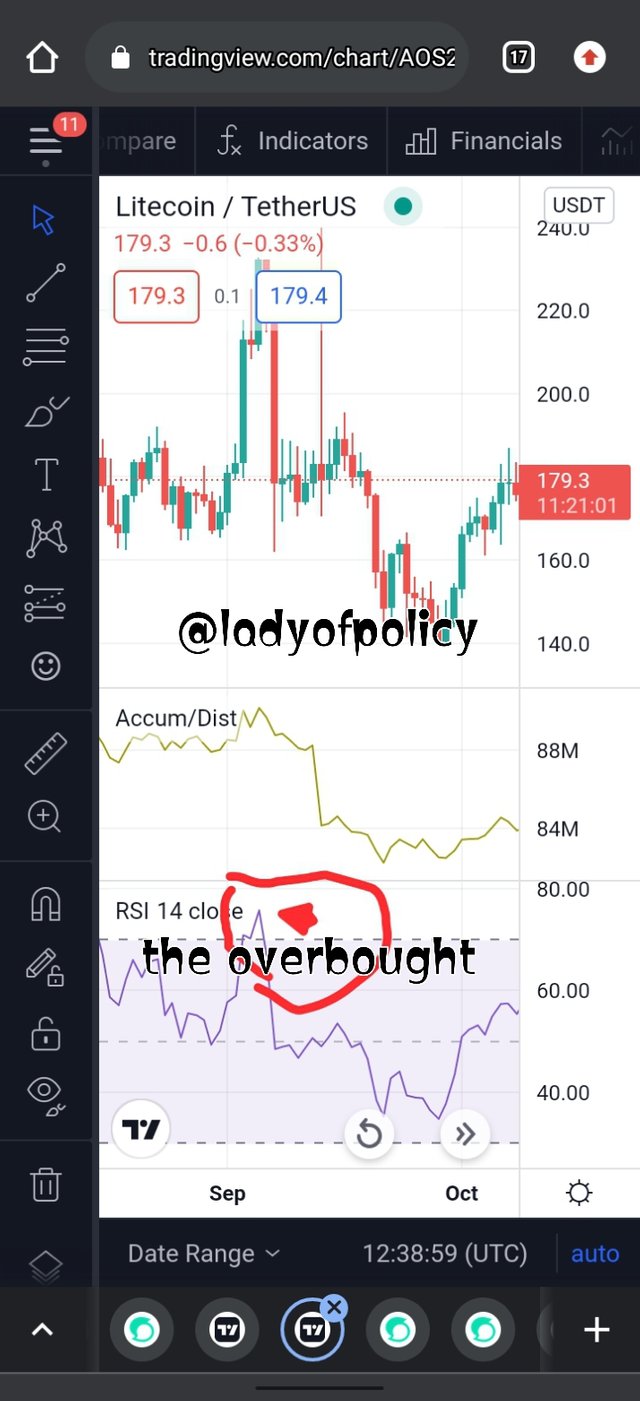
screenshot taken taken from trading view
Take a closer look at the chart above you will see that at the point when the price moved to the overbought level, the RSI gave a signal to the traders to sell-off their asset because at this point the asset has been overpriced but the A/D indicators didn't give any signal but rather it kept on moving to the price direction.
So the pair between RSI and A/D indicator in the chart above was a good one because with only the A/D indicator the trader will encounter loss.
CONCLUSION
Frankly speaking,this topic is really tough on me. I haven't used any indicator before in all my transactions and trading although I have a little knowledge about RSI indicator.
Am going back to study this topic more,I only made the little attempt according to the little knowledge I grabbed from the lectures but for Question number five,I couldn't answer it correctly due to little understanding of the topic.

Although A/D indicators are good for trading but it still has its lapses in the sense that it's not sensitive enough to movements or in other English it lacks trading signals. Aside that, it doesn't consider changes of price in periods but only consider the period close.
So considering the lapses of A/D indicators, it will be good if it can be used alongside other indicators in other to get a perfect result.
I will go with RSI indicator because it's easier for me and I understand it better than other indicators. The RSI indicator is a momentum oscillator that shows the overbought and oversold levels in an asset and when paired with A/D oscillator it will give an amazing result because the RSI indicator will act as an excellent complementary tool.

screenshot taken taken from trading view
Take a closer look at the chart above you will see that at the point when the price moved to the overbought level, the RSI gave a signal to the traders to sell-off their asset because at this point the asset has been overpriced but the A/D indicators didn't give any signal but rather it kept on moving to the price direction.
So the pair between RSI and A/D indicator in the chart above was a good one because with only the A/D indicator the trader will encounter loss.
CONCLUSION
Frankly speaking,this topic is really tough on me. I haven't used any indicator before in all my transactions and trading although I have a little knowledge about RSI indicator.
Am going back to study this topic more,I only made the little attempt according to the little knowledge I grabbed from the lectures but for Question number five,I couldn't answer it correctly due to little understanding of the topic.