Hi all, In this Today lecture from @reddileep, I learn another new Technical Analysis Using Fractals.
Thank you very much for this amazing lecture to us.

Define Fractals in your own words

A lot of Traders strongly believe Market Move is based on past data. That's why they always try to define upcoming market conditions based on Past Data.
Identifying upcoming patterns based on previous data Fractals helps a lot. Because it generates Fractals based on the last candlestick patterns in that specific Time Frame.
Fractal Mathematical calculation is very hard to derive because it works based on Candle formation. But we get a lot of Fractal patterns in any assets chart at any market condition.
So with help of Fractal, we can do easy and profitable Trades.
For identifying Fractal We need good observation skills, then only possible to identify those very easily.
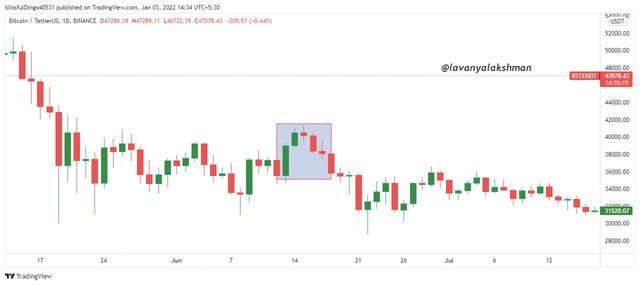
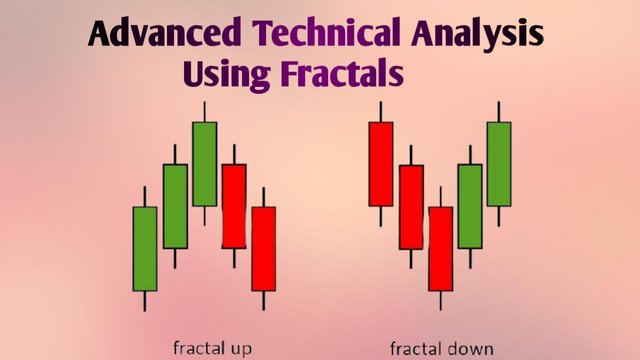
In Fractal identification, we get only two types of Trend Reversals. One is the Bullish Trend, another one is the Bearish Trend.
For identifying Trend Reversal and upcoming Market Direction, first, we need to observe five consistent candlesticks in a chart pattern.
Bullish Reversal occurred when middle bar form lowest low and two higher lows on both sides.
Similarly, Bearish Reversal occurred when Middle Bar Forms Highest High and two lower highs on both sides.
Trading Based On Fractal:-
Now we understand how to form fractals and how to identify those on chart patterns.
Now we try to learn how to trade based on Fractal.
Here we get two scenarios one is Bullish Trend Reversals, another one is Bearish Trend Reversals. Now we try to understand how to set up our positions based on those.
For identifying fractals we need to observe 5 consistent candles on the chart pattern in the specific period.
Trading Setup Based on Bullish Fractal Reversal
Bullish Trend Revels occurs when we get when the middle bar form the lowest low and two higher lows on both sides.
So when we see a forming lowest low of Middle bar along with Two Higher Lows on a previous candlestick, It indicates us soon market start fall, so it's a signal for upcoming Bearish Trend.
In this situation, we need to wait to place a sell short order when we get an opportunity.
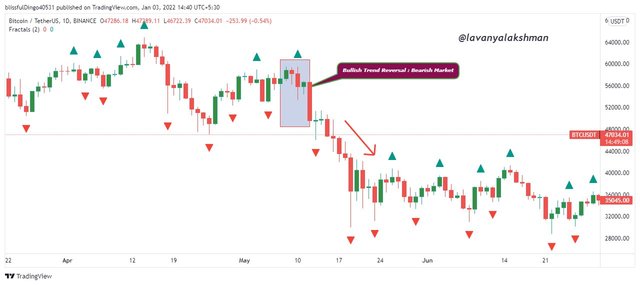
It's simply looking like opposite v pattern ^, like that pattern we get in the chart, it's an indication for the upcoming Bearish Market.
Trading Setup Based on Bearish Fractal Reversal:-
Bearish Reversal occurred when Middle Bar Forms Highest High and two lower highs on both sides.
So when we see forming highest high of Middle bar along with Two lower highs on a previous candlestick, It indicates us soon market start move upward direction so it's a signal for upcoming Bullish Trend.
In this situation, we need to wait to place buy long order when we get an opportunity.
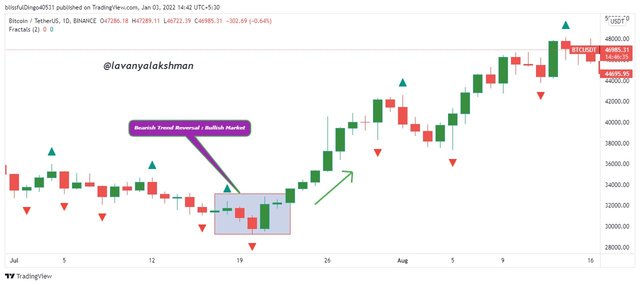
It's simply looking like v pattern, like that pattern we get in the chart, it's an indication for the upcoming Bullish Market.
Like that based on Fractal, we can set up our trades very easily.

Explain major rules for identifying fractals

In any assets chart, we get a huge number of Fractals at a specific time frame. But identifying those is not so easy. For identifying valid Fractals we need to follow some rules. Those are:-
- For identifying Valid Fractal we must consider 5 candle Bar. Don't take more than 5 bars or below 5 bars, it does not give accurate results, it also doesn't call as Fractal.
So for identifying Valid Fractal we must choose 5 Candle Bars on the chart at any specific period.
In general, we get two types of Fractals. One is Bullish Fractal, another one is Bearish Fractal. No other we get in Fractal Identification.
For Identifying Bullish Fractal, we must observe Middle Candle. If the Middle candle form Lowest Low and either side of candles form Higher Lows, then we considered it as Bullish Fractal pattern form here on the chart.
So then after we can see Upward Direction movement in the market.
- This Bullish Pattern looks like 'V'.
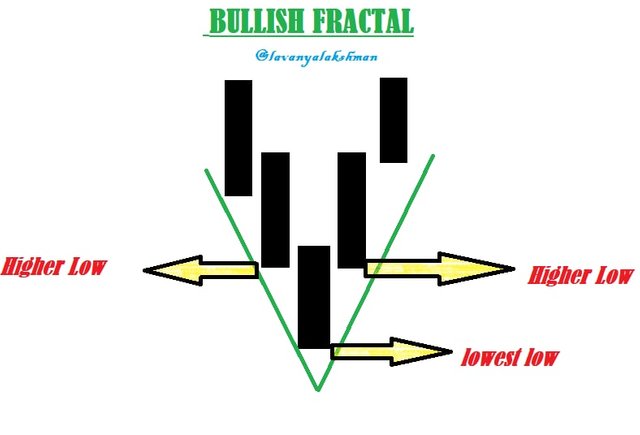
When we get Bullish Fractal on the chart, it signifies the upcoming Bullish Market so we can place Buy longs When we get the opportunity.
Similarly for Identifying Bearish Fractal, We must observe the middle candle. If the Middle candle form Highest High and either side of candles form Lower High, then we considered it as Bearish Fractal pattern form here on the chart.
So then after we can see Downward Direction movement in the market.
- This Bearish Pattern looks like the opposite V means '^'.
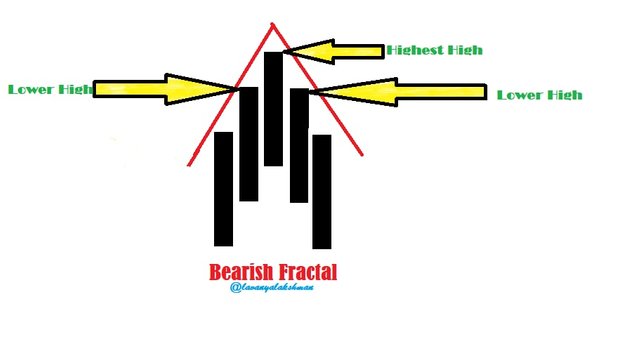
- When we get Bearish Fractal on the chart, it signifies the upcoming Bearish Market so we can place Sell Shorts When we get an opportunity.
Like that on following the above rules, we need to identify Valid Fractals on our chart. But identifying those is not so easy task. Need patience and observation skills.

What are the different Indicators that we can use for identifying Fractals easily?

Identifying fractals is not so easy task. So in the market, we have some technical tools for identifying Fractals. So by applying those on our chart we can identify valid Fractals very easily.
From this Fractals, Fractal support and Resistance, Fractal Breakouts, Fractal Highs and Lows, Fractal levels and many more available. From this Fractals is the most popular and well familiar tool in crypto trading.
Fractals is also one of the Technical Analysis Tool introduced by famous Trader Bill Williams in his book ‘Trading Chaos’. That's why this indicator is also known as Williams Fractal.
But in the market, we have a lot of other Technical Tools to identify Fractals but from this Williams Fractal is the most familiar and popular indicator.
Bill Williams developed this Indicator based on Chaos Theory and Traders psychology. That's why it always give profitable signals to us. But it generates very few signals in the higher time frame that's why they always give 100% profitable signals.
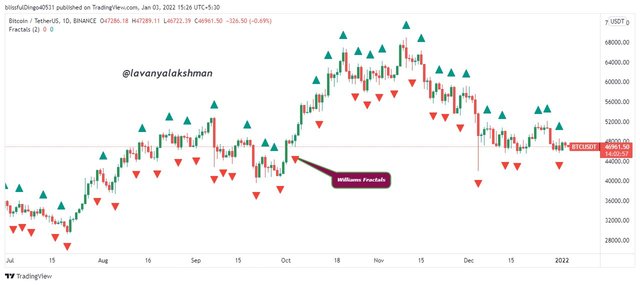
Coming to short term, it generates huge signals to so, that's why we get some fake signals too. That's why this indicator is suitable for long periods, at least 15 to 30 minutes and more than that is recommended.
Williams Fractal indicator simply look like a Five Bars Model. It helps us to identify possible reversal points and trend direction.
Technical Expects always follow Five Bars Model before giving their entry. They strongly believe this strategy always give profitable trades.
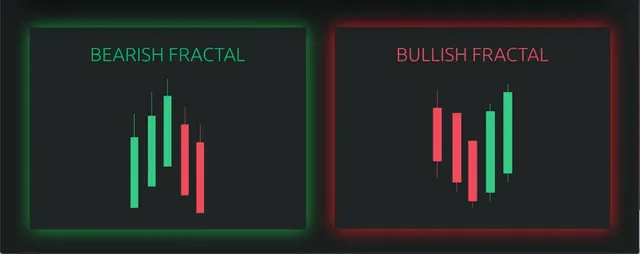
In the above example, we see Bullish Fractal and Bearish Factor. Those we identify based on Third or Middle Bar Position.
If the Middle bar makes Highest High on the previous Two Bars it is considered as Bullish Fractal, otherwise, if it forms Lowest Low then it is considered as Bearish Fractal.
Based on this strategy William Fractal generate signals to us.
Using William Fractal Indicator we can also identify potential Breakouts on observing the previous Fractal with Current Fractal.
Here we get Bullish Breakout or Bearish Breakouts.
- Bullish Breakout Appears when the price starts moving on breaking the previous Upward Fractal. After this Breakout, we get Bullish Market. So based on this signal we can place our orders.
- Bearish Breakout Appears when the price starts to move below the previous Downward Fractal. After this Breakout, we get Bearish Market. So based on this signal we can place our orders.
Like that we can also identify Breakouts with help of the William Fractal indicator.
Adding William Fractal on Our Chart
For this illustration here I choose TradingViewplatform.
So I just go to TradingViewplatform then open my required assets chart on a window.
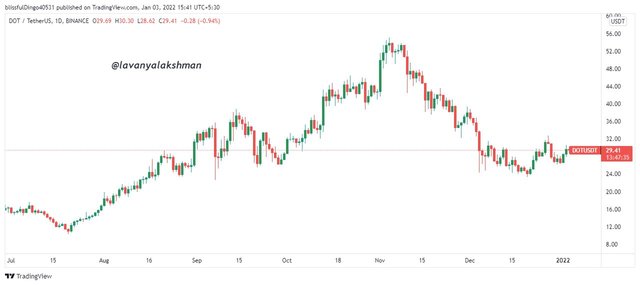
For example here I open DOT/USDT chart.
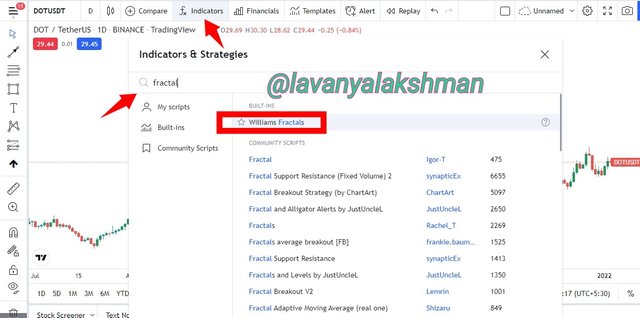
- Then select the Indicator tab, In the search bar just Type Fractal. From this Drop down menu select Williams Fractal.
- Now it successfully added to my chart.
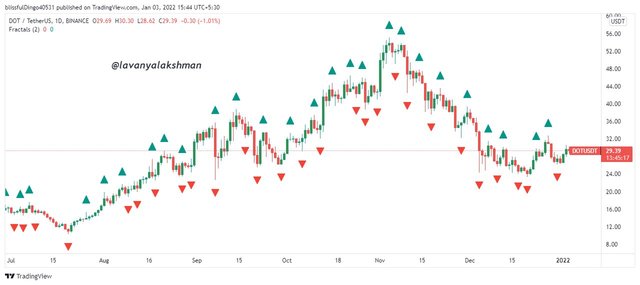
Like that we can add Fractals on any assets chart as per our needs.
Here we see a lot of Green and Red Arrows. Those are Buy and Sell signals. As per our need, we change those. By default Red Bar indicates possible Buy Entries, Green Arrow Represents Sell Entries.
Based on this we can place our orders very easily.
Fractal Support Resistance(Fixed Volume)2 by SynapticEx
This also another simply read Indicator.This one also we can add on our chart very easily.
Just pick your Desire chart,then select Indicators tab. In search bar search Fractal. In drop down menu select Fractal Support Resistance(Fixed Volume)2 by SynapticEx.
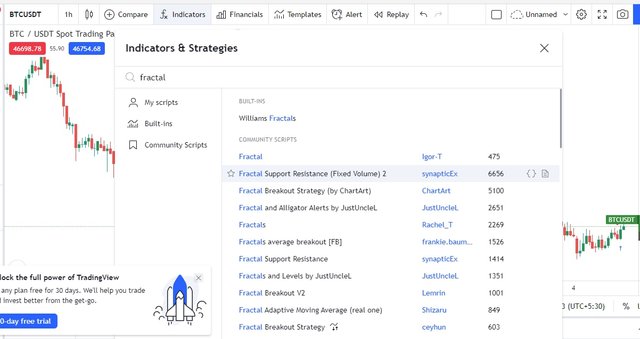
Now it successfully added on my chart.
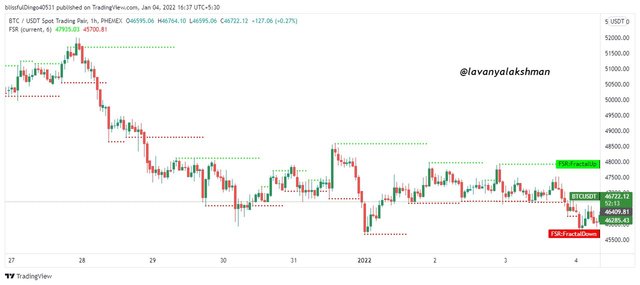
This Indicator shows Support and Resistance Fractal, in form of Horizontal lines.
Here Red colour line indicates Resistance and the Green Colour line Indicates Support.
So based on this we can do our trading very easily. But I don't know how much success rate we get on doing trading based on this Indicator.
Fractal Breakout Strategy
This Indicator looking a little bit clumsy but on understanding chart, we can do our trading very easily.
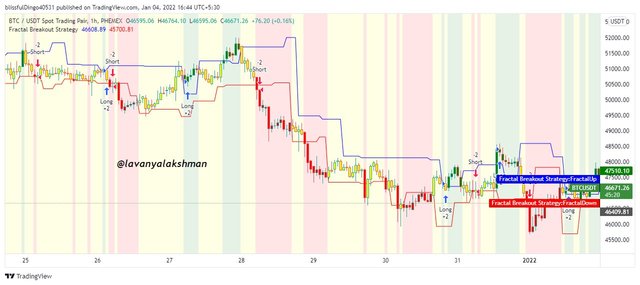
Here we get Long/Short signals based on Fractal Breakouts. So it generate very less signals.
And also showing those signals in form of colour backgrounds.
So blindly on following back ground colours also we can do our trading. But those are not give 100% accuracy signals always.So don't trade blindly with those signals,always keep an eye on market move.
Like that we having lot of Fractal Related Indicators. But from this Williams Fractal Indicator only well known and Popular. So recommend to use Williams Fractal Indicator for Trading needs.

Graphically explore Fractals through charts.

Using Fractal tools we can easily identify Trend reversals and Market Direction. But identifying manually is not so easy task. But we can do it by practice very easily.
For helping us Tradingview has one amazing Tool that is Bar Pattern.
Using this we can copy-paste the previous graph on the moving chart very easily.
From this, we can easily identify present Market move with help of past data.
I try to explore this action on the chart. From this illustration here I choose TradingViewplatform. For this demonstration here I choose ETH/USDT 1 DAY Chart.
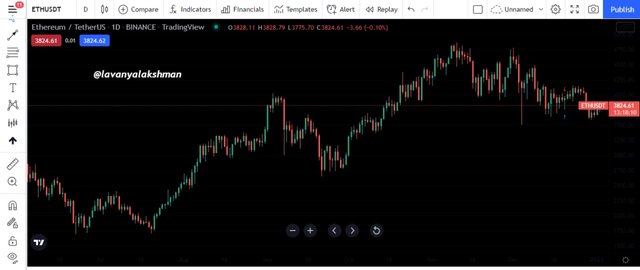
Then on the left side of Trading View, we have a lot of Tools from this choose Prediction and Measurable Tools, In this Drop Down Menu select Bars Pattern Tool.
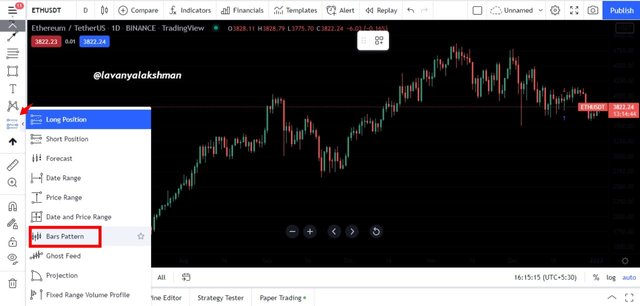
After selecting Bar Pattern Tool, then draw a line from left to right as our desired points on the past chart pattern.
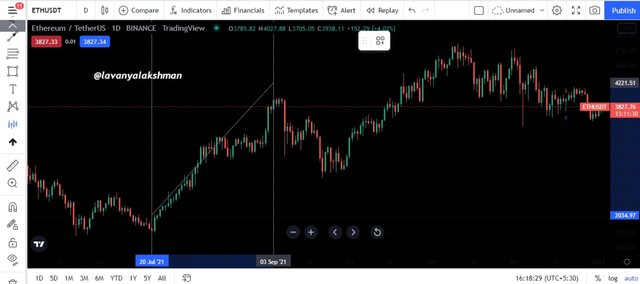
From Drawing like this we get Movable chart pattern for that range.
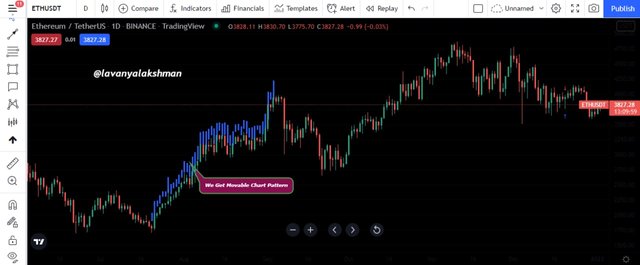
After that, we easily copy-paste this Movable Chart Pattern into the current running Suitable Point. By doing this we can easily identify Trend reversals based on past data.
For Example, here I copy and paste this Movable chart pattern into another suitable point.
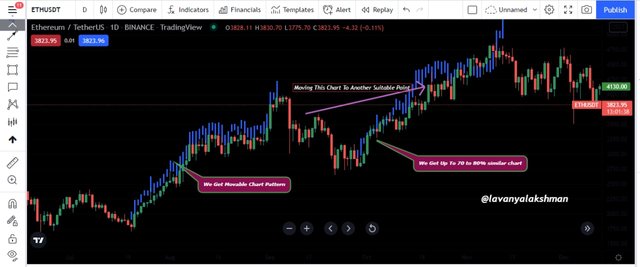
After copying that movable chart into another suitable point on the running chart, we see some similarities in both patterns. It nearly matches 70 to 80% not 100%.
Like that we can easily identify Trend Reversals based on past data very easily.
For identifying like those reversals we have another tool. That is Fibonacci Retracement Levels. By using this Tool also we can easily identify Trend Reversals very easily.
Here also we getting a similar chart Pattern.
But those are not always valid, some times due to Market conditions it may move based on past data but it may not too.
Market makers always try to manipulate, so be careful on doing trading with help of these Tools.

Demo Trade

For this illustration, I choose BTC/USDT, 45 Minutes Chart.
I am not that's much expert on doing this advanced trading, that's why I use TradingView Paper Wallet for this demonstration.
Then after applying Williams Fractal indicator along with 2 EMA's of 20 and 50 like this.
Here I also change the colour for EMA's for easy Identification.
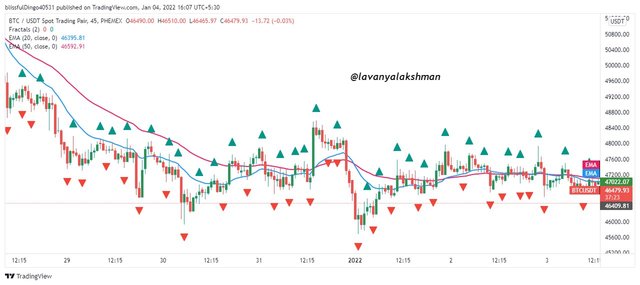
Now I observe the chart for giving my entries. In before we discuss Bullish or Bearish Market Identification based on Fractal.
Lot of them getting confused on seeing those Red and Green Arrows of Fractal. Those we can change as per our needs too.
But here I don't change any default setting of Fractal. So here Red Colour Arrows William Fractal Indicator Indicates Buying signal, while Green Colour Arrows indicates Sell Signal.
For getting valid entry here I use 20 and 50 EMA's. On applying all together we can identify valid Buy/Sell entries very easily.
Here we need a lot of patience for getting a valid entry, so try to observe Market Move closely.
Finally, I get one Sell entry after waiting so much time. So I place my Order like this.
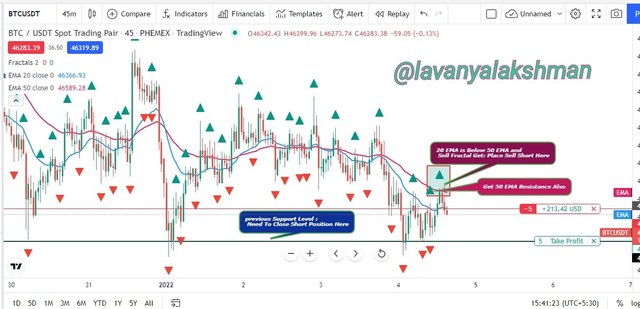
Here EMA 20 Moving Below EMA 50, Means Bearish Market, and also get strong Resistance at 50 EMA.
Fractal also give Sell Signal, that's why here I place my Sell Short Order like above.
Along with placing my Profit booking point at the previous Support Area. May be price may bounce back after reaching that point, or it may go further down. That's why I place my Target Point at the previous Support Point.
Like that, I set up my Sell Short Entry based on Fractal and EMA Signals.
Here is my Trade History, we can check.
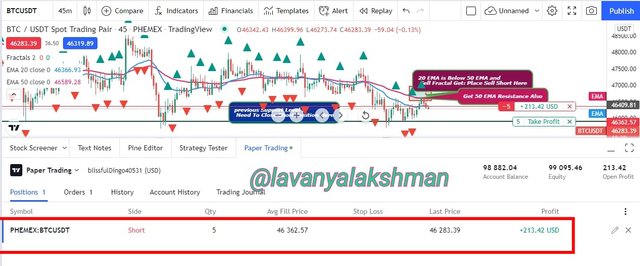
For getting like these valid entries we need patience and observation skills.

Conclusion

Fractal is also one of the Technical Indicator. Using this we easily identify Trend Reversals, Buy points, Stoploss points, Exit points, and Breakouts too.
For generating signal it consider 5 bars, so based on this we can also identify Support and Resistance levels too.
It is a logging indicator, for generating signals at least it needs 2 closing candles so it takes time to generate the signal so if we follow this signal blindly for trading there is a chance to lose our money.
So always try to apply this Indicator along with other Indicator.
This Indicator is only useful in the Trending Market, In the sideway Market, this Indicator is not a good choice.
Indicators always do not give 100% accuracy signals, so don't trade blindly with help of Indicators.

Thank you professor @reddileep for this amazing lecture to us.
Thanks For Reading My Post
Hey where are you, long time no see
Downvoting a post can decrease pending rewards and make it less visible. Common reasons:
Submit
Busy on personal work. I will active soon. Thanks for remember me.
Downvoting a post can decrease pending rewards and make it less visible. Common reasons:
Submit
No worries, take your time, all the best
Downvoting a post can decrease pending rewards and make it less visible. Common reasons:
Submit
👍
Downvoting a post can decrease pending rewards and make it less visible. Common reasons:
Submit