.jpeg)
Thanks for making it a wonderful lecture for us.

What do you understand about the Concept of Dynamic Support and Resistance? Give Chart Examples from Crypto Assets.
In general Professional Traders always do trading based on Support and Resistance Levels. Based on those they give their entry as per their needs.
We identify these Support and Resistance levels on drawing Horizontal lines, But sometimes the Market goes in Waveforms. Means on creating Higher lows or lower lows in this situation we cont draw Horizontal lines for identifying Support and Resistance levels.
So traders use Trendlines or Exponential Moving Average Indicator for identifying Support and Resistance levels.
That support and resistance levels are also called Dynamic Support And Resistance Levels.
Based on Dynamic Support And Resistance Levels we can do trading in any situation and exit with profit.
Exponential Moving Averages is similar to Simple Moving Averages but it gives more confirmation before the trend get a reversal. In simple moving averages, it taking time for showing trends because it taking some time for a showing. But through EMA we solve this issue, so we took our positions before the trend gets reversed.
Through the chart, I try to explain the concept of Dynamic Support and Resistance Levels.
Example of Dynamic Support on Chart
Here I taking BNB/USDT 4 Hour chart, and use EMA 50 for understanding Market trends.
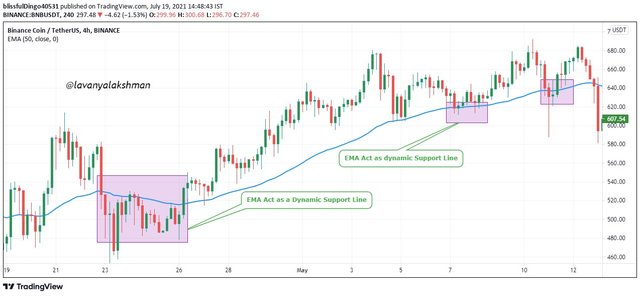
In this chart, we can see that in 3 places market try to pull back but due to Dynamic Support in that particular time frame, the Market again gets pull back and go in Upward Direction.
Like that Dynamic Support Line Act as a Strong Support in that Particular area. Because it always keeps the Market in its Moving Direction. Here we see Uptrend Market.
Example of Dynamic Resistance on Chart
Here I taking ETH/USDT 1Hour chart and use EMA 50 for knowing Dynamic Resistance Level.
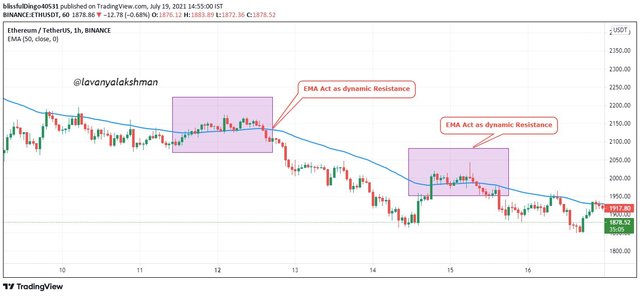
In this chart, we see in 2 places it start to go Upward direction but due to a Strong Dynamic Resistance level, It again Starts to going in Down Trend.
Like that Dynamic Resistance Act as strong resistance in that area in the particular time frame. Here we see Downtrend Market.
By using EMA 50, We can analyse in which direction the market going now. This indicator we can use in a Short time frame also for day trades needs.

Make a combination of Two different EMAs other than 50 and 100 and show them on Crypto charts as Support and Resistance.
On using 2 EMA indicators in different combinations Traders get clarity on observe Market trends. Thanks why Traders always use 2 EMA's before took their position. Using these 2 EMA's we get more clarity on support and resistance levels, and also possible to identify Target and Stop loss areas also in a Particular Time Frames.
In general, 50 and 100 EMA combinations give accurate results, because this line move is based on previous 50 days, and 100 days closing prices. But for some short term trades needs, we can use 9 and 21 EMA or 25 and 50 EMA's for Swing Trades needs.
For this Demonstration I using 9 and 21 EMA's on my Chart Respectively
9 and 21 EMA as Dynamic Support
For demonstration I taking 9 and 21 EMA's on my DOT /USDT 1 hour chart.
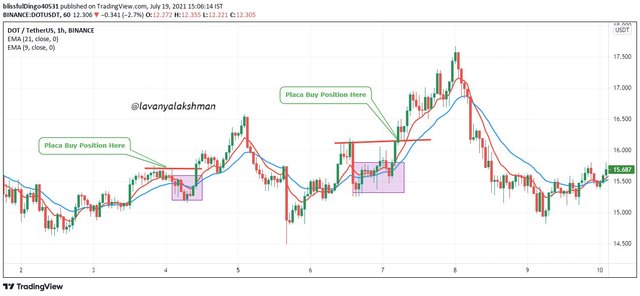
In the above chart, we watch how these Dynamic Support Levels support moving the Market in an Upward direction after getting Pullbacks.
Here in 2 to 3 places Market start going the opposite direction but due to Dynamic Support in that area, it again moves its original Trend.
9 and 21 EMA as Dynamic Resistance
For Demonstration, I apply 9 and 21 EMA's on my SOL/USDT 15 minutes Chart.
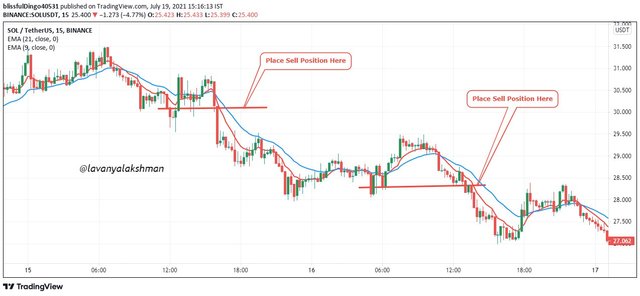
In the above chart Market shows 2 to 3 places for going Upward direction but due to Dynamic Resistance, it again moves it's an original trend. Again it starts dumping after reaching Dynamic Resistance Level.
Like that on using 9 and 21 Exponential Moving Averages Dynamic support and resistance levels, we can take our positions and Exit with profit in a short period.
But those EMA's only short term intervals are only useful but Most recommend 50 and 100 EMA's levels. It gives a perfect Market structure, Mostly I use those for my trades needs, Dome times I use 9 and 21 EMA's also.

Explain Trade Entry and Exit Criteria for both Buy and Sell Positions using dynamic support and resistance on any Crypto Asset using any time frame of your choice
Based on Dynamic Support And Resistance levels we can take our positions and Exit with profit also. But here we need to wait until we get confirmation from Trend, Then only we can give took our position otherwise, you may get lost. So be patience here.
Trade Entry Criteria For Buy Position Using Dynamic Support Level
For this Demonstration, I using 50 and 100 EMA's respectively.
First need to add 50 and 100 Exponential Moving Averages on our chart.
Here we placing Buy Setup so Price Should we be above the Exponential Moving Averages for placing valid Buy Position.
Now we need to wait until price should Touch This Exponential Moving Averages lines, But don't place buy position after Touching this line. Because sometimes we see some pullbacks so it goes the opposite direction, then again it goes it's an original trend. So wait some time here for getting confirmation. Otherwise, our setup gets invalid.
For valid set up we need to wait until price Touch EMA's and again go Upward Direction.
If you see after Touching EMA's it goes Upward Moment then place your Buy position in that particular area.
Like that, we can place Buy Positions Based on Dynamic Support Level.
Here we get a lot of opportunities, so if you miss one opportunity again wait for another one. Don't do harsh trading.
Trade Exit Criteria For Buy Position Using Dynamic Support Level
Now we know how to take our position, now we also know how to exit this position with profit.
For any trade always keep Stop Loss, it avoids further huge losses in Trade.
In this Buy Position, we need to keep our Stop loss Below EMA's levels.
Here if our Trade reach Stop loss before hitting Target Price, It means our Position is Invalid, so now we need to wait for another setup.
Here Take Profit I set in 1:1 ratio. This means if the Trader wishes to lose $100, the Profit is also $100.
Here loss and Profit are in the same ratio. It is our risk and reward ratio. Always use 1:1 until we get perfection in Trading.
- When our Trade Reach our Target price we must book our profit and Exit from trade.
Crypto Future Trading is always Risky so always try to book your profit, markets go the opposite direction at any time. So be careful.
For this Trade Demonstration, I using 50 and 100 EMA's on ETH/USDT 15 Minutes Chart.
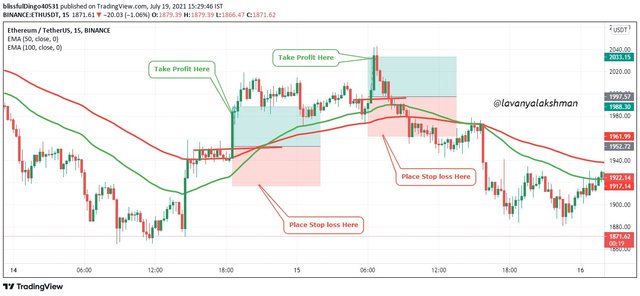
In the above chart, I mark my entry and exit criteria based on Dynamic Support Level and Stop Loss and Target Price at 1:1 Ratio.

Trade Entry Criteria For Sell Position Using Dynamic Resistance Level
For this Demonstration, I using 50 and 100 EMA's respectively.
First need to add 50 and 100 Exponential Moving Averages on our chart.
Here we placing a Sell setup so Price Should be below the Exponential Moving Averages for placing a valid sell Position.
Now we need to wait until price should Touch This Exponential Moving Averages lines, But don't place buy position after Touching this line. Because sometimes we see some pullbacks so it goes the opposite direction, then again it goes it's an original trend. So wait some time here for getting confirmation. Otherwise, our setup gets invalid.
For valid set up we need to wait until price Touch EMA's and again go downward Direction.
If you see after Touching EMA's it goes downward Moment then place your Sell position in that particular area.
Like that, we can place Sell Positions Based on Dynamic Resistance Level.
Here we get a lot of opportunities, so if you miss one opportunity again wait for another one. Don't do harsh trading.
Trade Exit Criteria For Sell Position Using Dynamic Resistance Level
Now we know how to take our position, now we also know how to exit this position with profit.
For any trade always keep Stop Loss, it avoids further huge losses in Trade.
In this Sell Position we need to keep our Stop loss above EMA's levels.
Here if our Trade reach Stop loss before hitting Target Price, It means our Position is Invalid, so now we need to wait for another setup.
Here Take Profit I set in 1:1 ratio. This means if the Trader wishes to lose $100, the Profit is also $100.
Here loss and Profit are in the same ratio. It is our risk and reward ratio. Always use 1:1 until we get perfection in Trading.
- When our Trade Reach our Target price we must book our profit and Exit from trade.
For Demonstration I taking ETH/USDT 15 Minutes chart, and apply 50 and 100 EMA's on my chart.
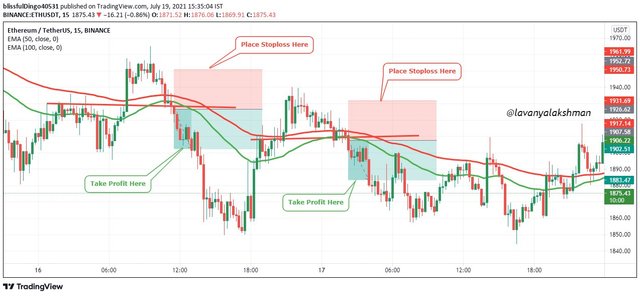
In the above chart, I mark my entry and exit criteria based on Dynamic Resistance Level and Stop loss and Target at 1:1 Ratio.

Demo Trades Using Dynamic Support and Resistance Levels.
At the present market going Downtrend, I decided to do sell short. For these Demo trades I using Trading view Paper Wallet. Because I don't have perfect knowledge on doing Futures so I use this Demo wallet for showing my Demo Trades.
But first I decide to do sell short, but suddenly I see the Market slowly start recovering, that's why I go Buy a long Position based on EMA DYNAMIC SUPPORT LEVELS.
Analyzing the Market is very easy with using these support lines, But Practicing in the real Market It's not so easy. We need to wait until getting confirmation. Sometimes we identify entry points quickly, but sometimes it takes time.
I nearly spend 3 to 4 hours giving my entry, in some trades I lose due to wrong decisions, but finally, I get success.
Here I taking UNI/USDT 1minute chart, for taking my position. I apply 50 and 100 EMA, Support Lines for placing my Buy Order Position.
Before taking my position I observe the last 1-hour chart, I see the Market trying to go upside, But due to the Volatile of BTC it also shows some Down tred, But due to Dynamic Support It goes in an upward direction on its Orginal Trend Finally.
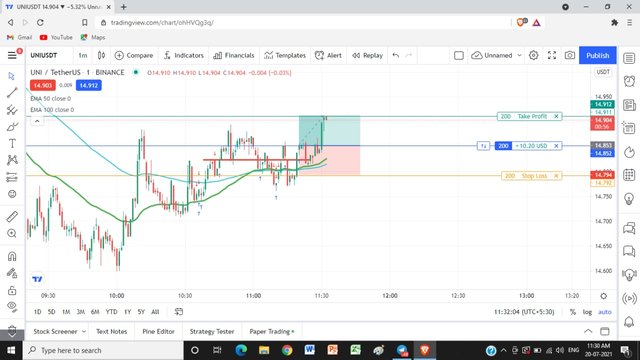
Before taking My position I wait until I get confirmation, Then immediately took the Market order, then place my Booking Profit Prices and Stop the loss 1:1 Ratio.

Demo 2
For the second set up again I use a 1-minute chart with 50 and 100 EMA's on DOT/USDT Chart.
Same like before, It also shows some upward movement after the Downtrend finish in this particular period. That's why I place my Buy Long Position.
Before reaching my target, It suffer a lot to go downside but due to Dynamic Support, it again starts moving in an Upward Direction. Finally I exit my Trade with Profit.
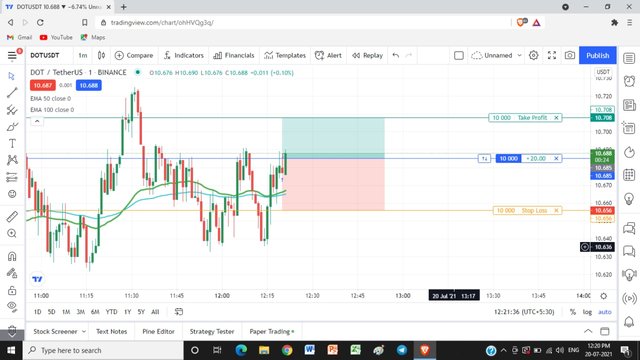
I place my Stop loss and Profit booking at 1:1 ratio.
Here is my Trade History

Like that we can give Buy long or shell shot with help of EMAs.

Conclusion
Exponential Moving Average Indicator shows Dynamic Support and Resistance levels, based on that we can take our positions.
EMA always keep the Market in Trend. If it get pullbacks, again it go it's an original trend.
Here we need to take our Position very faster otherwise we lose that opportunity.
Fast Decision Making we need, otherwise we lose that opportunity. If you place an order in the wrong way, then we lose our Money, because it hit our Stop loss.
If you miss one opportunity then wait for getting a good opportunity, don't be hurry.
Always keep Stop loss and Target Points after placing an order.
Coming to me 1:1 ratio is a good choice for keeping Stop loss and Profit booking areas.
In Trending Market on using this Indicators we can hive our positions but in Sideway Market this Indicator not Suitable.

Hope I finish all My Tasks Correctly, If any Verify Me.
Thanks For Reading My Post
Dear @lavanyalakshman
Thank you for participating in Steemit Crypto Academy Season 03 and making efforts to complete the homework task. You got 6/10 Grade Points according to the following Scale;
Key Notes:
*.In question no 03, you have marked 1st buy way to early because the price was just shifting above the EMAs. We need price already moving above the EMAs like your 2nd entry which is correct. Similarly, you could have created better charts for sell entry criteria.
We appreciate your efforts in Crypto academy and look forward for your next homework tasks.
Regards
@cryptokraze
Downvoting a post can decrease pending rewards and make it less visible. Common reasons:
Submit
Ok,Now I understand,what mistake I make,Need to wait until get clear indication about price movement.
Thanks for verify my entry.
Downvoting a post can decrease pending rewards and make it less visible. Common reasons:
Submit
Congratulations! Your post has been selected as a daily Steemit truffle! It is listed on rank 21 of all contributions awarded today. You can find the TOP DAILY TRUFFLE PICKS HERE.
I upvoted your contribution because to my mind your post is at least 6 SBD worth and should receive 18 votes. It's now up to the lovely Steemit community to make this come true.
I am
TrufflePig, an Artificial Intelligence Bot that helps minnows and content curators using Machine Learning. If you are curious how I select content, you can find an explanation here!Have a nice day and sincerely yours,

TrufflePigDownvoting a post can decrease pending rewards and make it less visible. Common reasons:
Submit