Thanks for making it like a wonderful lecture to us.
Source
First, we try to understand Commodity Channel Index means and using it his we trade. Then after we start trading using this Indicator.

Commodity Channel Index Means:
Commodity Channel Index(CCI) is also an Indicator, It measures the difference between the current price and the historical average price of a coin in a Specific Time Frame.
As like RSI, But different from it. On seeing CCI, we can identify overbought and our sold positions of a coin in the specific time frame.
Overbought means, soon that trend gets reversed so be ready to do a short sell.
OverSold means, It is in the bottom position soon the trend gets reversed so be ready to place buy long.
Like those decisions, we can take based on using the Commodity Channel Index indicator.
CCI is also an indicator of giving 100% accurate results, but it gives present trends regarding results. Using those details we can do out trades in a profitable way.
As like RSI here that ranges are not bounded that's why we see CCI ranges from -300 to +300 or many more combinations we can set as per our wish.
So here if CCI moves from 0 to 100, then we can consider it as Uptrend. So we can wait for a good position to place our Buy long Position. When it reaches +100 then we consider it is Strong Uptrend, so in each pullback, we can place Buy long Positions.
If CCI moves from 0 to -100 then we can consider that so downtrend may start so exit from long positions and wait for a good position for placing sell short. If it reaches -100, then we consider Strong Downtrend Started. So in each pullback, we can place Sell Short Positions.
Like that Indications, we get from Commodity Channel Index.

Open a demo account on any trading broker and select five cryptocurrency pairs.
For the Demonstration of my Demo Trades I using Paper Wallet in the Trading view. Because first, we practice on this Indicator then only we can do trades using real money. That's why I choose my demo account in Paper Wallet of Trading view.
For This Trades, I choose BNB/USDT, SOL/USDT, DOT/USDT, UNI/USDT, LINK/USDT.for showing my Trade Strategy using Commodity Channel Index(CCI).

DOT/USDT Entry and Exit, Trading Strategy Using Commodity Channel Index
For Applying my Trading Strategy I choose DOT/USDT 5 Minutes chart first in the Trading view platform.
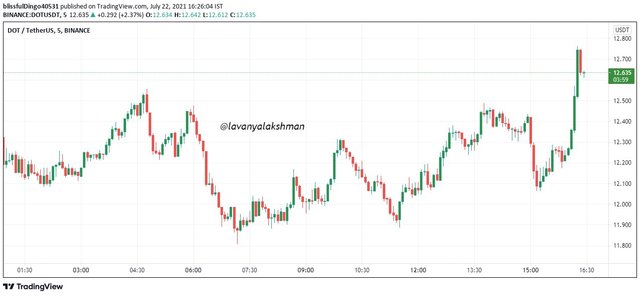
Then apply Exponential Moving Average(EMA: 50 ) and Commodity Channel Index(CCI) on My Chart.
Here I choose EMA for understanding at present, Market Which Direction going. Using this we get some clarity. So I choose that Indicator along with CCI.
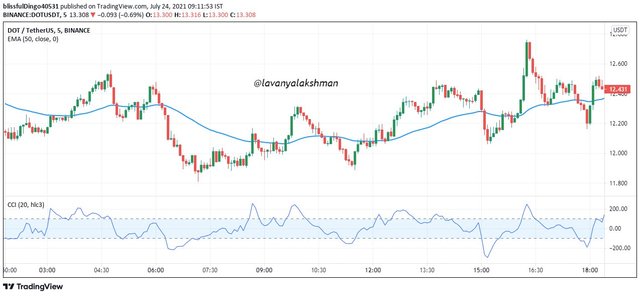
Now I observe CCI only on enlarge big size on my screen. On checking that I watch, now DOT at over bough position, it above +250, In previous 3 times, it gets resistance on this point. So I think this is its Strong Resistance at this point in this Specific Time Frame.
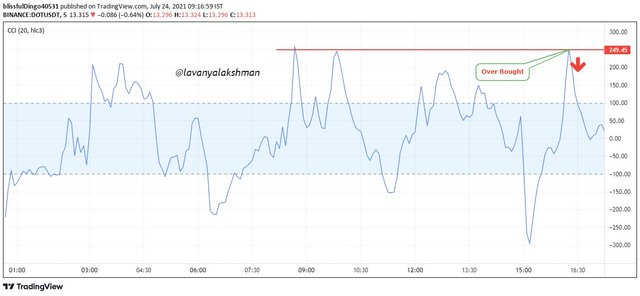
So I think after reaching that point, It 100% go Downtrend, That's why I think to Place Sell Shot at this Resistance point.
Now here I give my Entry At Resistance place, I exit at 1:1 ratio normally, but here we can wait until it reaches 0 lines, but it's always risky, there is a chance to again Trend Reversal, so I exit at 1:1 Ratio of the Entry point.
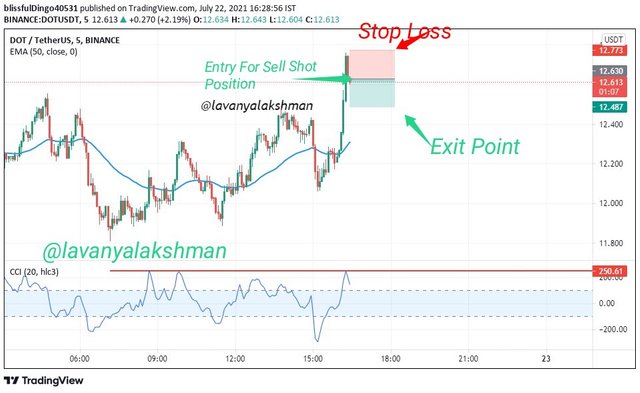
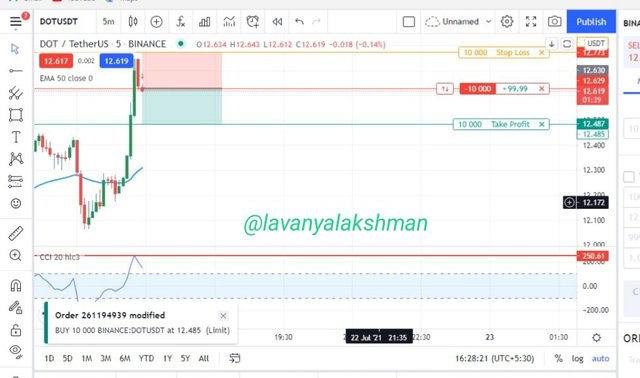
Means My Stop loss and Exit Points Both I Place 1:1 Ration from My Entry Point. After giving my Entry I fix Stop loss and Profit booking points also, If the Market Reach that point, it automatically Execute.
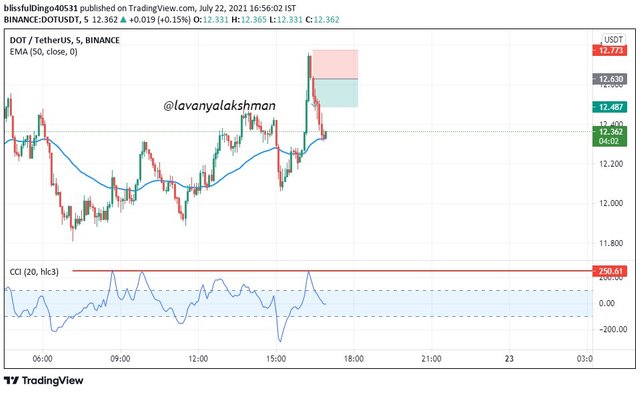
As per My prediction Finally, the Market start dropping from this Resistance level, so it reaches my target point, and I exit my trade with good profits.
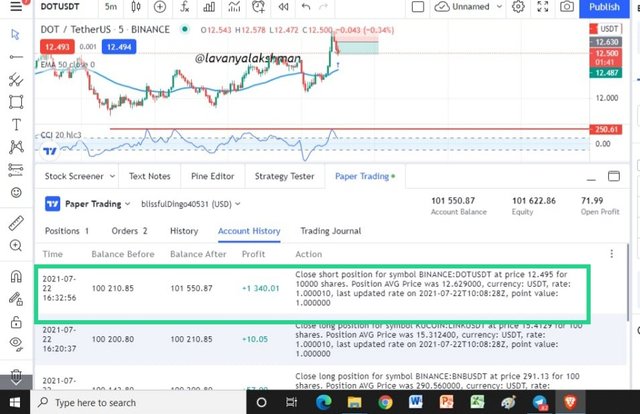
Here is My DOT/USDT trade History. Here I use Paperwallet Demo Account to Demonstrate My Trade.
After giving Entry, Must Need to Place Our Stop Loss, In Crypto, anything will happen at any time, Those Stop Losses protect us from further losses. So always Keep Stop loss for our Trades is Most Important One.
Like That, I successfully Exit My DOT with Good profits. Here on using Trolling Stop losses I can Maximise my profits, but I feel these Earnings is enough in one trade, so I exit Immediately after reaching My Target Price.

LINK/USDT Entry and Exit, Trading Strategy Using Commodity Channel Index
For Applying my Trading Strategy I choose LINK/USDT 5 Minutes chart first in the Trading view platform.
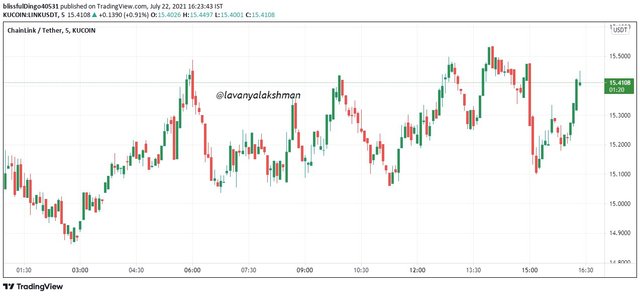
Then apply Exponential Moving Average(EMA: 50 ) and Commodity Channel Index(CCI) on My Chart.
Here I choose EMA for understanding at present, Market Which Direction going. Using this we get some clarity. So I choose that Indicator along with CCI.
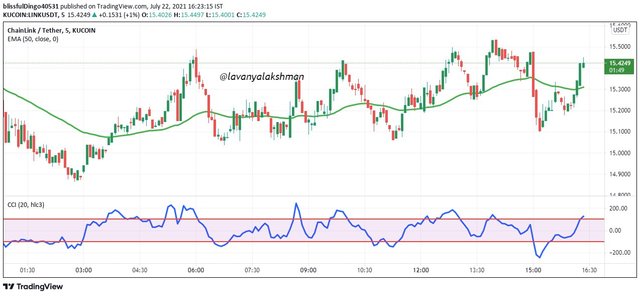
Now I observe CCI only on enlarge big size on my screen. On checking that I watch, now LINK at over Sold position, trying to go the upward direction. I wait Until I get clarification. It crosses Zero lines from the -280 support line, Along with EMA also showing the Upward Direction chart, but at the present position is Normal Pullbacks.
Now I understand LINK trying to go upward direction, so Without delay, I place my buy long position at Present Market Place. It is near to CCI, above zero lines. Here I wait until getting confirmation.
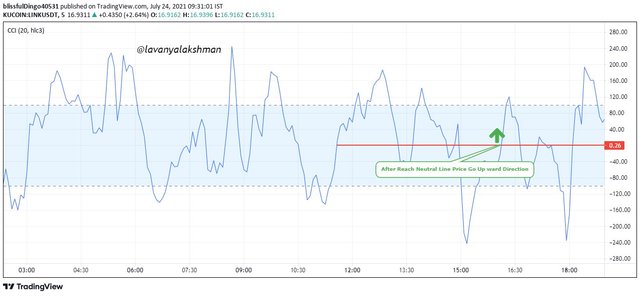
Now here I give my Entry At above zero lines of CCI, I exit at a 1:1 ratio. For any trade, I always set up my Stoploss and Exit Price at a 1:1 Ratio.
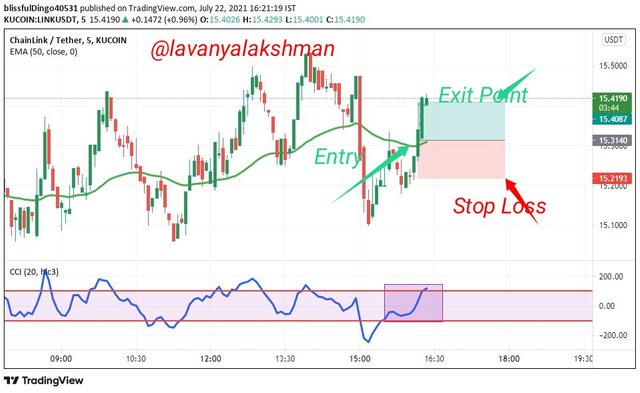
Here I can wait up to reach its highest point in that specific time frame on using Trolling Stop losses. But It reaches My Target points before I removing it, so I exit this Trade at My Target Price. So Not Possible to Change those Positions.
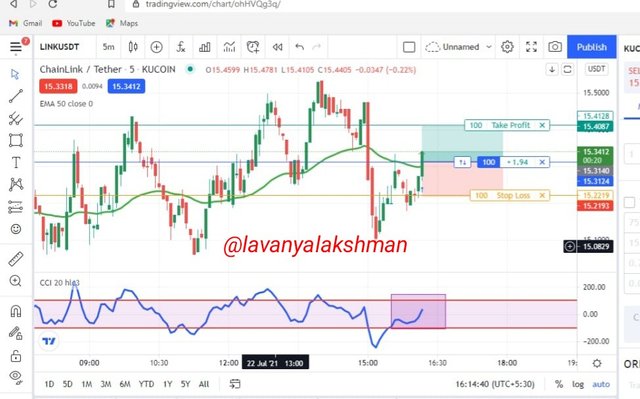
As per My prediction Finally, the Market start going upward direction after reaching its Support Level and Zero Line also.
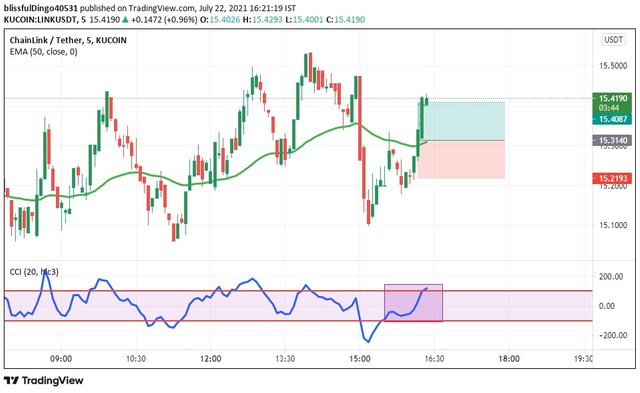
Here is My LINK/USDT trade History. Here I use Paperwallet Demo Account to Demonstrate My Trade.
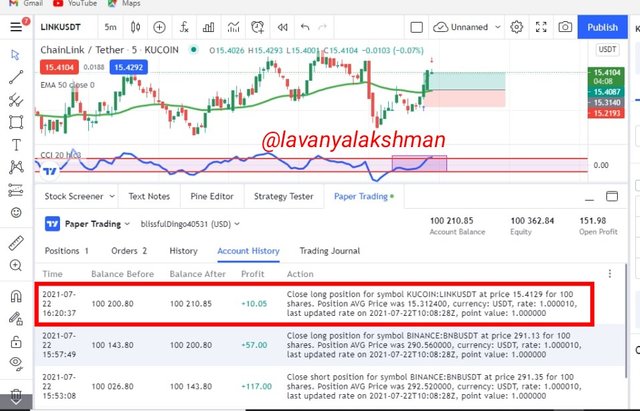
Like that, I successfully exit my LINK/USDT trade. Here also I place my Stop Loss and Exit Points in a 1:1 Ratio. I strictly follow it, because I am a learner, so it is a good strategy for me. So I follow until I get confidence in Trading.

BNB/USDT Entry and Exit, Trading Strategy Using Commodity Channel Index
Here also I choose BNB/USDT 5 Minutes chart first in the Trading view platform.
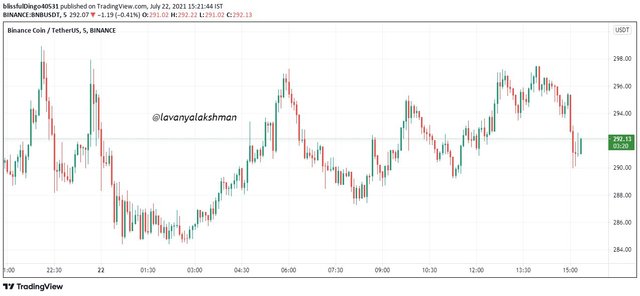
Then apply Exponential Moving Average(EMA: 50 and EMA: 100 ) and Commodity Channel Index(CCI) on My Chart.
Here I choose EMA for understanding at present, Market Which Direction going. Using this we get some clarity. So I choose that Indicator along with CCI.
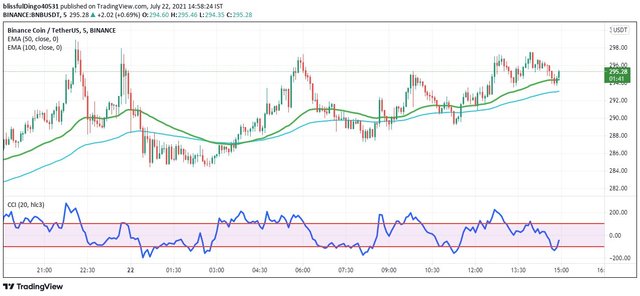
On Checking the CCI chart, After reaching zero lines, It starts dumping, I think this downtrend go up to reach its previous support. So Immediately places my sell short Position below Zero levels of the CCI line.
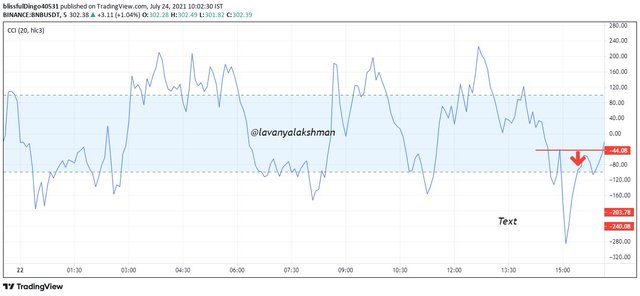
Now here I give my Entry At below zero lines of CCI, I exit at a 1:1 ratio. For any trade, I always set up my Stoploss and Exit Price at a 1:1 Ratio.
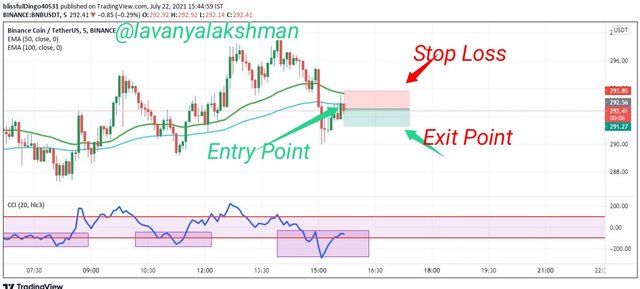
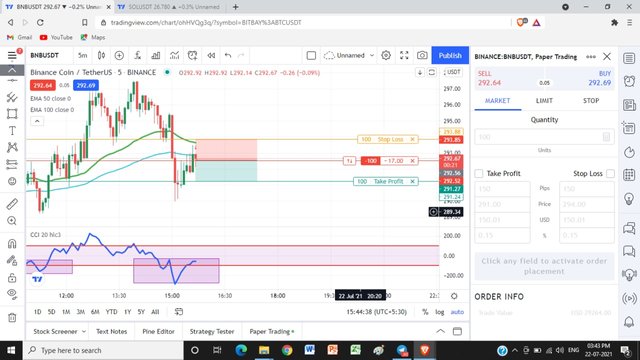
As per My analysis, the Market starts dumping and reach my Target price, so I exit my Trade after reaching my Target Price.
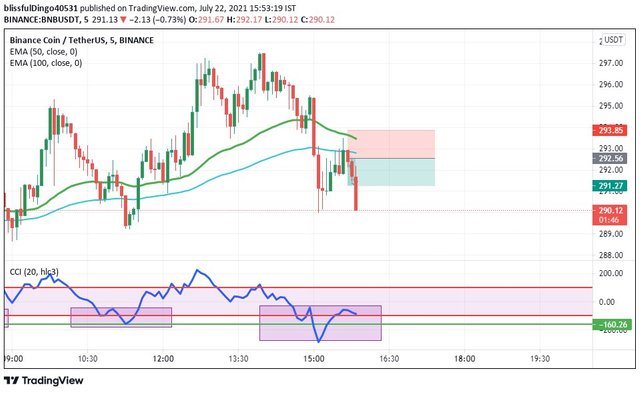
Here is My BNB/USDT trade History. Here I use Paperwallet Demo Account to Demonstrate My Trade.
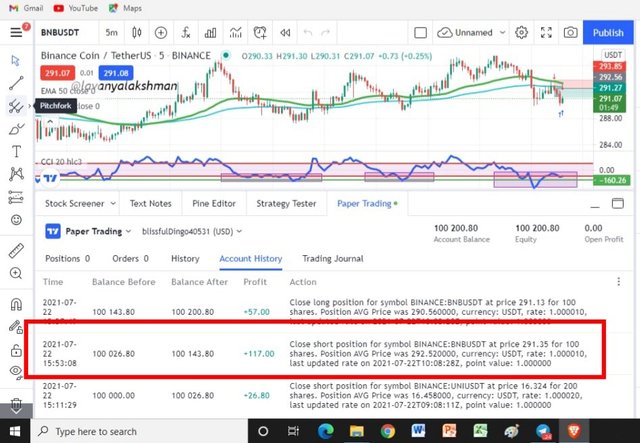
Like that, I successfully exit my BNB/USDT trade with Profit.

UNI/USDT Entry and Exit, Trading Strategy Using Commodity Channel Index
Here also I choose UNI/USDT 5 Minutes chart first in the Trading view platform.
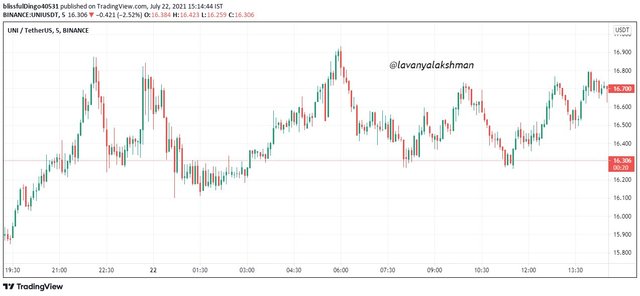
Then apply Exponential Moving Average(EMA: 50 and EMA: 100 ) and Commodity Channel Index(CCI) on My Chart.
Here I choose EMA for understanding at present, Market Which Direction going. Using this we get some clarity. So I choose that Indicator along with CCI.
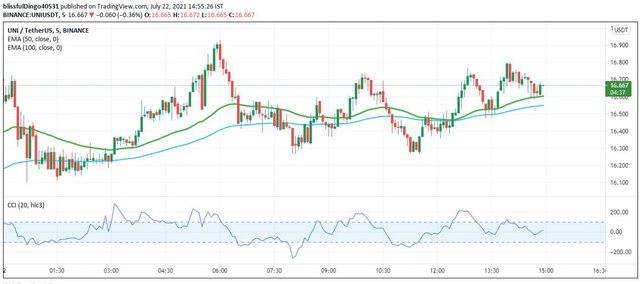
Now Observer CCI indicator, and wait for the exact position for the place my order. As with BNB, the UNI chart also looks like same. Here also it starts dumping after reaching Zero Point. Here I wait Until I get confirmation. After getting confirmation I place My Sell Short Position Below Zero line.
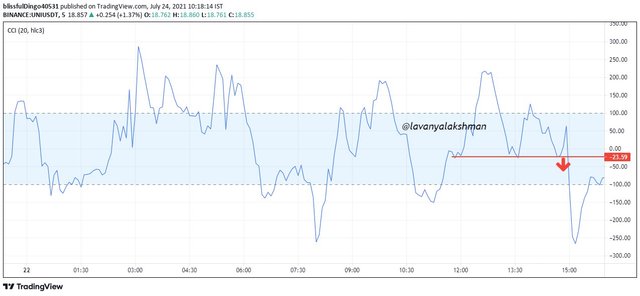
Now here I give my Entry At below zero lines of CCI, I exit at a 1:1 ratio.
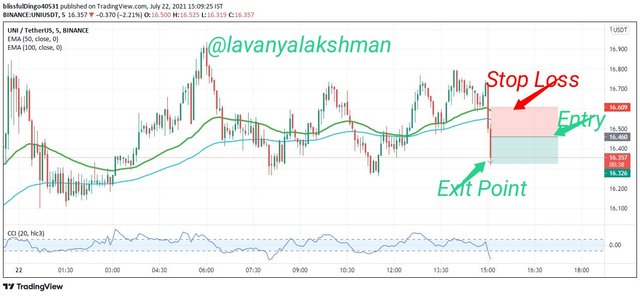
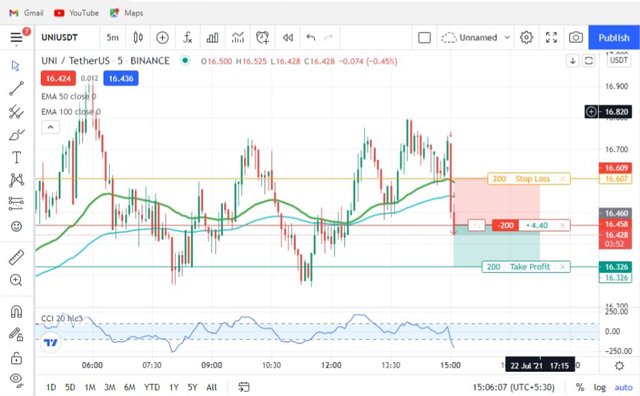
As per My analysis, the Market starts dumping and reach my Target price, so I exit my Trade after reaching my Target Price.

Here is My UNI/USDT trade History. Here I use Paperwallet Demo Account to Demonstrate My Trade.
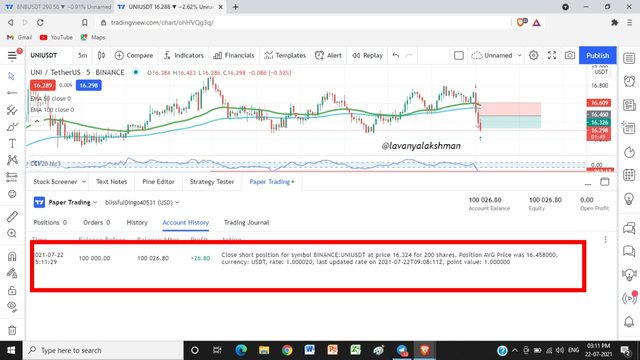
Like that, I successfully exit my UNI/USDT trade with Profit.

SOL/USDT Entry and Exit, Trading Strategy Using Commodity Channel Index
Here also I choose SOL/USDT 5 Minutes chart first in the Trading view platform.
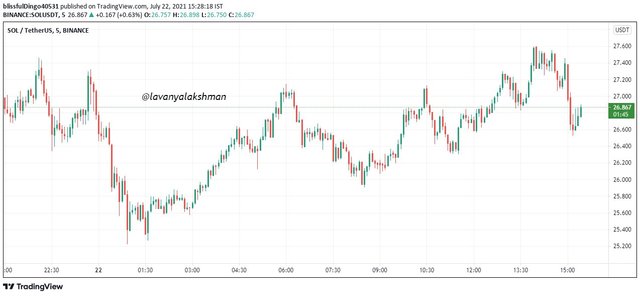
Then apply Exponential Moving Average(EMA: 50 and EMA: 100 ) and Commodity Channel Index(CCI) on My Chart.
Here I choose EMA for understanding at present, Market Which Direction going now.
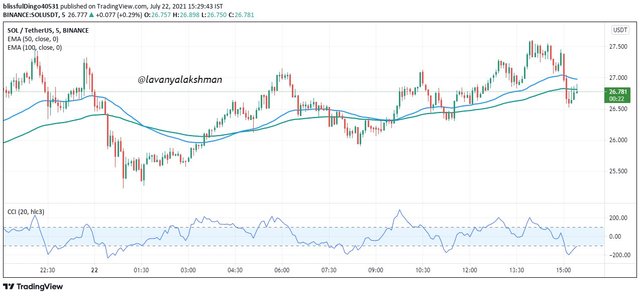
Now Observer CCI indicator, I don't see exact support or resistance levels, so I draw trend lines on the CCI chart. After cross my resistance line, I immediately place my Buy long position. And wait until it reaches its previous high level.
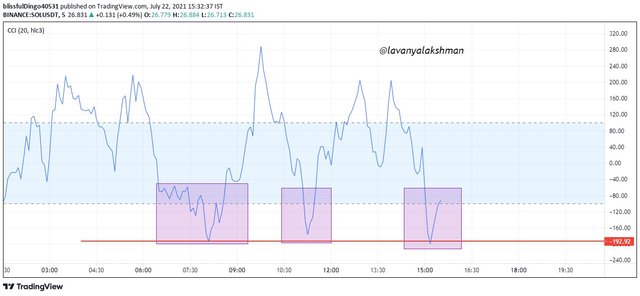
Now here I give my Entry after cross the trend line and Exit at the previous high. Here it is not my 1:1 strategy, based on CCI previous Resistance I exit my trade without outreaching My Target.
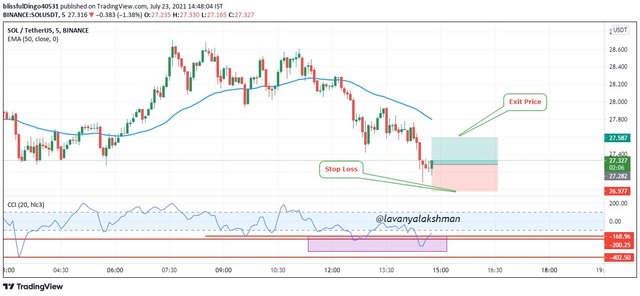
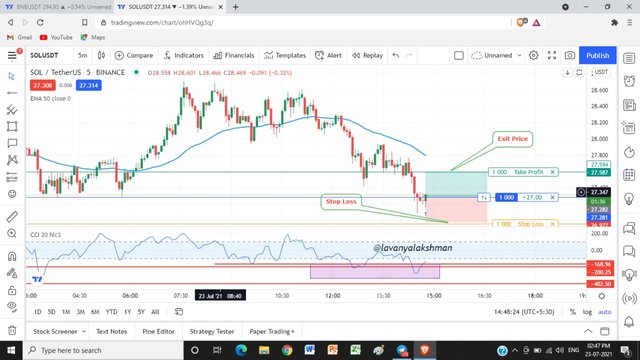
As per My analysis, the Market starts Pumping after cross the Trend line, It goes up to its previous resistance at the 180 to 190 area line, so I exit here, I see some resistance at this point, so I exit my trade before reaching My Target of 1:1 ratio.
Sometimes we need to change our Target price based on Market Conditions.
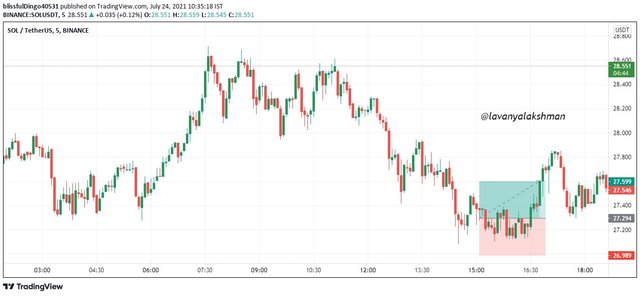
Here is My SOL/USDT trade History. Here I use Paperwallet Demo Account to Demonstrate My Trade.
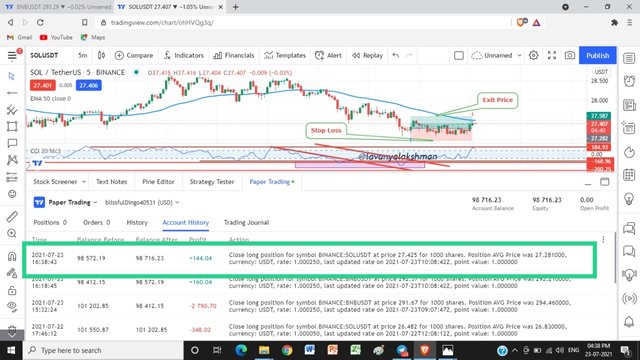
Like that, I successfully exit my SOL/USDT trade with Profit.
Like that, I give my entry and Exit Points based on Commodity Channel Index Indicator.
At finally in every trade, I exit with good profit. Here I get a good experience on trading, now I understand very well how we use Commodity Channel Index Indicator for our trading needs.

Conclusion
Commodity Channel Index is very useful for identifying overbought, oversold potions in a specific Time frame.
Using This Indicator we can trade from Short to long time frames based on our needs.
CCI indicator is not bounded so its ranges may be -400 to +400 or -500 to +500 also. No limit here, It's a drawback in this indicator.
If we see if the CCI indicator may move from - value, + value we can consider it as an uptrend, but wait until get a good position for giving entry.
If we see, if the CCI indicator move from + value to - value then we consider it as Downtrend. So we can place sell shot positions but we wait until getting a good position for giving entry.
Here zero line also treat as a baseline for this Indicator. This means if the CCI indicator moves from 0 to +100 we consider it as an uptrend, If it moves from 0 to -100, we consider it as a downtrend.
On keeping those values we can give our entry, and exit with profit.
But don't use this indicator alone, along with use some other indicators like EMA, BB and many more for getting confirmation.

Hope I finish all Tasks correctly, If any Verify Me.
Thanks For Reading My Post
Good job @lavanyalakshman!
Thanks for performing the above task in the fourth week of Steemit Crypto Academy Season 3. The time and effort put into this work is appreciated. Hence, you have scored 7.5 out of 10. Here are the details:
Remarks:
First and foremost, this was a pleasant read. You wrote according to your understanding, which is what we encourage in the academy. And your work looks original.
I like how you short or long your trade depending on what CCI was signaling. It was unique and astute. Keep it up!
Downvoting a post can decrease pending rewards and make it less visible. Common reasons:
Submit
Thanks for compliment and veriying my post.
Downvoting a post can decrease pending rewards and make it less visible. Common reasons:
Submit