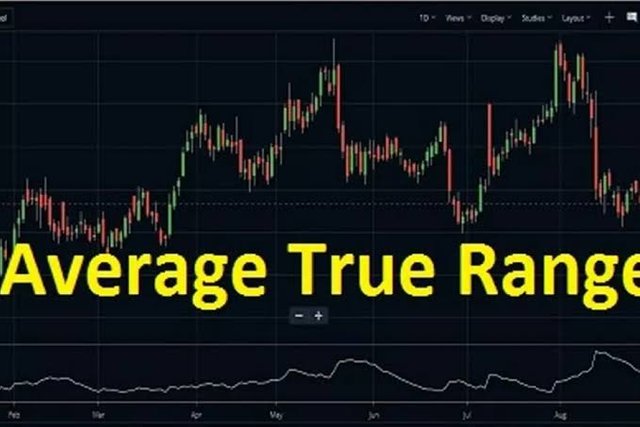
Hi all, In this today lesson from professor @kouba01 give a good explanation about Average True Range (ATR) Indicator setup and how we use it in our tradings for getting good profits.
.jpeg)
Thanks for making it like a wonderful lecture to us.

About ATR Indicator:-
At present, for getting profitable trades we use a lot of indicators which is available to us. Based on those signals we took our Buy/Sell positions.
Most Indicators provide BUY/SELL signal but do not give where we give our Entry and Where we need to exit from it. It's also very important to get Successful Tradings.
This issue we solve using ATR INDICATOR. Because ATR Indicator is an Volatility Indicator. So it shows how much an asset moves, on average, during a given time frame.
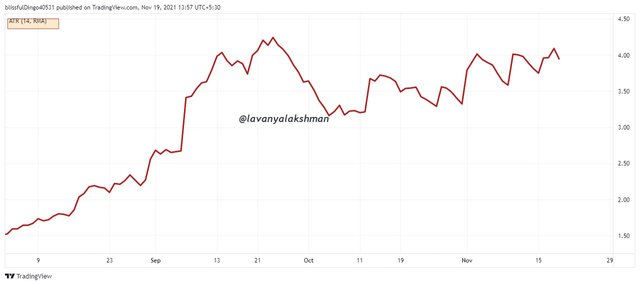
On using this we get when we might want to initiate a trade and where we place our Stop - loss in our trades, like those details we get from ATR Indicator. Simple it helps us to manage our Risk in our trades.
Risk Management is very important for every trader, Without this not possible to get profitable trades. For Managing our Risk, ATR Indicator helps a lot.
In general for applying ATR on our chart use 14 days period by default.
At first, this indicator developed for commodity trading needs but now we using this Indicator in cry trading needs. Because it gives volatility-related signals to us.
Calculation Of ATR Indicator:-
Any indicator work based on Mathematical Formula. So before applying those on our chart must understand, on which based that Indicator giving signals to us is also important to learn.
Because sometimes indicators give false single due to price volatility in the market, so always knowing its Formula which it uses for giving signals to us is also important. Then only possible to get avoid not trapping those false signals which we get from Indicator.
Formula:-
ATR = Average ( True Range, n )
Where:
True Range = Max of ( High - Low ), ( High -PreviousClose ), ( PreviousClose - Low )
Average = Simple, Exponential, Weighted, and Triangular
n = Period
On looking formula still have a lot of confusion. How we calculate True Range here.
Now we discuss it.
Calculation on True Range:-
For calculation of True Range, there are 3 methods.
Method 1: Current High - Current Low
Method 2: Current High - Previous Low(Absolute Values)
Method 3: Current low- Previous Close
If the current period's high is above the previous period's high and the low is below the previous period's low, then the current period's high-low range will be used as the True Range. This is the first method we use for calculating the True Range. Mostly we use this method for calculating True Ranges.
If we get more gaps between closes and highs then we use Method 2 and Method 3 for calculating True Ranges. Those are very rare but sometimes we use them when we get the previous close is greater than the current high, then only we use Method 2 and 3 for calculating True Ranges. This situation we get very rarely.
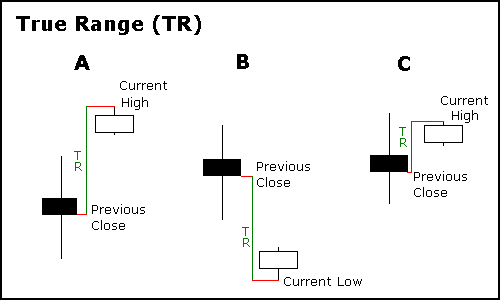
In based on the above Example, now we calculate how TRUE RANGES calculate.
Example A: As per Example A in the above image, here Current high formed after Gap UP of previous low. So here TR would be the difference between absolute values of Current high and Current Low.
Example B: As per Example B, in the above image, here Current high formed after Gap Down of the previous close. So here TR would be the difference between absolute values of Current high and Previous low.
Example C: As per Example C, in the above image, Current High is above the Previous Close but its gap is very smaller. So here TR would be the difference between Curren low and Previous Close.
Like that we calculate True Vales here based on price action.
In general ATR we calculate for 14 days, so here True Values also we calculate for 14 days.
After obtaining all details, just filling the above Math formula we get ATR.
Now
Current ATR = [(Prior ATR x 13) + Current TR] / 14
Multiply the previous 14-day ATR by 13.
Add the most recent day's TR value.
Divide the total by 14
For calculation, here I take some samples of highers, lows and closing price of a coin as per the below-given image, and calculate ATR.
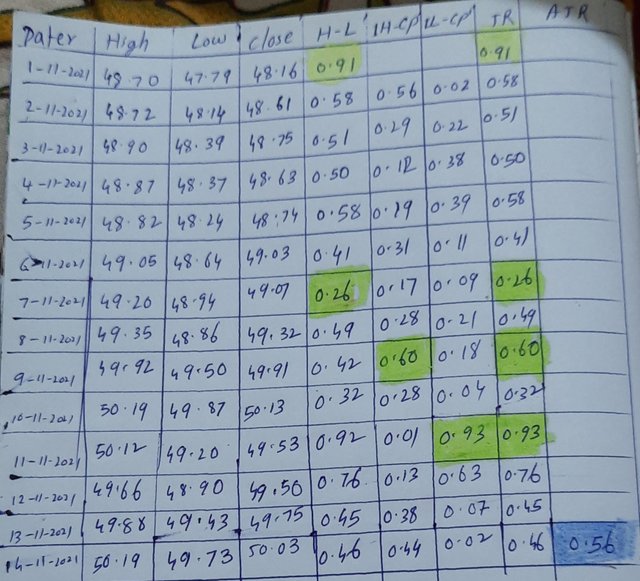
As per the above Example, The first True Range Value is 0.91. Which is equal to the difference between High and low.Which I coloured as yellow colour for identification.
The first 14-day ATR value is 0.56 was calculated by finding the average of the first 14 True Range values. Which I coloured as Blue colour for identification.
Those values I get on submitting values on the ATR formula.
Like that ATR Indicator give signals based on this Formula.

Best settings of the ATR indicator:-
ATR Indicator was invented by Welles Wilder. He always recommends using 14 periods for ATR Indicator. Because for taking 14 days period we get the best signal and also possible to avoid false signal that we get from on setting a lower time frame.
ATR Indicator always follows price action, if we use a shorter time frame then it reacts very early and there is a higher chance to give a false signal.
For the short term, purposes need some traders to use 7 periods and do some quick trades. In this case, ATR looking react very quickly, so not possible to analyze correctly.
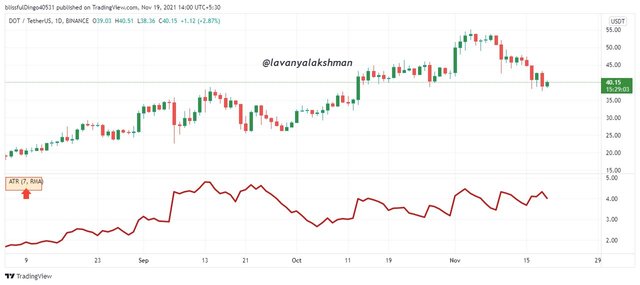
By default, ATR is set to be 14 periods. This is a good choice for mid and long term trading needs. Because here ATR reacts slowly and possibly to give profitable signals. This setting is recommended by ATR Indicator Developer too.
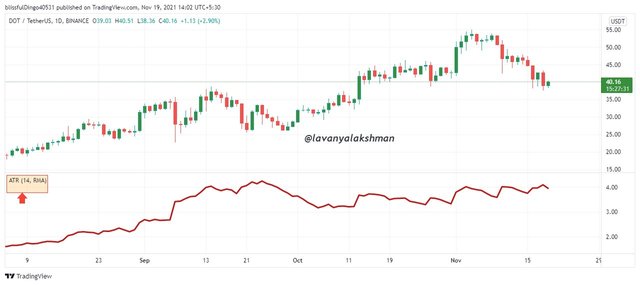
On analyzing the above ATR Indicator Chart we can understand which is the best setting and which gives the best signals for our needs.
I personally always try to use 14 days periods for my trading needs.

How to read the ATR indicator? And is it better to read it alone or with other tools? If so, show the importance.
ATR is a very simple read Indicator, Evry one can read very easily. It contains just a single line chart, no other things.
So we can read ATR Indicator on our chart very easily. We already know the ATR Indicator show volatility in the market based on price action.
So if we have big candles in the Price chart they we get a big volume in ATR also. If we have small candles on the Price Chart, then we see decreasing volume in ATR also.
Those we can see in the below chart also.
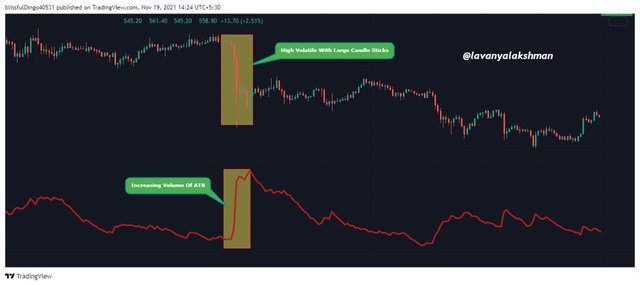
In the above chart, when we get big candles in the price chart, then we see the Increasing Volume of ATR also. Means At present market looking high volatile so taking positions is not a good choice here.
Similarly, if we get smaller candlesticks in the price chart then we get Decreasing Volume in ATR too. This means now the market looks less volatile, so when we get the opportunity then we can take our positions.
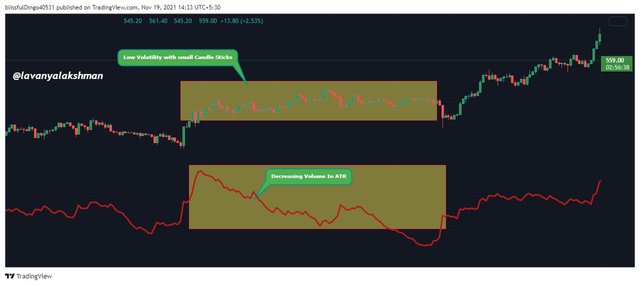
In the above chart, whenever the price moves without having any big candles then ATR also start decreasing. This means the market looking safe to enter because there is no such big volatility in the market in that time frame. So we can give our entry and exit with good profit when we get good opportunity.
Like that we can read ATR Indicator on our chart very easily. On seeing the chart we can understand at the present market is in high volatility or a normal position. Based on those we can give our entries.
Reading ATR Indicator with other Tools
We well know Indicators only give assumptions not give 100% profitable signals always, because indicators give signals based on previous data only. So don't trade blindly based on indicators alone.
If one indicator gives a buy signal, then conforming to those with other indicators is a good choice in my opinion. Because each Indicator work based on different calculation so on applying more than one indicator for our tradings always give the best results.
So here I combine ATR Indicator with Bollinger Band Indicator. Because Bollinger Band is also one type of Volatility Indicator. So on combine using both on our chart we get best results.
We know Bolinger Band has Two men with a Simple Moving Average line. The Upper and lower bands show the volatility in the market, Simple moving average act as a support line.
In ATR I used 14 periods, so same periods I applied for Bollinger Bands also.
If we get a big gap between Lower and Higher with big Candle Sticks then it indicates a high volatility market in the particular Time frame.
Similarly, if we get a low gap between bands with smaller candlesticks then indicate a lower volatility market in that particular time frame.
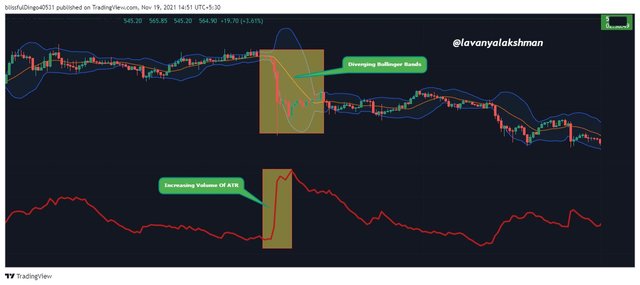
In the above chart, when we get big candles in the price chart then Bollinger bands also move far away from each other and make the big distance between them. Similarly, ATR Volume also starts Increasing.
Means here both indicate the High Volatility Market now we have. So taking positions is not a good choice need to wait some more time for getting the best entry.
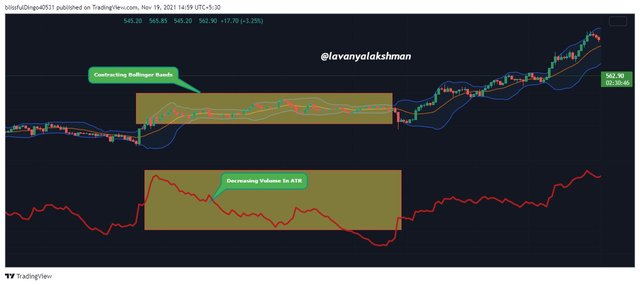
In the above chart, when we get smaller candlesticks then Bollinger Bands also start moving towards each other, similarly, the Volume Of ATR also start decreasing.
Means Bollinger Band and ATR indicates now we have a less volatile market in that particular time frame, so we can give our entry when we get a good opportunity.
Like that on combining two indicators, after getting confirmation we need to do our trades. Then only possible to get profitable trades. So always try to apply more than one indicator for your trading needs.

How to know the price volatility and how one can determine the dominant price force using the ATR indicator.
Determining Price Volatility
We already discussed the ATR act according to price action. If we get big candles in the price chart the ATR volume also increased and it indicates high volatility market if we get smaller candles then ATR Volume decrease and it indicates a lower volatility market.
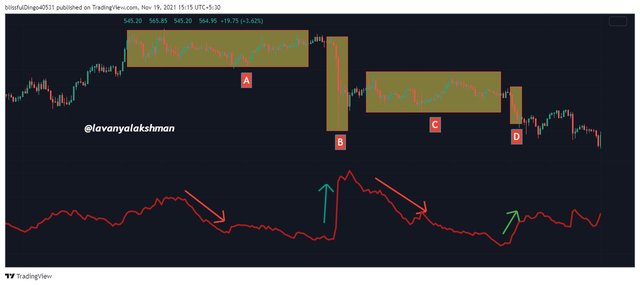
In the above chart BNB/USDT, In Box A and C, we have a smaller candle so ATR also starts moving downside and Volume start decreasing. So the market also looking less volatile, which means in this stage we can do quick profitable trades very easily.
Coming to Box B and D we got big candles in that time frame, so ATR also start moving upward direction and Its Volume also started increasing. Here it Indicates the Market looks High volatile so it is not a good time to do trading. Need to wait until the market gets cool down.
So here ATR acts according to price Action. Based on this we can determine price volatility very easily on seeing ATR Chart.
Determining Dominant Force on the Price
We know according to price action ATR Move, it shows the volatility in the market. Along with it also determine Dominant Force on the Price.
Sometimes ATR does not move according to Price Action, It moves opposite also. Based on this we can determine Dominance Force in the present trend.
Means simple it shows the strength of a present trend, it continues or goes the opposite way soon, like those indications we also get from ATR.
If we know these details then doing trading becomes very easy.
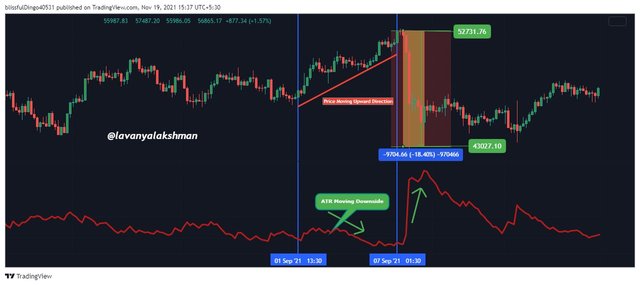
In the above chart, BTC/USDT, on observing price action with ATR. I one place ATR does not react according to price upward direction and also start moving Downside.
In general, ATR must move with Price Action but here it does not respond, due to this we see a big dump in price action.
So here ATR indicates, this price move did not go a long time, soon it took correction. So here it indirectly indicates the soon bearish trend start, no bullish trend continues longer time.
As per ATR indication BTC price fall 18% from $52731 to $43027 within a short time frame.
Here we can also eliminate falling into the trap.
Like that on using ATR, we can also determine Dominance Force very easily.

How to use the ATR indicator to manage trading risk
Crypto Trading involved high volatile so trading involved huge risks.
In this market without having proper risk management then there is a high chance to lose your hard-earned money here very easily within a short time frame.
So for getting profitable trade always manage your risk and reward properly, then we get profitable trades always. So before taking our positions we also determine where we book profit, where we place a stop loss. Then only we can handle bad or good conditions in the market.
By using ATR Indicator we can manage our Risk and Reward very easily. Like that feature is very rarely we see in very few Indicators.
Stoploss Strategy Using ATR Indicator:-
Stoploss avoid further loss in bad market conditions. There is no guarantee to success our positions always, some times it may go opposite direction too.
In those Situations Stoploss helps us to further more losses. If you don't place Stoploss for our position there is a high chance of liquidating our position completely.
So we must place stoploss always for our positions. At the same time, Stoploss is not too tight or too wider from our position. If we place too tight, then there is a chance to hit immediately.
In the same way, if you place stop loss wider from our position, there is a high chance to lose more funds. So it should be in the proper place. Then only possible to Manage our position correctly.
For finding Proper Stoploss placing position ATR helps a lot. For this just use the below formula for placing Stoploss. Then it gives the best results.
Stoploss = Entry Price +/- ATR value
In general most of the Traders use a 1:1 Risk and Reward Ratio for our trades. This is also a good choice, but here we minimizing our easy profits.
So on using ATR Formula for placing Stoploss and Take Profit orders, there is a chance to maximize our profit along with minimizing loss too.
For Example, I want to Take Buy Long Position in BTC/USDT for $58139.91. ATR would be 1255.34
Now here my
Stoploss = 58139.91- (3 × 1255.34)
             = 58139.91 - 3,766.02.

             = 54,373.89
So here my Stoploss would be $54,373.89 for this Buy long Position.
TakeProfit Strategy Using ATR Indicator:-
Placing Takeprofit positions on our positions is also very important. Sometimes after reaching a certain place, the market starts going in the opposite direction.
In this situation, we miss to book our profit and tend to exit from trade with loss sometimes.
In the crypto market greediness also ruined our portfolio, so always trying to book profit is also a good Risk Management Strategy.
In certain places, we must exit from our trade on booking profit.
In general most of the Traders use a 1:1 Risk and Reward Ratio for our trades. This is also a good choice, but here we minimizing our easy profits.
So on using ATR Formula for placing Stoploss and Take Profit orders, there is a chance to maximize our profit along with minimizing loss too.
For Example, I want to Take Buy Long Position in BTC/USDT for $58139.91. ATR would be 1255.34
Now here my
Take profit = 58139.91 + (3 × 1255.34)
= 61,905.93
So here my Take profit position is $61,905.93 for this Buy Long Position.
The same strategy we can apply for Sell Shot Positions also on applying ATR for our needs.
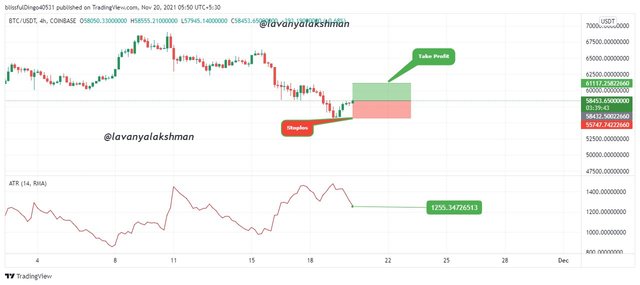
Here I apply a 1:1, Risk and Reward Ratio Strategy For my Buy long Position. Here is a chance to minimize my easy earnings by applying a 1:1 strategy in good market conditions.
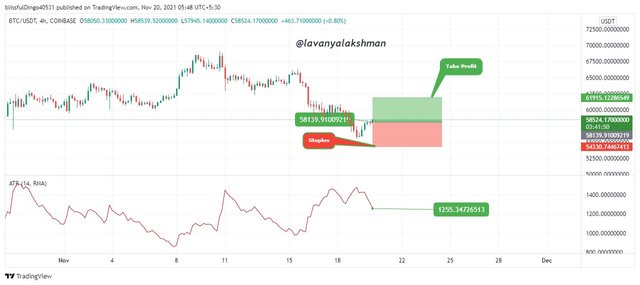
Here I place my My Stoploss/Take Profit Positions based on ATR Risk Management Formula.
So here I maximizing my profits and also Minimizing My Risk too.
Like this best feature, we get from ATR Indicator.

How does this indicator allow us to highlight the strength of a trend and identify any signs of change in the trend itself.
ATR Indicator shows the volatility in the market based on price action. So on using ATR we can't find present Tred but we can determine Strength of Present Trend. This means the Present trend is strong or weak. Based on this we can do profitable Trades.
If it shows a Strong Trend, then we can place buy long positions when we get the opportunity, If it is in Week Trend then we place sell short positions when we get the opportunity in Ranging Market.
In Ranging Market, the Market always tries to Bounce from its Support and Resistance levels and try to make new highs. Those we identify based on ATR Volume very easily.
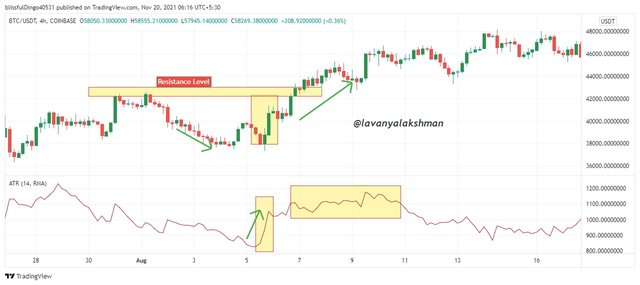
In the above chart, After breaking the Strong Resistance, the market starts moving upward direction. Along with ATR Volume also increase, not get any drop in ATR Volume.
So it shows Present Trend Strength clearly to us. Here we have Bullish Trend it may go some more time and possible to make new highs. Like that Indication, we getting from ATR.
If you know this information then trading becomes very easy for us.
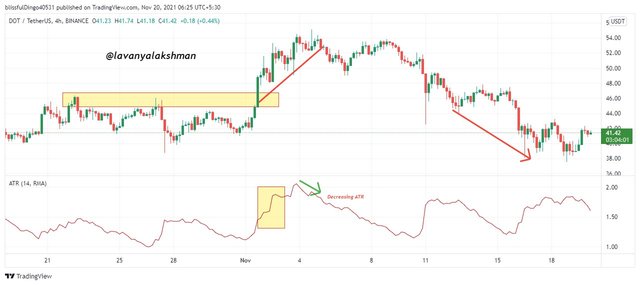
In the above Example, After breaking the Resistance Market start moving Upward Direction, ATR also first respond according to it. But suddenly ATR starts moving Downside but the Market Still Moving Upward Direction. After some time, Market Again start moving Downside.
Here ATR indicates, This is a false Breakout market no more go in Bullish Directions soon it starts moving Bearish side.
So here placing BUY LONG is not a good choice, we need to wait until getting confirmation from ATR. So every Breakout is not valid, there is a lot of False Breakouts in the Market. So don't fall those traps, always wait and observe, then give entry.
Trend Reversal Sign From ATR
We know ATR Indicator determine strength in the present trend. So here also get Trend reversal sign from ATR. Means On using ATR we can determine Trend Reversals Very easily.
In Downtrend Market, If ATR starts Moving Upwards Direction, then we can expect soon Market may not go in the Downtrend, soon it start moving Upward Direction. So here we get Downtrend Reversal Signal From ATR.
In the same way in Uptrend Market, If we see a Sudden Fall in ATR volume, then we can consider as soon Bearish Trend start, no long run we get Bullish Trend in the market. So here we get Uptrend Reversal Signal From ATR.
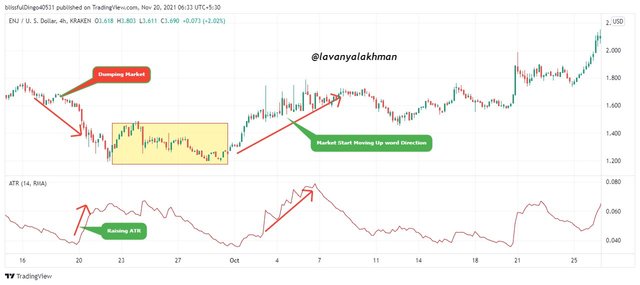
In the above example, the Market is in a downtrend but ATR started moving Upward direction and Its Volume also started Increasing. So here ATR determining soon this Downtrend get the end, Uptrend will start.
As per its signal after some time market starts moving Upward direction.
Before Market starts moving, we get Downtrend Reserval Signal from ATR. When we get confirmation, then we can place our BUY LONGs then exit with quick profits.
Like that we get Trend Reversal Signals from ATR. Based on those signals we can do profitable trades very easily.

Advantages and Disadvantages of ATR Indicator
Any Indicator has some advantages along with disadvantages too. We must consider before applying those to our needs. Then only possible to take the correct decision at the correct time.
Advantages:-
Applying ATR on our chart is very simple. And we can read this Indicator very easily. We don't get any confusion on reading ATR Indicator. Because it has only one single line chart, So everyone can understand and read very easily.
In the market, we have a lot of Volatility Indicators like Bolinger Bands and many more. Those are not so easy to understand and read. Because they come with multiple lines, so understanding for new uses they face a lot of issues. But coming to ATR, it is very simple to look at and easy to understand. So based on ATR Indicated, Traders can possible take their decisions very faster.
On using ATR we can Identify the Strength of Present Trend and Trend Reversals very easily.
One more amazing feature from ATR is Risk Management. By using ATR Indicator we can manage our Risk and Reward Ratio very easily. This is the best and my favourite feature in ATR.
We can use ATR in any time frame as per our trading style. But using default 14 periods give the best results to us.
With help of ATR we can determine False Breakouts in the Market very easily.
Disadvantages:-
ATR Indicator does not give direct BUY/SELL signals, only determining volatility and strength in the market. So by using ATR Indicator, traders not possible take their positions.
ATR Indicator determine strength in the market but does not give details about how long that trend continues or get trend reversal like those signals.
If traders use a shorter time frame, then ATR respond faster and give false signals. So if traders place their order based on those, then there is a high chance of loss of position. So always need to use longer period. So it's not suitable for short term trading needs.
Like the Advantages and Disadvantages, we have in ATR Indicator. So on considering all those we need to do tradings.

Conclusion:-
Indicators help us for getting, profitable Trades and make our tradings easy. Like that ATR Indicator also helps us Identifying Strengths and Volatility In the market.
Along with It helps us to manage our Risk and Reward Ration. Because based on ATR we can place our Take profit and Stop loss positions very easily.
For best results, we must apply more than one indicator on our chart. After getting confirmation then go for it.
Thank you professor @kouba01 for this amazing lesson.

Thanks For Reading My Post
Hello @lavanyalakshman,
Thank you for participating in the 1st Week Crypto Course in its 5th season and for your efforts to complete the suggested tasks, you deserve a Total|9.25/10 rating, according to the following scale:
My review :
Excellent content in which you were able to answer all the questions related to the ATR Indicator with a clear methodology and depth of analysis which is a testament to the outstanding research work you have done.
An excellent explanation of the ATR indicator with a good example of how to calculate its value based on the chart.
It would have been possible to go in more depth to explain the difference between an increase or decrease in the value of a period and to have clearly stated your personal choice.
Your answer to the third question was convicing and clear.
You did well to answer the rest of questions, both in theory and in practice.
Thanks again for your effort, and we look forward to reading your next work.
Sincerely,@kouba01
Downvoting a post can decrease pending rewards and make it less visible. Common reasons:
Submit
Thanks for verify my entry.
Downvoting a post can decrease pending rewards and make it less visible. Common reasons:
Submit