I am so happy learning the Price chart through the @stream4u lecture. Now I trying my best to understanding the coin movements based on the price chart.

Question Number 1:-
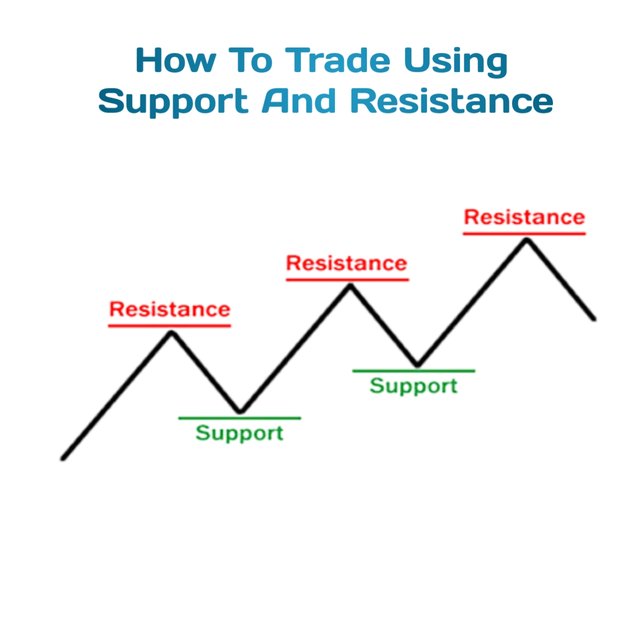
What Is The Meaning Of Support Can Become Resistance & Resistance Become Support, When and Where set Buy trade, Chart Example?
In my opinion for doing profitable trade, we must find that particular coin support and Resistance level. If we know perfectly then possible to get profitable trade in each time.
But for this, we need patients and perfect analysis too.
Rach coin always gets dump and pump in each time frame. For Day trades on seeing a chart, they can find that coin resistance and support level based on that they give entry than exit with profit in a short period.
Support means coin base price means our buying price.
Resistance means here we need to close our trade. This means it's its highest price as per our analysis.
In general, we need to give our entry in Support price, need to Exit at Resistance level. But in Bull Market this analysis not work. Because that coin price moving upward direction so, in this situation that coin resistance level turn to the new support level. Like that we need to change our buying and selling bids based on market conditions.
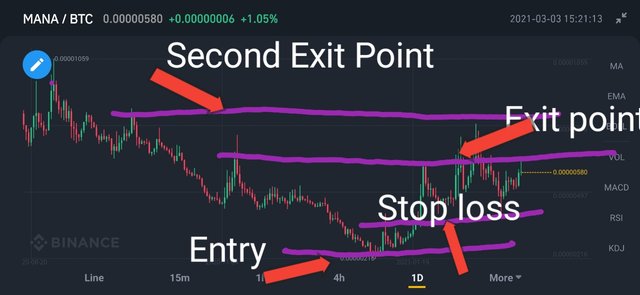
For Example, here I taking Mana/ BTC one day chart.
Here I giving my entry and exit points as per the chart.
For long term traders then can wait up to reach the second exit price otherwise they can exit the first resistance level also as per need.

Support and Resistance Example
Question Number 2:-
What Is A Technical Indicators
As new uses, we getting confusion about understanding the chart. For perfect trade, we must know that coin support and resistance levels, then only possible to get good profits otherwise we lose our money.
If you don't know it's resistance and support level then also we can do profitable trade with help of Technical Indicators.
These are Tools based on the previous chart then indicate the correct direction to us.
All most all exchanges offering those Tools for free. So no need to pay the additional cost for this.
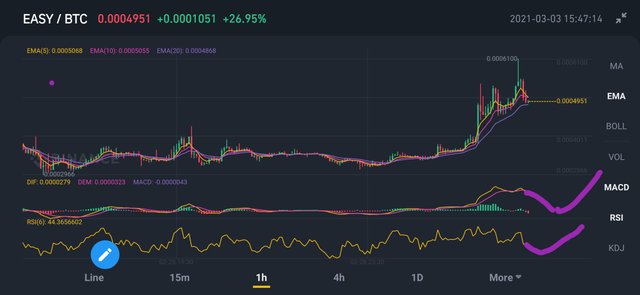
Each Tool gives each direction, But I use MACD, EMA and RSI for every trade. Some times those also not give correct direction because of sudden Market change.
For Example, here I taking the Easy/ BTC 1hour chart.
On applying those Tools I think now is going to a downtrend then again go the upward direction.

Technical Indicators
Question Number 3:-
Provide your view and explore TradingView.
Yes, I agreeTrading view platform is most useful for understanding chart very easily. Also providing a lot of useful tools at free access too.
But I don't use it now, In Mobile, it is very difficult to access there, so Very rarely I use that platform.
Mostly I use Exchanges for understanding the price chart for my needed coins.
Question Number 4:-
What is the 200 Moving Average, how and when we can trade/invest with the help of the 200 Moving Average? Show different price reactions towards 200 Moving Average.
Long term, holders use these Indicators, but one day traders don't use this I think.
But using this we can analyse the coin price perfectly.
200 Moving Averages means how that coin perform the last 200 days. In the last 200 days how much pumps and dumps it get you can check using this Tool.
If that coin price above the 200 moving average line means that coin in an uptrend direction. This means we can give our entry there.
If that coin price down to 200 moving average lines then it's downtrend started. So we need to close our trade.
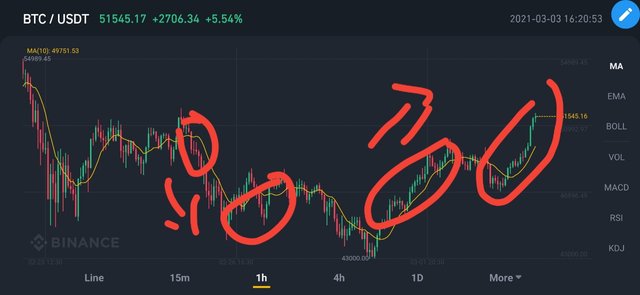
For Example here, I taking BTC/USDT chart for 1 hour and take Moving Average for the last 200 days.

200 Moving Averages
On checking this chart I understand BTC is in an Upward direction so we can invest our money at the present market price for long term hold. In long term, it may give a good profit.
Hope I finish all my Homework Tasks Successfully.
Thanks for reading My post.
Hi @lavanyalakshman
Thank you for joining Steemit Crypto Academy and participated in the Homework Task 4.
Your Homework task 4 verification has been done by @Stream4u.
Thank You.
@stream4u
Crypto Professors : Steemit Crypto Academy
Downvoting a post can decrease pending rewards and make it less visible. Common reasons:
Submit
Thank you.
Downvoting a post can decrease pending rewards and make it less visible. Common reasons:
Submit