
Discuss your understanding of Kumo, as well as its two lines.
The Ichimoku Kumo is a collection of Indicator. Using this we can identify Support and Resistance Levels and Momentum of present Trend.
Like those details, we identify on studying Kumo on the chart.
Another keep indication also we get here on studying kumo. If you see Price below the kumo means Bearish Trend.
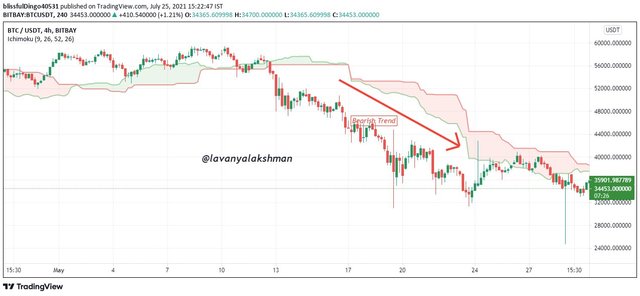
If you see prices Above the Kumo Means Bullish trend.
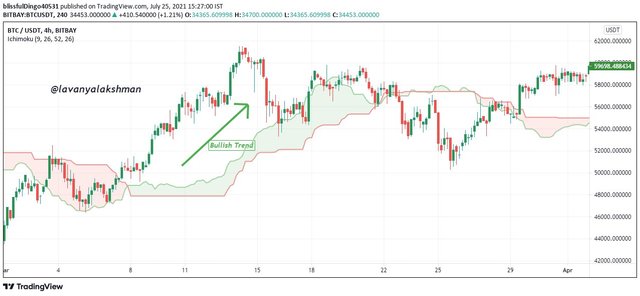
Like those key Indication, we get on studying kumo on the chart in a specific Time frame. After finding the trend, then we can enter at the support level and exit with resistance, Like the Trades we can do on studying KUMO.
This kumo occur using Senkou Span A(SSA) and Senkou Span B(SSB). These Two lines were calculated using this Formula.
Senkou Span A =( Tenkan sen + Base Line)/2.
Senkou Span B = ((52-Period High)+(52-Period Low))/2
So those lines form based on this calculation, we get accurate parent trend related details using the Ichimoku indicator.

What Does the Ichimoku Kumo Tell You?
On studying Kumo we can identify market going Uptred or Downtrend or in sideways.
If Prices above cloud means, Bullish Trend, If the price bellow kumo means Bearish Trend, If Prices inner the Kumo means No trend, Market not having any trend, going in that area in Specific Time Trame. Like that information, we get on Studying Kumo on our Chart.
Along with we can also Identify Trends using Senkou Span A(SSA) and Senkou Span B lines.
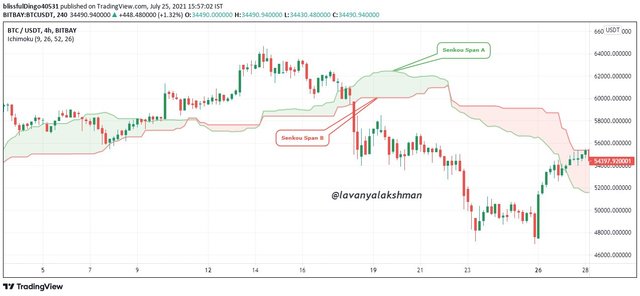
If Senkou Span A(SSA) line above Senkou Span B line, it is Uptrend. In this stage space between lines, we see in Green colour KUMO.
Vice verse if Senkou Span A(SSA) below Senkou Span B, then it is Downtrend. The space between two lines is generally In Red Colour KUMO.
Traders also identify Support and Resistance Levels on using KUMO boundaries in a trending market in a specific Time frame.
Like those Indications, we Get on studying KUMO on the chart.
Senkou Span A(SSA) and Senkou Span B(SSB):-
Senkou Span A(SSA) And Senkou Span B are the components of the Ichimoku indicator.
Space between Two lines we known as KUMO. These Two lines act as Support and Resistance or Resistance and Support in Trending Market.
Here Senkou Span A only use historical data that's why this line we considered a leading or predictive line.
On using Senkou Span A(SSA) and Senkou Span B(SSB) we identify present Trend In the market. Along with those lines act as Support and Resistance levels also.

What is the relationship between this cloud and the price movement? And how do you determine resistance and support levels using Kumo?
In general, for knowing Support and Resistance levels we use Horizontal Lines or Trend lines, But in huge volatile markets for identifying support and resistance levels using lines is not possible.
In this situation on using Ichimoku Kumo, we can identify Support and Resistance levels very easily in Trending and volatile Market.
If you see large price movements in the market then we get Thicker clouds. This means It acts as Strong Support or Strong Resistance levels, cloud heights represents price volatility.
If we get Thinner Clouds it represents less volatility in the market, at the same time those Support and Resistance levels are in Week. So at any time, We can see Trend Reversal. Because Cloud Support and Resistance are weeks, so easily they can break. Then market goes in the opposite direction.
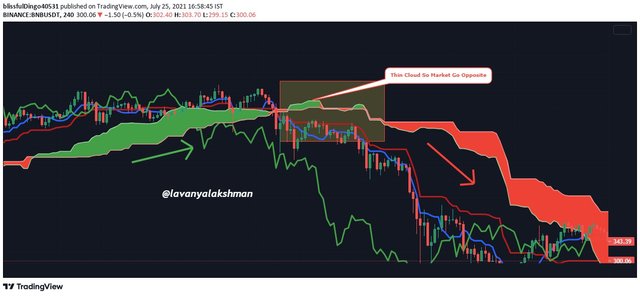
In the above example, I took BNB/USDT 4HOURS chart, Here the market is in an upward direction getting a lot of oil backs and making Thick and Thin Clouds.
But when Thin Cloud form, then after Kumo not possible to hold its Trend, Because that support level is week, so it's not possible to hold Trend, that's why Market goes opposite Direction Then after.
Here Kumo or Cloud occurs based on Price Action, on seeing it's Thick or Thinness of Cloud, we can identify Trend reversals Very Easily.
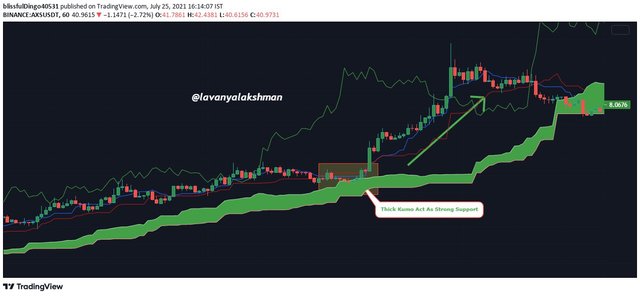
For Example, In Above Chart I took AXS/USDT 1 hour chart.
On studying the chart, I observe that at one point market start dumping, but due to the strong support of Kumo, it again goes its original Trend.
Means here understand that Market going Upward direction so we also ways wait for a good opportunity for placing Buy Long Positions Than Sell Shot because Market is in Uptrend for some specific Time Trame.
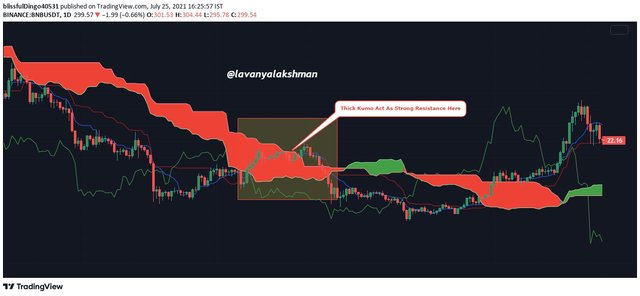
For Example, if we see that situation on the chart. It showing a Strong Downtrend.
Here I took BNB/USDT 1 DAY chart, On studying the chart I find in one place market start pumping, but due to Strong Resistance, it again starts to go its original Down Trend.
Means here Due to Strong Thick Kumo Resistance, Market not possible to go the opposite way, again it starts to go its original Downtrend.
So in this situation, Traders clearly understood Market is in a Downtrend. So now we need to wait for a good opportunity for placing Sell Shot Positions than Buy Long because the Market is in a Downtrend.

How and why is the twist formed? And once we've "seen" the twist, how do we use it in our trading?
Kumo Twist forms when a trend gets Reversal in the Ranging Market. Whether it is an Upward or Downward trend we can identify using Kumo Trend before Trend gets a reversal. So based on this we can do profitable trades.
But very less people know about it. A lot of people always check Kumo width and decide it is Upward Market or Downward Market. Don't look on Kumo Twist.
But on using Kumo Twist Indication we can identify Trend Reversal Before it Occurs.
The Kumo Twist signal is given when the senkou span A line crosses over the senkou span B line of the kumo. Here we get Two scenarios on changing Trends. One is Uptrend, another one is Downtrend.
If the senkou span A crosses the senkou span B from the bottom up, then it is a bullish signal that means Uptrend.
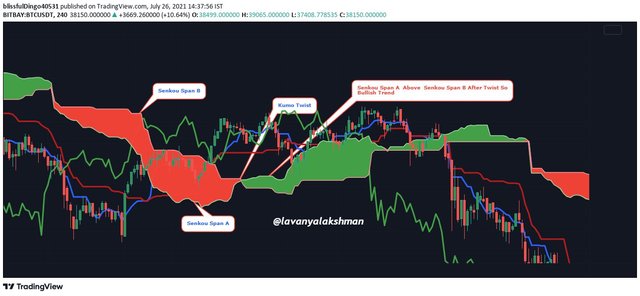
Once we get this Signal from Kumo Twist, Then we need to close all our Sell Shot Positions as soon as possible, Then wait for a good Opportunity For placing Buy long Positions.
If the senkou span A crosses the senkou span B from the Top, then it is a bearish signal that means Downtrend.
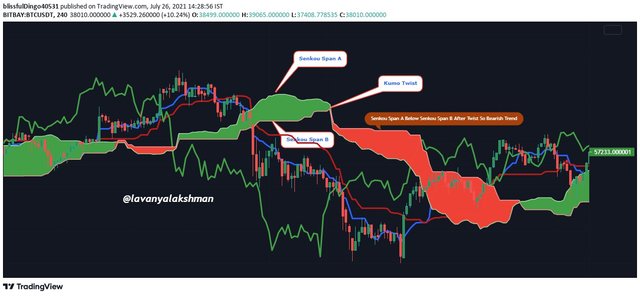
Once we get this Signal from Kumo Twist, Then we need to close all our Buy long Positions as soon as possible, Then wait for a good Opportunity For placing Sell Shot.
Like that on studying Kumo Twist, we can understand then after which trend we get, so based on this we can take our positions. So here before trend start, we can identify upcoming trend using Kumo Twist. Like that most useful Feature, we get from the Ichimoku indicator. All those useful in Trending Market oy, not applicable in Sideways Market.
One more thing we keep in our mind on using the Kumo Twist strategy is our trading. Here 'cross' signal will take place 26 periods ahead of the price action as the kumo is time-shifted 26 periods into the future. So all are indications only, not confirmation. So we need confirmation on using other Indicators like RSI, EMA, like those.

What is the Ichimoku trend confirmation strategy with the cloud (Kumo)? And what are the signals that detect a trend reversal?
In the Ichimoku indicator, we having another component of Chikou Span and Price momentum. Based on this we can identify trend reversal before Kumo Twist Form.
Kumo Twist just gives Conformation after it, But on using the Chikou Span line we identify trend reversal before Kumo or Kumo Twist Farm.
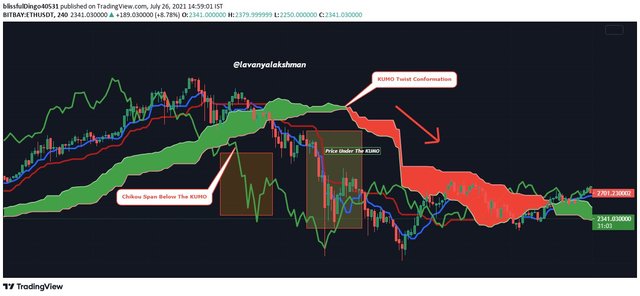
In the above chart, I taking ETH/USDT 4hours Chart.
On checking the chart, we can observe in one place the Chikou Span line fall suddenly below the Kumo, then after slowly Prices also start farming below the cloud. After happening this in some period after we see Downtrend occur in Market. Then after Kumo Twist Shows Bearish Signal to us., Kumo Conformed it later.
Means In Uptrend Market if we see Chikou Span Line sudden fall below Kumo and Price Drop Below Kumo, then we can understand soon Uptrend get Stop, so it's Reversal Trend Bearish Trend will occur. So we need to close our Buy log positions as soon as possible or place Stop losses for our Trades Is good Choice.
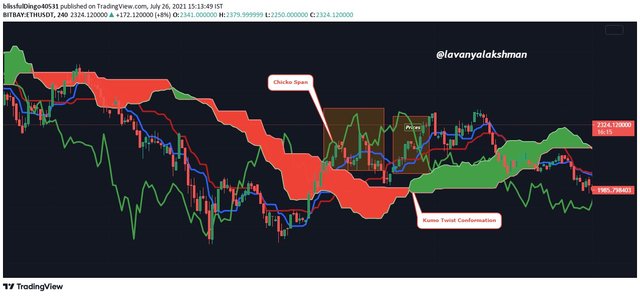
In the above chart, On studying we can see in one place the Chikou Span line suddenly goes above the Kumo, then after slowly Prices also start farming above the cloud. After occurring this in some periods, we see Uptrend Happen in the Market. Then after Kumo Twist Shows Bullish Signal to us., Kumo Conformed it later.
Means In Downtrend Market if we see Chikou Span Line sudden up above the Kumo and Price start moving above the Kumo, then we can understand soon Downtrend get Stop, so it's Reversal Trend Bullish Trend will occur. So we need to close our Sell Shot positions as soon as possible or place Stop losses for our Trades Is good Choice. Now waiting for getting the good opportunity for placing Buy Long Positions.
Like this Trend Reversals, we can identify using the Chikou Span line and using price movements very easily. Those are very useful for identifying Trend Reversals before they occur.

Explain the trading strategy using the cloud and the chikou span together.
By using Kumo Twist, chikou span, and Price Moments we can identify Trend Reversals.
Traders always looking for Trend Reversals, based on this he can place Buy long or Sell Shots. From any direction, Trader can earn if he identifies exact Trend reversal Points.
Those areas we identify using Kumo and Chikou Span lines very easily.
Before going for trading first we select a coin, For this always choose Top 50 is a good choice.
After selecting a coin then check it's a chart on applying the Ichimoku Cloud indicator.
Try to observe the chart from a higher Time Frame To Lower Time Frame.
Now we get understand which direction the Market going. Means Upward or Downward direction. After getting confirmation, now wait for a good opportunity for placing our positions.
For a long time holds onset chart in the long time frame, for the short term needs to check the chart in the lower Time frame.
After deciding our needs, now wait here for getting a Trend reversal signal from the chicken span and Price Moment, then after you can place your positions.
For more confirmation, we can wait until Twist Happens but here we need to take our decision Faster otherwise we lose the opportunity.
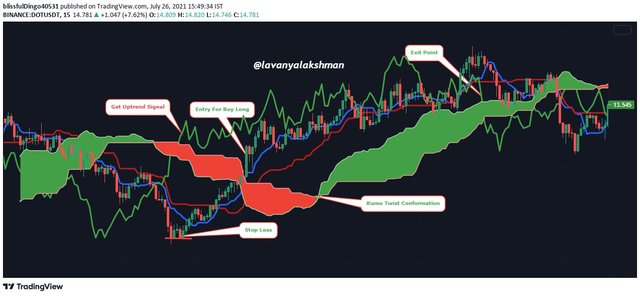
I try to demonstrate Trading Strategy Using Chart.
Here I took DOT/USDT 15 MINUTES CHART and Apply Ichimoku Indicator On My chart.
On checking the chart what I find Market in Trending, means going Ups and Downs in each Specific Time Frame.
So now I get conformation about Market. Now I waiting for the Trend reversal signal from the Chikou Span line.
In one place I get Uptrend Signal from the Chikou Span line, but still, I wait for confirmation from Price Momentum. After getting confirmation I can place my buy long position at that price, here I take my position before getting Confirmation from Kumo Twist.
In any Trade always place your Stop loss, It protects further loss if we took wring Entry.
Here I place my stop loss previous low of Kumo Twist Occur.
My Exit Point would be when Chikou Span starts dropping below the cloud.
Like that we can apply our trading strategy based on Chikou Span and Kumo.

Explain the use of the Ichimoku indicator for the scalping trading strategy.
In any Market condition scalping trading is a good choice for short term needs.
For scalping, we can choose 5,10, or 15 minutes time frame charts is a good choice. And choose Trending Coins always from scalping.
After choosing a coin for scalping, then apply Ichimoku Indicator and Volume Indicator on our chart.
Volume gives more confirmation for the price chart.
Then wait Chikou Span signal for trend reversal then took your position after getting confirmation from Price moment and volume.
If you see the Chikou Span line above the Kumo Cloud in Downtrend Market then we can understand soon Downtrend will get End, Uptrend will start.
After Price moves above the cloud and the other Two lines of Tenken and Kijan also move above the Cloud, Then we can place Buy Long on that Price.
Here Stop loss would be Lower Price of Kumo Twist Farm.
Exit Would be Chikou Span next fall signal, or Tenken and Kijan drop below the cloud signal. Before Dropping below the cloud, we need to Exit From the Trade.
For applying Scalping Strategy we need to follow some important rules for getting profitable Trade.
Choose Trending Coin
Wait until getting a signal from Chikou Span.
Observe Price Momentum
For Buy long positions, Prices are always above Tenken and Kijan. If you see a sudden drop from that line, Immediately close your Buy long Positions.
In Buy long Trade Stop loss must be previous low of Kumo Twist occurred.
For Sell Shot Position prices are always below the Tenken and Kijan lines, If you see a sudden price upward moment above these lines, immediately close your Positions.
In Sell Shot Positions our Stop loss would be the previous high of Kumo Twist occurred.
Along with always Monitor Volume indicator.
On keeping those points in our Mind we can do scalping with help of the Ichimoku indicator very easily.
Here I try to demonstrate Scalping Trading Strategy using Demo Charts.
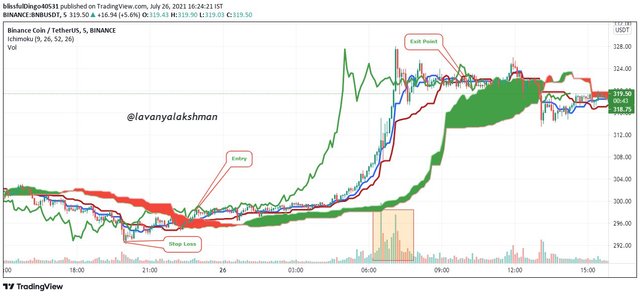
Here we doing Scalping so I choose BNB/USDT 5 MINUTES CHART.
In the above chart, I give my entry when the price moves above Tenken and Kijan lines, after getting Buy long signal from Chikou Span, and check those are must be above the cloud.
And keep my Stop loss at a previous lower point before Kumo occurs. My Exit would be before the price drop below Tenken and Kijan lines.
This is an example of a Buy long Strategy based on the Ichimoku Indicator.
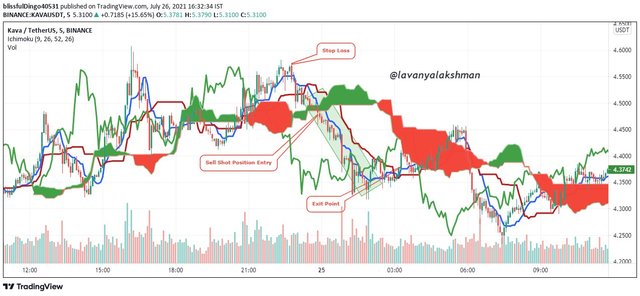
Here I took KAVA/USDT 5 MINUTES CHART, then apply Ichimoku Indicator on my chart.
In the above chart, I give my entry when the price drop below Tenken and Kijan lines, after getting sell shot signal from Chikou Span, and check those must below the cloud.
And keep my Stop loss at a previous higher point before Kumo occurs. My Exit would be before the price move above Tenken and Kijan lines.
This is an example of a sell shot Strategy based on the Ichimoku Indicator.
Like that we do Scalp Trading using Ichimoku Indicator.

Conclusion
Ichimoku Indicator helps us to identify Market Present Trend and Trend reversal areas very easily before it occurs.
If we identify those then we can take our positions accurately and exit with Profit. Because Trend Is Our Friend.
On Studying Kumo Twist, Chikou Span, Price moments we can identify Trend Reversals very easily.
Chikou Span, Price moments are above the Kumo means Bullish Trend, so here Tenken and Kijan lines, act as Strong Support levels. So focus on Buy long Positions.
Chikou Span, Price moments are below the Kumo means Bearish Trend, so here Tenken and Kijan lines, act as Strong Resistance levels. So focus on Sell Shot Positions.
Here we getting assumptions only because all are indicators work on using previous data, So it does not give 100% accurate results. That's why always take those as indication purpose only, Don't trade blindly using Indicators alone. Always Trade based on your strategy but took the help of Indicators.

All Images Are my own,not took any where,all those I prepare Using Trading View but logo image I taken from Social Media so I Include Its Source under Image
Hope I finish all homework Tasks, If any verify me.
Thanks For Reading My Post
You are very sincere and have done a great homework task, I like to do but no time for me.
Downvoting a post can decrease pending rewards and make it less visible. Common reasons:
Submit
Try to manaze your time. Then possible to participate in homework tasks also.
Thanks for stopping my post.
#affable #india
Downvoting a post can decrease pending rewards and make it less visible. Common reasons:
Submit
I try thank you sis
Downvoting a post can decrease pending rewards and make it less visible. Common reasons:
Submit
Best of luck
Downvoting a post can decrease pending rewards and make it less visible. Common reasons:
Submit
best of luck to you too
Downvoting a post can decrease pending rewards and make it less visible. Common reasons:
Submit
Thank you.
Downvoting a post can decrease pending rewards and make it less visible. Common reasons:
Submit
Hello @lavanyalakshman,
Thank you for participating in the 5th Week Crypto Course in its third season and for your efforts to complete the suggested tasks, you deserve an 8.5/10 rating, according to the following scale:
My review :
Good content, through which you were able to cover all aspects of the topic clearly, based on a set of accurate information. However, I have some notes:
You provided a good set of information to explain the Ichimoku cloud and its lines, but it lacks a methodology and an arrangement of ideas.
You had to separate the two elements, the relationship of price movement and the cloud, and how to determine the level of support and resistance, as both represent an element in the second question. It was possible to compare how to determine support and resistance levels traditionally and based on a Kumo cloud.
Your explanation of the rest of the questions was excellent and you delved well into analyzing what was required.
Thanks again for your effort, and we look forward to reading your next work.
Sincerely,@kouba01
Downvoting a post can decrease pending rewards and make it less visible. Common reasons:
Submit
I understand now what mistake I make.
I follow it in further Tasks.
Thanks for verifying my entry.
Downvoting a post can decrease pending rewards and make it less visible. Common reasons:
Submit