Hi all, From this today lecture from @fredquantum I learn new Indicator Aroon Indicator use cases and how to read on the chart.
Image Taken FromTrading View
Thanks for making like an excellent lecture for us.

About Aroon Indicator:-
Aroon Indicator is also one type of Indicator, on applying this we can do easy and profitable trades.
At first Aroon Indicator was developed by Tushar Chande in 1995.
Here Aroon means Dawn's Early Light in Sanskrit. So its name itself gives what this Indicator tell to us.
Aroon Indicator tells us Trend Reveals and Strength in Present Trend men's at the present trend is Strong or weak like those details it was given to us.
Aroon Indicator also Identifies
Beginning of Trend
Identify Ranging Market
Consolidate Period
Strength of Present Trend
Like those details, we can identify on applying Aroon Indicator on our chart.
Aroon Indicator measures the Time between highs and lows over a particular period. Don't follow on present price action. Only it work highs and lows of past data only.
Aroon Indicator contains Two lines, One is Aroon-up which measure the strength of Uptrend, another line is Aroon-Down which measure the strength of Downtrend.
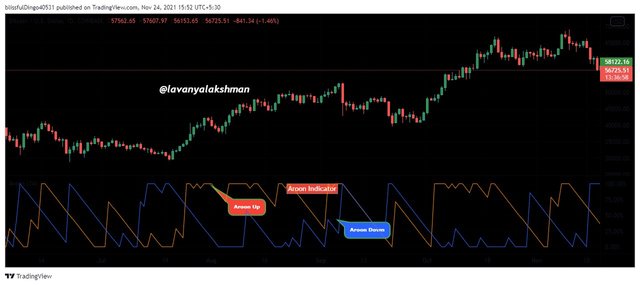
Image Taken FromTrading View
Aroon Indicator by default is set to be 25 periods. This means it measures the highs and lows of the past 25 days, based on this it gives signals to us. But it does not follow present price action, so always be careful on taking your decision based on Aroon Indicator.
Aroon-Up and Aroon-Down:-
Aroon Indicator comes with Two lines. One is Aroon-Up and another one is Aroon-Down.
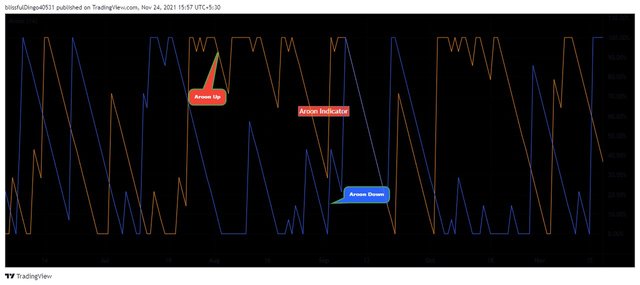
Image Taken FromTrading View
On reading those charts we can identify strength in trend and Trend Reversals also.
Here Aroon-Up only measure the highs of a particular time frame, so it shows the strength of Uptrend.
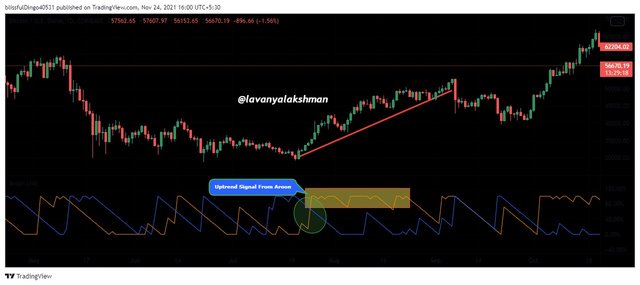
Image Taken FromTrading View
And, here Aroon-Down only measure lows of a particular time frame, so it shows the strength of Downtrend.
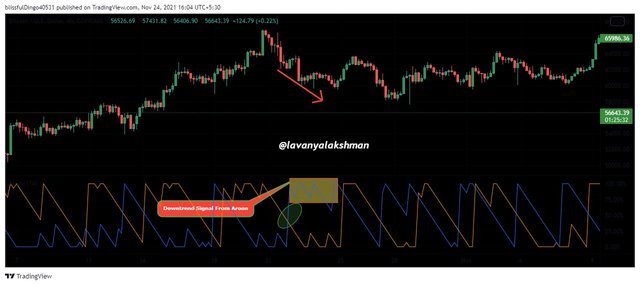
Image Taken FromTrading View
If Aroon-Up moves above the Aroon-Down, then it Indicates Bullish Market. If it moves below the Aroon-Down then it indicates Bearish Market.
If both Aroon-Up and Aroon-Down cross over each other, then Aroon-Up moves Above the Aroon-Down, then.it indicates a new and Strong Uptrend started in the Market. Means Bullish Market.
Similarly, Aroon-Up and Aroon-Down cross over each other, then Aroon-Up move bellow the Aroon-Down, then.it indicates new and week Uptrend started in Market. Means Bearish Trend.
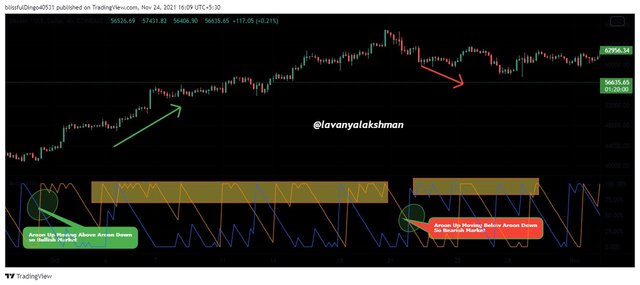
Image Taken FromTrading View
Like that, we can Read Aroon-Up and Aroon-Down on the chart.
One more easy Identification Bullish and Bearish Trend on applying Aroon Indicator is.
If Aroon-Up is above 70 lines and Aroon-Down is Below 30 is considered as Strong Uptrend.
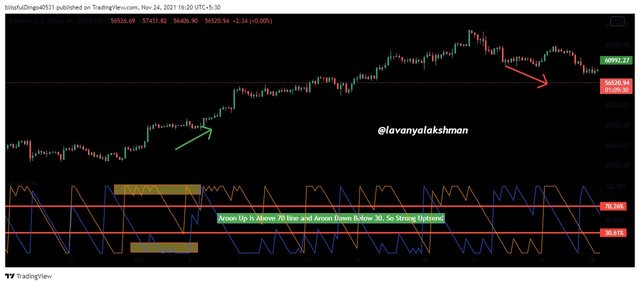
Image Taken FromTrading View
Similarly, If Aroon-Down is above 70 line, and Aroon-Up is below 30 line, then It is considered as a Strong Downtrend because Aroon Indicator Bounded with 0 to 100. So based on these ranges we can also identify Uptrend or Downtrend Very easily.
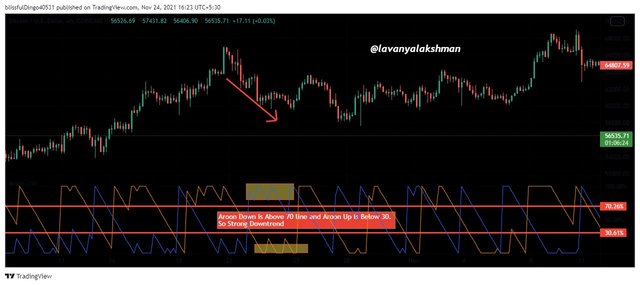
Image Taken FromTrading View
Like that, on Reading Aroon-Up and Aroon-Down lines we identify Trend Very easily.
Calculations of Aroon-Up and Aroon-Down
We all know Based on highs and lows of price action Aroon Indicator work.
So it's Math Formula behind it use also only Depend on those.
Here I calculated for 25 periods.
Aroon-Up =
[(25-Number Of Periods Since the Recent 25 Periods High)/25] × 100.
Aroon-Down =
[(25-Number Of Periods Since the Recent 25 Periods Low)/25] × 100.
Suppose here we need to Calculate the Aroon-Up value for Today, Then first we need to determine the Point in time when the price was highest in the last 25 days. For Example, if it was 2 days ago then the formula would be.
Aroon-Up = [(25-2)/25] ×100
= 93
So here Aroon-Up = 93
Similarly, For Calculating the Aroon-Down value for Today, Then first we need to determine the Point in time when the price was low in the last 25 days. For Example, if it was 3 days ago then the formula would be.
Aroon-Down = [(25-3)/25]×100
= 88
Now we check this calculation on checking real values.
For this, I just go to Trading View and get past the day of BTC highs and Lows.
Here we calculating Aroon Indicator for the past 25 days. In my writing, this blog date is 25-11-2021 so, the past 25 days means nearly 30-11-2021 still that date we need to take BTC Historical data.
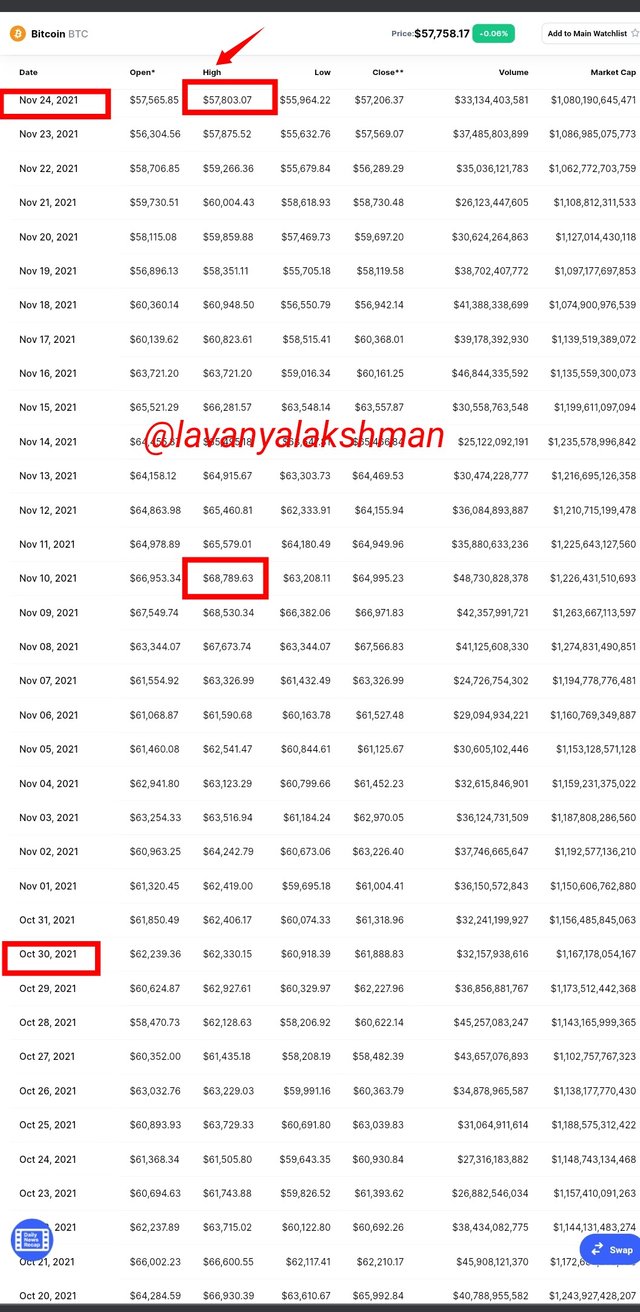
Image Taken From Trading View
As per data, Yesterday Price is $57803, in the last 25 days it's high is around $68789. It occurred on 10-11-2021. So it's nearly happened 15 days ago.
Now we get all the needed details we apply those data in the Aroon-Up formula.
So Aroon-Up = [(25-15)/25] ×100
= 40
So Aroon- Up value is 40.
Similarly, now we try to find Aroon- Down, for again go coingeko and get BTC historical data. At this time we need to check the past 25days low when it occurred.
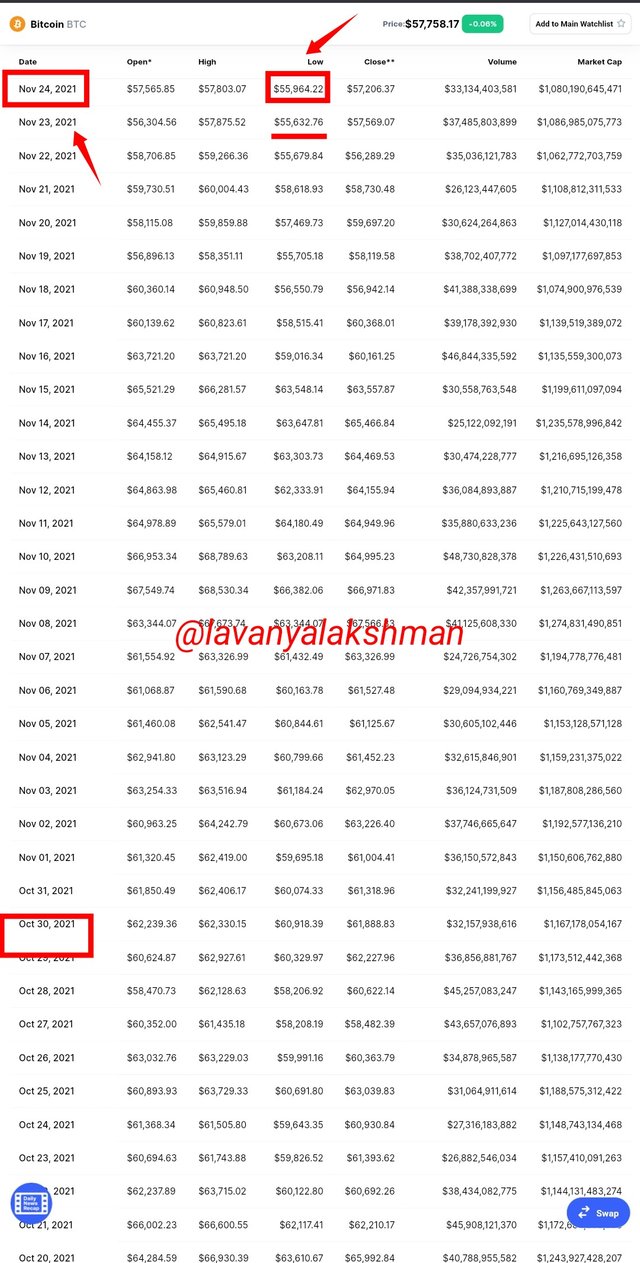
The image was taken From Trading View
On checking the past 25 days Lows of BTC, Yesterday Low is $55964, Now I check the past 25 days when it hit Low than yesterday price. On checking data I notice $55632 is the low price in the past 25 days. It occurred on 23rd November. Means 2 days back it hit its low price.
Now we get all the needed details we apply those data in the Aroon-Down formula.
So Aroon-Down = [(25-2)/25] ×100
= 92
So Aroon-Down value is 92.
Those data are now verified through the Trading view on applying Aroon Indicator on our chart.
For checking here I take BTC/USD, 1 Day chart. Then apply Aroon Indicator on my chart. And Edit Aroon Indicator Periods to 25 days. Because here I confirm my calculation for 25 days, That's why.
After editing all details now we exact values for Aroon Up and Aroon Down which I get on using Its Formula.
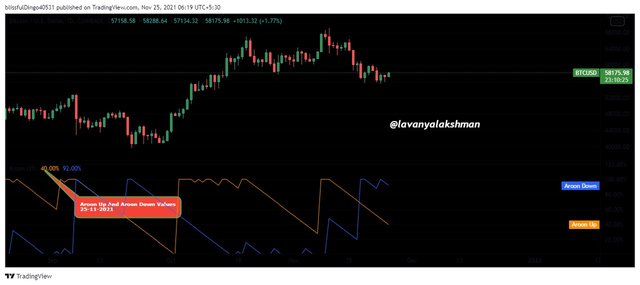
Image Taken FromTrading View
Here it's clearly showing Aroon-Up as 40 and Aroon-Down as 92.
This means it follows Its Formula, Based on that it shows a chart to us. But not following present price action. So don't trade blindly on using one Indicator, Always try to conform with Other Indicators, Then Take your positions.
Setting Up Aroon indicator on the chart
For this Illustration, I chose Trading View for setup Aloon Indicator.
For this Just go to Trading View, Then Open your needed chart. For Example here I took DOT/USDT Chart.
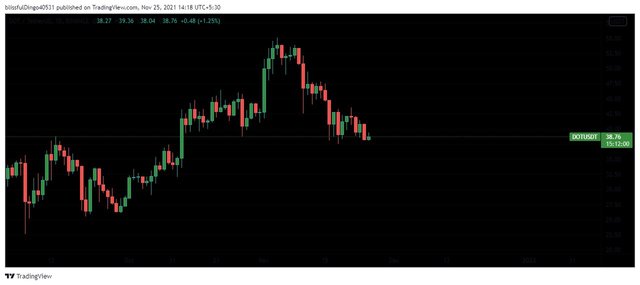
Image Taken FromTrading View
Now go Indicator tab, In the search bar just Type Aroon.
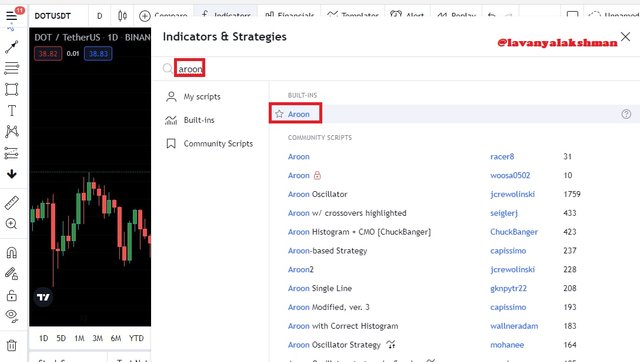
Image Taken FromTrading View
Now we get Aroon Indicator On our Chart.
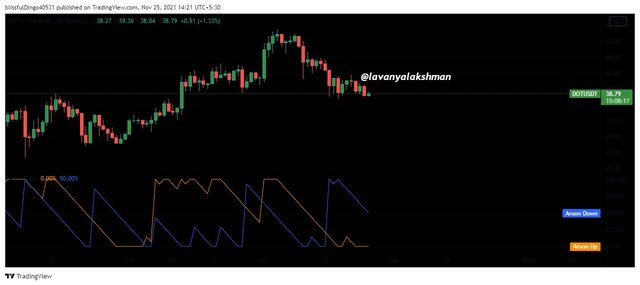
Image Taken FromTrading View
Now here we can change its settings as per our need on selecting its Setting tab.
Here, by selecting Inputs we can change its periods as per our needs.
By default, it is set to be 14.
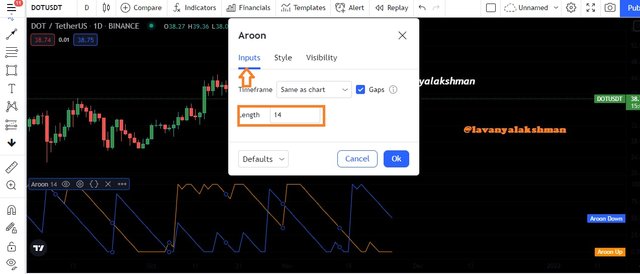
Image Taken FromTrading View
Now it's the value we can change as per our needs. For example, here I changed its inputs to 25 periods, Then Aroon Indicator looks like this below.
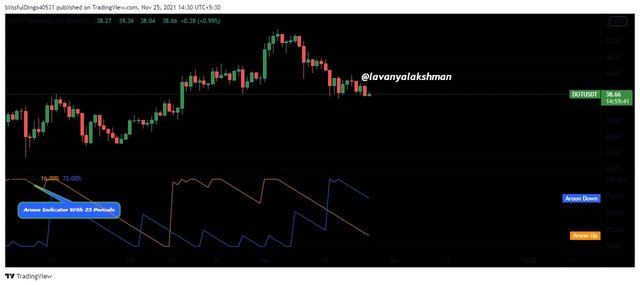
Image Taken FromTrading View
If I change periods to 50, then Aroon Indicator looks like below.
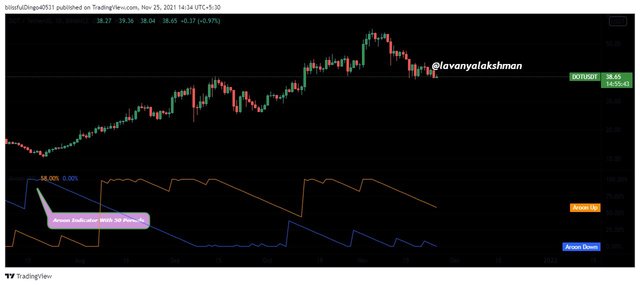
Image Taken FromTrading View
If I change periods to 100, then Aroon Indicator looks like below.
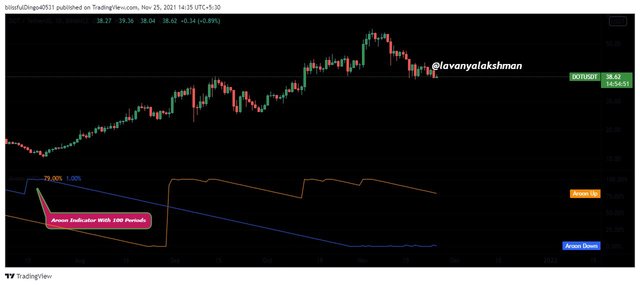
Image Taken FromTrading View
Like that, we can change periods per our needs in Aroon Indicator.
Now we can also its syle of visibility of chart.
By default, it is set like this.
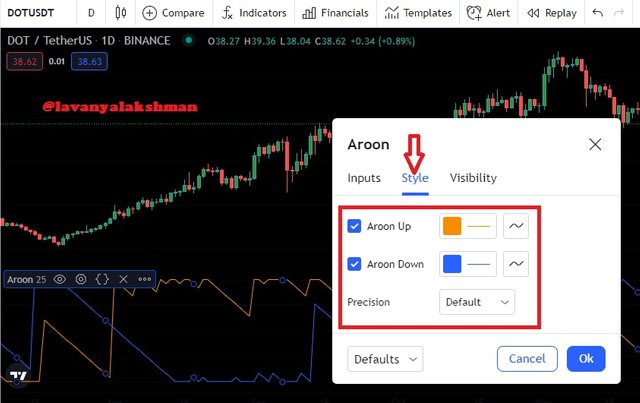
Now I changing as per my need like this.
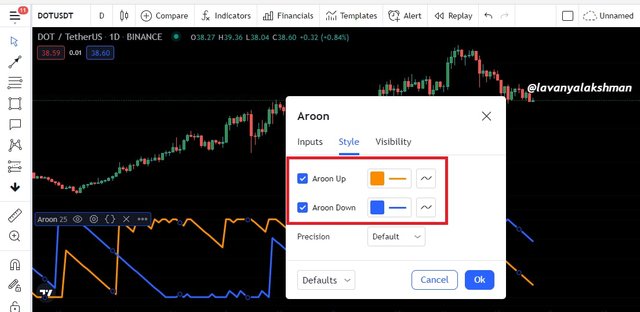
Now Aroon Indicator looking like this.
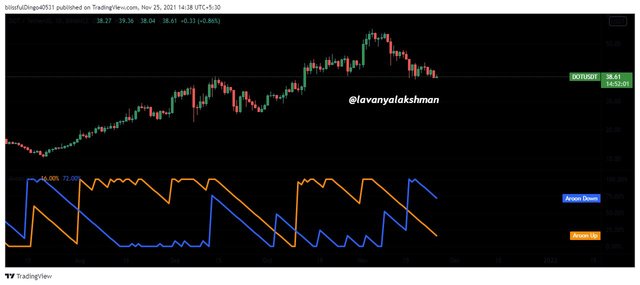
Image Taken FromTrading View
Like that we can Edit Aroon Indicator As per our needs through its Setting Tab.
What is your understanding of the Aroon Oscillator? How does it work?
At first Aroon Oscillator Developed by developed by Tushar Chande in 1995 with help of Aroon Indicator.
Aroon Oscillator is Trend following Indicator but it works based on Aroon-Up and Aroon-Down.
So for creating an Oscillator it uses Aroon-Up and Aroon-Down.
By Default Aroon Oscillator is set to be 14 periods, And it has Boundaries from -100 to +100.
So Zero Line Considers as Middle Line.
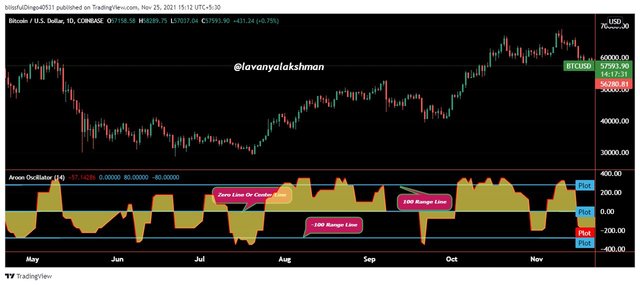
Image Taken FromTrading View
By using Aroon Oscillator we can identify Short Term Trend Change Very easily.
Aroon Oscillator always moves -100 to +100 range so Zero-line is considered as Middle line.
If Aroon Oscillator Moving above Zero line is considered as Uptrend.
similarly, if it moves below zero line, is considered as Downtrend.
Along with trees also watch +50 and -50 range for knowing strength in the present Trend.
How Do we Get Bullish/Bearish Signal From Aroon Oscillator
We already know Aroon Oscillator bounded with the -100 to +100 range, and by default, its periods are set to be 14.
Aroon Oscillator Bullish Signal
If Aroon Indicator Move above the Zero line is Considered as Bullish Trend.
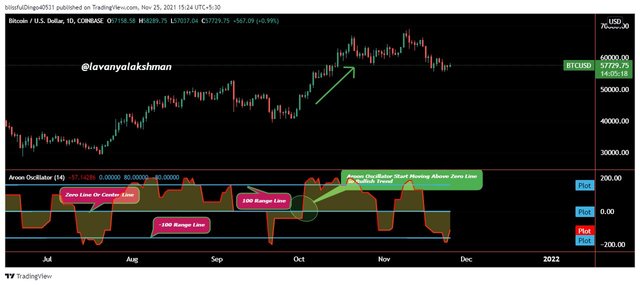
Image Taken FromTrading View
In the above example, In one place Aroon Oscillator start moving above the Zero line, so We considered as Bullish Market we get soon.
Aroon Oscillator Bearish Signal
If Aroon Indicator Move Below the Zero line is Considered as Bearish Trend.
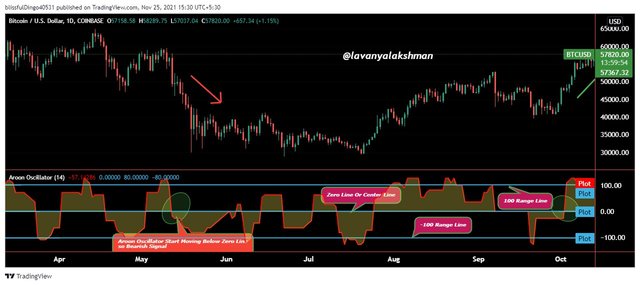
Image Taken FromTrading View
In the example, In one place Aroon Oscillator start moving below the Zero Line, so We considered it as Bearish Market we get soon.
Like that based on Aroon Oscillator, We Identify Bullish/Bearish Trend in Present Market. Based on those signals we can do profitable Trades Very Easily.
Calculation Of Aroon Oscillator:-
We know each Indicator work based on Math Formula.
So here Aroon Oscillator we derive Subtracting Aroon-Up and Aroon-Down values.
So its Formula would be
Aroon Oscillator = Aroon Up - Aroon Down.
Here
Aroon-Up =
[(25-Number Of Periods Since the Recent 25 Periods High)/25] × 100.
Aroon-Down =
[(25-Number Of Periods Since the Recent 25 Periods Low)/25] × 100.
Now we check by manual on applying Math Formula.
Before, testing the Aroon-Up and Aroon-Down calculation I take BTC/USD, a 1-day chart with 25 periods. The same chart here was also taken along with using the same Aroon-Up and Aroon-Down Values here also.
So Aroon-Up = 40, Aroon-Down =92
So Aroon Oscillator =
(Aroon-Up) - (Aroon-Down)
                               = 40-92

                               = -52
So Aroon Oscillator is -52.
Now we check its value is correct on applying Aroon Oscillator on Chart.
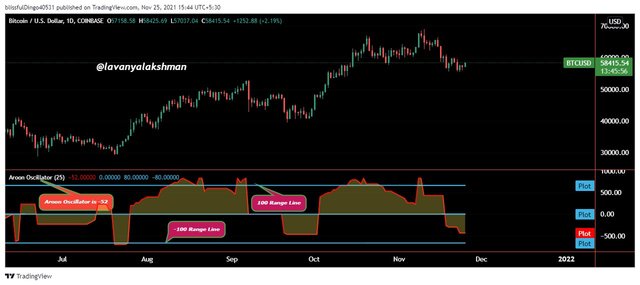
Image Taken FromTrading View
In the above chart, Aroon Oscillator also shows its value is -52.
So from this, we understand Aroon Oscillator always follow its Formula and Based on this only it gives Signals to us.
Consider an Aroon Indicator with a single oscillating line, what does the measurement of the trend at +50 and -50 signify
We already know Aroon Indicator move -100 to +100 range and Zero- line considered as Middle line.
If Arron Oscillator moving above Zero line means Bullish Trend, if it moves below zero line considered as Bearish trend.
But it not always becomes True, Some times after moving the Zero line it again start moving below zero. If we place our signals based on it, there are huge chances to lose our trade.
So for identifying Strength in the present trend we need to consider +/- 50 ranges too.
If Oscillator moves from zero to above +50 we considered it as Strong Uptrend so we can place Buy Long There.
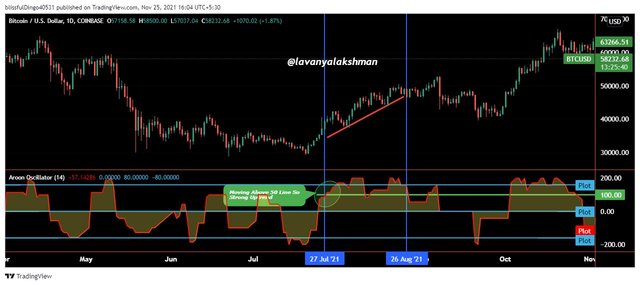
Image Taken FromTrading View
Similarly, If the Oscillator moves below zero to -50, then we considered it as Strong Down Trend so we can place Sell Short There.
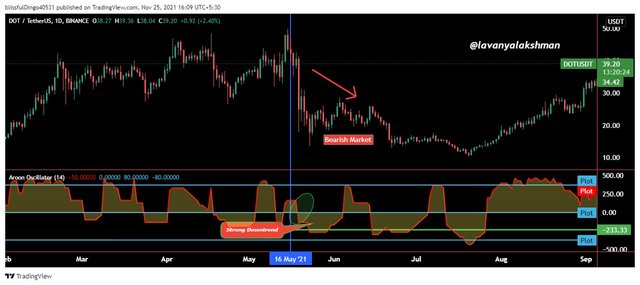
Image Taken FromTrading View
So on considering +/-50 ranges of Oscillator we can avoid false signals from Aroon Indicator very Easily.
Explain Aroon Indicator movement in Range Markets.
Ranging Market Means Sideway Market, here asset Price moving from one price another fixed price, without getting any Major Dump/Pump. In this situation, we called Ranging Market.
In Ranging Market Aroon Indicator Form Zig-Zag movement, not get any cross overs until we get Trending/Dumping Market.
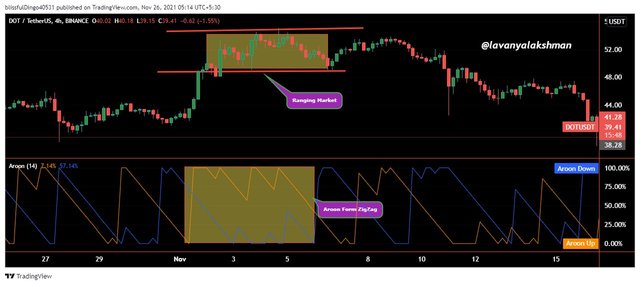
Image Taken FromTrading View
In the above Image, Aroon-Up and Aroon-Down form a Zig-Zag Movement and do not get any crosses overs, so it Indicates at Present Market going in Ranging or Sideway. So Most of the Traders don't like to Trade in that situation until they get clarity on Market Conditions.
So here they wait some more time, after getting Clarification only they do Trading.
Does Aroon Indicator give False and Late signals? Explain. Show false and late signals of the Aroon Indicator on the chart. Combine an indicator (other than RSI) with the Aroon indicator to filter late and false signals
We know Indicators only work on using past data not work using present Trends. And also follow only its Formula, Not give signals based on Prest Situation. So there is a high chance to get False and Late signals from the Indicator.
So before taking a Decision, we need to confirm with other Indicator that always helps us to do Profitable Trades.
False Signal From Aroon Indicator
Aroon Indicator gives Buy/Sell signals. Those we Identify based on Cross Overs of Aroon-Up and Aroon-Down.
We know If Aroon-Up after crossover move above Aroon-Down is Indicate Uptrend so we place Buy Long there, Otherwise if it move Below Aroon-Down then it considered as Downtrend so we place Sell Shot there.
But some times Market start moving Opposite to Aroon Indicator Signals, So before taking our Position we much consider present Market Conditions too. Due to sudden change in Market, we get like that Situation very rarely.
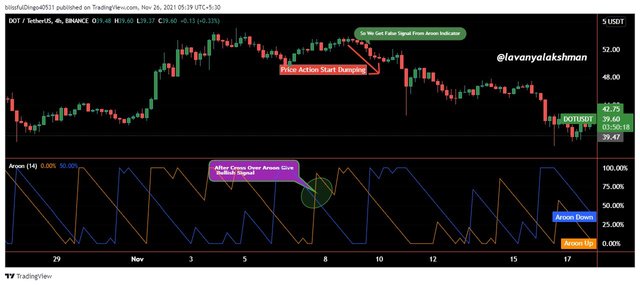
Image Taken FromTrading View
In the above Image, After crossing over, Aroon-Up start Moving Aroon-Down so we considered Bullish Tred so we place Buy orders there, But in Price Action is in Down Trend, so in reality here we get false Signa from Aroon Indicator.
So don't trade blindly on using Indicator Signals.
Late Signal From Aroon Indicator:-
Sometimes we need to take our Decisions based on Present Market Condition then only possible to book good profit and escape from huge losses.
If we wait until getting clarification from Signal, here we miss a good chance to book good profits.
Coming to Aroon Indicator, sometimes it reaches slowly so we get very late Signals from it. Because Aroon is a lagging Indicator so it takes time to react to the present situation.
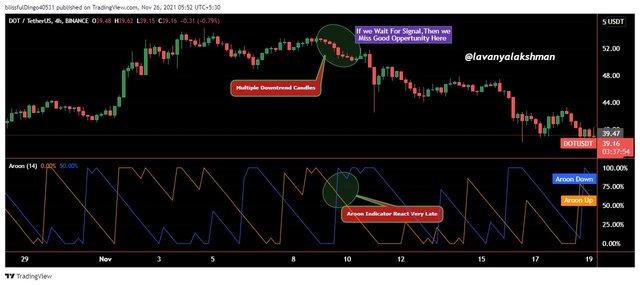
Image Taken FromTrading View
In the above Image, We get a lot of Downtrend Candles in Price Action But Aroon Indicator does not Respond Immediately, It responds very Late.
So here If we wait for a Signal From Aroon Indicator, Then we lose good and quick profits here.
So always do trading based on the Present Situation with help of Indicators, Don't completely depend on Indicators.
How to Filler Late and False Signal From Aroon Indicator With Help Of Moving Averages
For Identifying False and Late Signal From Aroon Indicator here I use Moving Average with 50 periods on my chart.
Because Moving Average Reading on the chart is very easy because it contains only a single line and the most popular and Perfect Signals we get from it.
All we know is if Price Action starts moving above the MA line is considered an Uptrend.
Similarly, If Price Action starts Moving Below the MA line is considered a Downtrend.
Now we check, a combination of these Two indicator and Their perfection on the chart.
Aroon Late Signal Identification With Help of Moving Averages
We already know some times Aroon Indicator respond slowly due to this we miss great opportunities but those we can identify very easily by applying Moving Averages Along with Aroon Indicator.
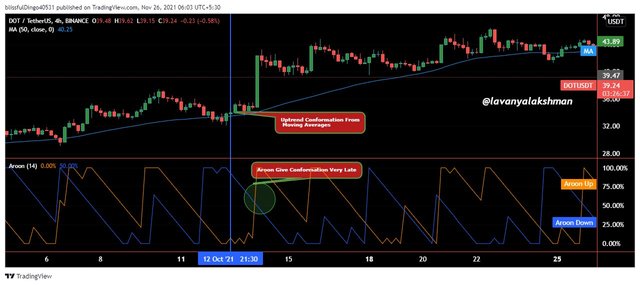
Image Taken FromTrading View
In the above example, Here I took DOT/USDT chart.
On checking the chart, we can notice, in one place Price Action start moving above the Moving Average line, It Indicating a Bullish Trend in the Market. But at that time Aroon was Showing Bearish Trend, and Respond very lately.
If we wait for Signal From Aroon Here, Then we can miss one great and Quick profitable trade here. So sometimes we can fo our decisions without depending on Indicators.
Aroon False Signal Identification With Help of Moving Averages
We know no Indicator give always 100% correct signals, Times it gives false Signals. Those we can confirm on applying other Indicators on our chart.
Here for Identifying False Signals from Aroon Indicator, I apply Moving Averages on my chart.
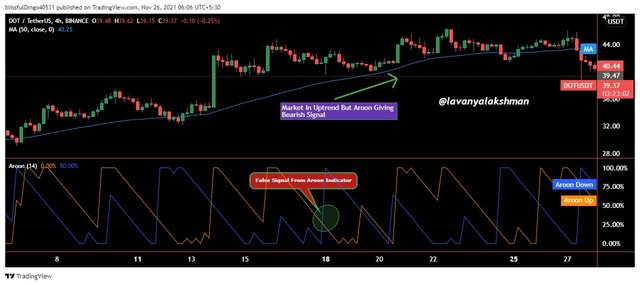
Image Taken FromTrading View
In the above example, Here I took DOT/USDT chart.
On checking the chart, In one place I notice, Market is in Uptrend, as per Moving Averages but Aroon Indicator suddenly start showing Bearish Signal.
If we trade based on Aroon Indicator Signal, here there is a high chance to lose our trade.
So don't trade blindly with help of only one Indicator, Always try to apply more than one Indicator on the chart then take your decisions.
Place at least one buy and sell trade using the Aroon Indicator with the help of the indicator combined in (7) above
For this Task need here I using Paper Wallet Demo Account in Trading View. Then apply Aroon and MA 50 on my chart.
Sell Shot Trade With Help of Aroon Indicator and Moving Averages
For this Illustration here I take the HIVE/USDT chart, of 5 minutes.
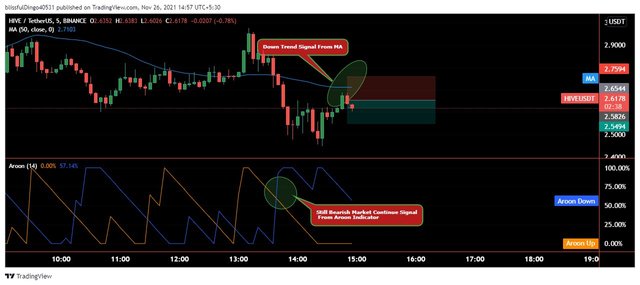
Image Taken FromTrading View
On checking the chart, As per Moving Averages, it shows a Downtrend but in one place It starts to try to move above, Due to Strong Resistance it again Starts moving its Orginal Direction.
And I also get confirmation from Aroon, It showing present new trend still is Bearish.
Because we can identify Present Trend Continutinty with help of Aroon.
That's why based on two Indicator signals here I place my Sell Shot Position For Quick Trade.
Here I always apply 1:1 Risk and Reward Ratio for My Trade.
Buy Long Trade With Help of Aroon Indicator and Moving Averages
At present, not good, most of the coins are in Downtrend, so not possible to show any Buy long Task.
But I need to finish this task, so I choose Down tokens for my buy long trade setup.
Not only assets based on market conditions we can trade Up or Down Tokens of assets also we can trade based on market conditions with the help of Indicators.
So for my buy long set up, I choose BTC DOWN/USDT 15 minute chart.
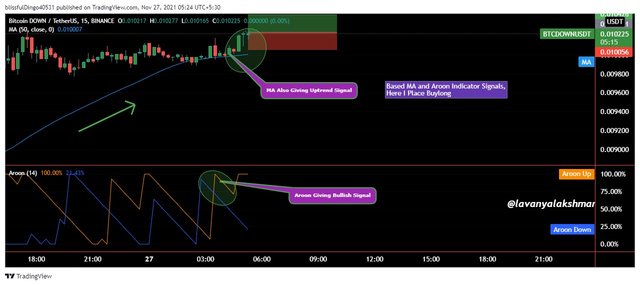
Image Taken FromTrading View
Here I get a Bullish signal from Aroon Indicator, then confirmed with it Moving Averages, That's why I place my Buy long set up like this.
Here I place by taking Profit and Stoploss at 1:1 ratio.
State the Merits and Demerits of Aroon Indicator
Any Indicator has some Merits and Demerits, Before applying those we must understand its Merits and Demerits.
Then only we can do profitable Trades.
Merits Of the Aroon Indicator:-
Aroon Indicator always Show Present Strength and Trend Continuity signals we get.
Aroon Indicator give Buy/Sell points to us.
Based on Aroon-Up and Aroon-Indicator Cross-Over we can identify new Trend Change in the Market Very Easily.
Aroon Oscillator helps a lot for Identifying the Strength of present Trends.
Demerits Of The Aroon Indicator:-
Aroon Indicator is a Lagging Indicator so it always Responds very late.
Aroon Indicator follow Highs and Lows of a particular period, so not give signal based on preset Market Conditions.
In Sideway Market, Aroon Indicator give a lot of false Signals.
Conclusion:-
Aroon Indicator is one type of Indicator. It comes with Aroon-Up and Aroon-Down lines.
If Aroon-Up is moving above Aroon-Down is considered as Bullish Market, If it goes below Aroon-Down then we are considered as Bearish Market.
Aroon Indicator shows Strength in Present Market and also give Buy/Sell signals.
By using Aroon Indicator we can also Identify New Trend Change very easily.
But always verify Aroon Indicator signal with other Indicators, then only we get profitable Trades.
Thank you professor @fredquantum for this great and useful course to us.
Thanks For Reading My Post