Hi all, In this lecture from @fredquantum, I learn another very useful and helpful crypto Tool On-Balance-Volume Indicator.
Thank you very much for making it a wonderful lecture for us.

In your own words, explain your understanding of the On-Balance Volume (OBV) Indicator.

For Trading needs, there is a lot of Indicators available in the Market. With help of those, we make our Trading decisions quick, faster and easier.
From this On-Balance Volume (OBV) Indicator is also one type of indicator. By using this Indicator Signal we can do profitable trades very easily.
Because OBV Indicator is an Momentum Based Indicator, It calculates Buying or Selling Pressure in the market.
If we know which pressure is high in the Market then our trading becomes very easy. Based on those data we can take our positions before the Market get a reversal.
About On-Balance Volume Indicator:-
Originally On-Balance Volume Indicator also called as , Continuous Volume. It was developed by Joseph Granville, who popularised the technique in his 1963 book ‘Granville's New Key to Stock Market Profits.
On-Balance Volume Indicator is an Momentum Indicator, It Indicates Volume flow whether it's a Buy/Sell from this we can predict upcoming market direction very easily.
This Indicator Developer Granville strongly believe Volume Flow Direction is a key force behind determining upcoming Price Moment in the Market. That's why for calculating Volume Flow direction in Market, he develop On-Balance Volume Indicator.
In his book, he described the predictions generated by OBV Indicator as "a spring being wound tightly." This means If the market has no moment or goes in sideways then we can see a Big Uptrend/Downtrend Market very soon.
If possible to determine what type of market we see in upcoming, then our tradings become easier. Identifying that On-Balance Volume Indicator helps a lot.
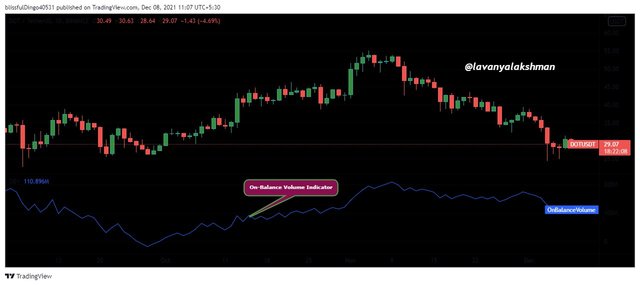
Image Taken From TradingView
On-Balance Volume Indicator measures Buying and Selling pressure as a cumulative, so it adds Volume on Up-Days and Subtracts Volume On Down-Days. Based on this, OBV Indicator gives a signal to us.

Adding On-Balance Indicator On Crypto Chart.

For this illustration, I use TradingView platform. Because it's very easy to use and available all almost all Indicators here. We can add our needed Indicator on our needed chart free of cost. That's why I choose this platform for this illustration needs.
- For this just go TradingView then select which chart you need.
Here I selected one of my favourite DOT/USDT Chart here.
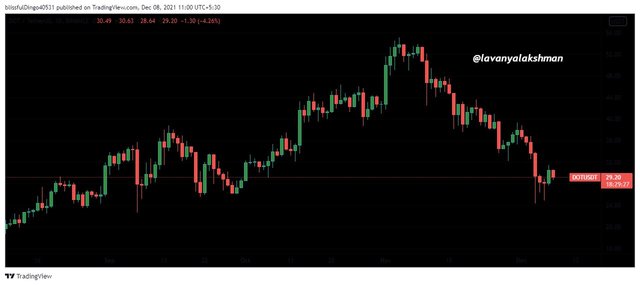
Image Taken From TradingView
- Now Select Indicator Tab, In its Search bar just Type On Balance Volume, From the list select On-Balance Volume Indicator.
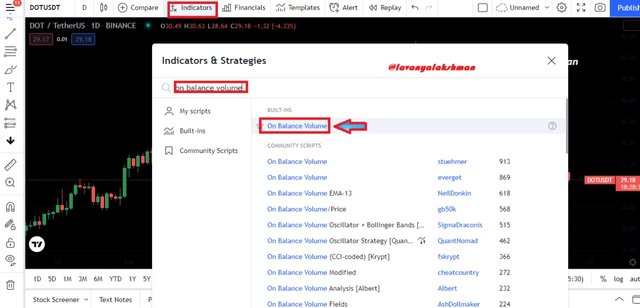
Image Taken From TradingView
- Now It's Successfully Added to my Chart.

Image Taken From TradingView
- Based on our needs we can change that Indicator setting by clicking its Setting tab.
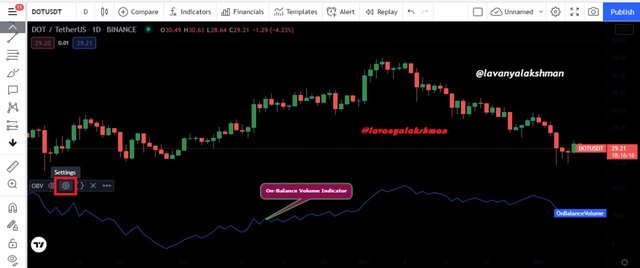
Image Taken From TradingView
But in this Indicator, there is nothing to change. So use it as it is.

Formula and Calculation of On - Balance Volume Indicator.

Any Indicator gives a signal based on its formula only. So before applying those signals must lean it's a formula on which base it giving a signal to us.
Then only possible to get profitable trades.
Maths Formula Behind On - Balance Volume Indicator.
On-Balance Volume Indicator gives signal based on Volume flow in the market. Here we get three types of scenarios, so based on three conditions, Indicator's Math Formula will change. Because OBV is a Cumulative Indicator. It runs on a total of positive volume and subtracts the negative volume. Along with Assets Closing Prices also need to consider, in the particular time frame.
Scenario 1:-
If the closing price of the asset is higher than the previous day’s closing price:
Then
On-Balance Volume =
Previous OBV + Current Day’s Volume
Scenario 2:-
If the closing price of the asset is the same as the previous day’s closing price
Then
On-Balance Volume = Previous OBV + 0
Scenario 3:-
If the closing price of the asset is lower than the previous day’s closing price.
Then
On-Balance Volume =
Previous OBV - Current Day's Volume
Here we can observe one thing, here we adding the day's volume to a cumulative total when the assets closing price is higher than the previous.
Similarly, subtracting, its closing price is lesser than previous.
Calculation of On-Balance Indicator
Before we learn Math Formula behind On-Balance Volume Indicator. Now we try to calculate it's a formula by assuming random values.
For Example here, I take random assets closing price and Its Volume up to 5 days for calculating On-Balance Volume.
| TIME FRAME | CLOSING PRICE | VOLUME |
|---|---|---|
| Day 1 | 10 | 25200 |
| Day 2 | 10.15 | 30000 |
| Day 3 | 10.17 | 25600 |
| Day4 | 10.13 | 32000 |
| Day 5 | 10.13 | 23000 |
As per the above data, we get second and Third days closing prices are higher than its previous closing prices, so those times we need to add.
Coming to the fourth day its closing price is less than the previous so here we then need to subtract its volume.
Coming to the Fifth day, it don't get any change compared to its previous day closing price. So no change on OBV.
Now we calculate OBV based on its formula.
Day 1, OBV = 0 ( Because we don't know previous data so consider as zero)
Day 2, OBV = 0+ 30000 = 30000
Because Day 2 closing price is higher than Day 1 closing price, so we need to add OBV with its present Volume
- Day 3, OBV = 30000+25600 = 55600
Because Day 3 closing price is higher than Day 2 closing price, so we need to add OBV with its present Volume
- Day 4, OBV = 55600 - 32000 = 23600
Because Day 4 closing price is less than Day 3 closing price, so we need to Subtract OBV with its present Volume.
- Day 5, OBV = 23600 +0 = 23600
Because Day 5 closing price is equal to Day 4 closing price. So here we don't add any volume, What you get the previous day OBV, same we get for today also. There is no change in OBV.
Like that On-Balance Volume Indicator give signals based on its Maths Formula.

Trend Confirmation On Applying On- Balance Volume Indicator:-

For getting profitable trades we need to Identify the present Trend direction. If we identify the present market going in Uptrend/Downtrend, then it's very easy to place our orders based on market conditions. So here we get profitable trades too. Because here we following the Trend.
In Crypto Market for getting profitable gains, we must follow Trend otherwise we not possible to get profits here.
On applying an On-Balance Volume Indicator on our needed chart, we can easily Identify the present Market Direction very easily. For this just need to observe OBV chart is enough.
We know OBV Indicator measures cumulative buying and selling pressure by adding volume on Up Days, Subtracting Volumes on Down Days.
Now we see on using OBV Indicator help, how we determine Uptrend/Down Trend In Market.
Identifying Bullish Trend:-
Bullish Trend we get when OBV moves upward direction. This means the assets closing price is higher than its previous closing price and Its Buying Volume also Increased then we get Bullish Market in that Time frame.
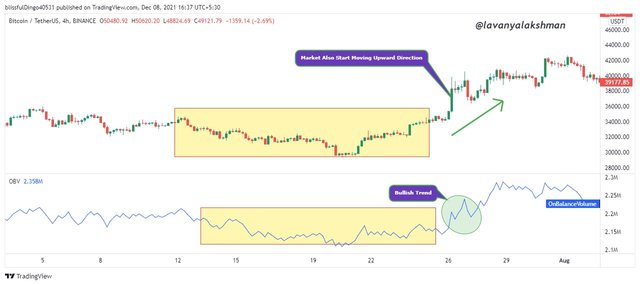
Image Taken From TradingView
In the Above BTCUSDT, 4hours Chart, we see when the market starts moving upside, OBV also start moving with it. And it breaks previous high and start making higher highs, so we consider it as Bullish Trend. So we can place Buy Long positions when we get an opportunity.
Identifying Bearish Trend:-
Bearish Trend we get when OBV moves Downside direction. This means the assets closing price is lesser than its previous closing price and Its Buying Volume also start Decreasing then we get Bearish Market in that Time frame.
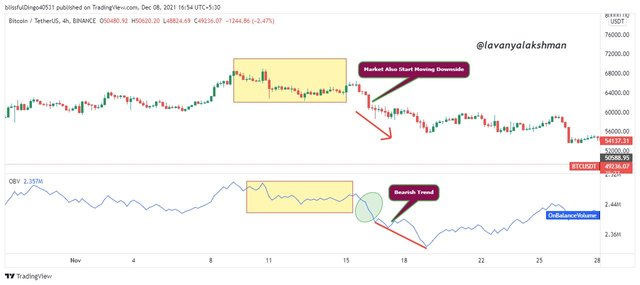
Image Taken From TradingView
In the Above BTCUSDT, 4hours Chart, we see when the market starts moving Downside, OBV also start moving with it. And it breaks previous lows and starts making lower lows, so we consider it as Bearish Trend. So we can place Sell Short positions when we get an opportunity.
Like that based On-Balance Volume Indicator we can easily identify present Trends in the Market.

Breakout Confirmation with On-Balance Volume Indicator.

Before applying the On - balance Volume Indicator Strategy on Breakouts, first, we need to know about, what is Breakout means. Then only possible to understand its Signals at that time.
We know any Assets price not moving in Upward or Downside moment, some times in go consolidate phase, here assets price move its previous Support and Resistance Level itself. In that time taking positions is always dangerous.
When the price of assets crosses its Support or Resistance Levels, is known as Breakout. After the breakout, it may go in any direction whether Upward /Downward direction.
So traders always wait for Breakouts, after checking price action they give their entries.
Those Breakouts identifying not so easy for beginners but on applying the On-Balance Volume Indicator on our chart, we can determine those very easily.
If we identify at the correct time then taking our entry/exit becomes very easy. In this Situation, we grab good profits very easily.
Bullish Breakout Confirmation with On-Balance Volume Indicator.
After consolidating some time, then Price Action start moving over its previous Resistance level and also start making its higher highs. This type of Breakout we consider as Bullish Breakout so we get Uptrend Market then after in that Time frame.
Those we identify on using On - Balance Volume Indicator Very Easily.
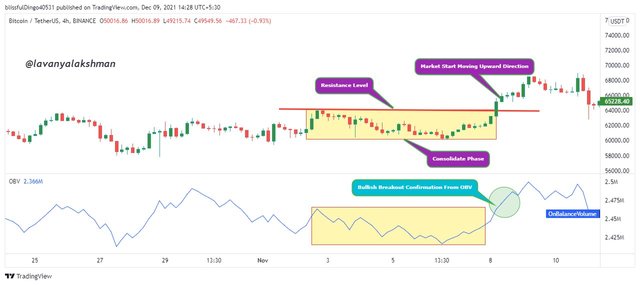
Image Taken From TradingView
In the above Example, BTCUSDT, 4 hours chart, we see in a certain time frame, BTC Price consolidates then after, it moves upward direction on breaking its Resistance Level, and start making Higher Highs, Similarly OBV also breaks its previous level and start moving Upside. It is significant as the Bullish Trend. So based on its signal we need to place our positions, then we easily earn good profits.
Bearish Breakout Confirmation with On-Balance Volume Indicator.
After consolidating some time, then Price Action start moving over its previous Support level and also start making its lower lows. This type of Breakout we consider as Bearish Breakout so we get Downtrend Market then after in that Time frame.
Those we identify on using On - Balance Volume Indicator Very Easily.
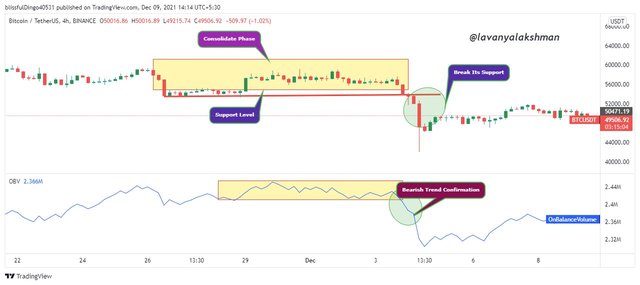
Image Taken From TradingView
In the above Example, BTCUSDT, 4 hours chart, we see in a certain time frame, BTC Price consolidates then after, it moves downside on breaking its Support Level, and start making Lower Lows, Similarly OBV also breaks its previous level and start moving Downside. It is significant as the Bearish Trend. So based on its signal we need to place our positions, then we easily earn good profits.
Like that with help of On-Balance Volume Indicator, we can identify Market Move after its Breakouts also very easily. Based on those signals we can give Entry/Exit, from this we can easily earn good profit in the Short term.

Advanced Breakout with On-Balance Volume Indicator.

We already know what Breakout means and how to identify those with help on OBV Indicator.
Now we learn what is Advanced Breakouts and how to identify those with help of OBV Indicator.
We know Breakouts occurs when the price of assets break its previous Support/Resistance level. In this situation, we get Bullish/Bearish market then after.
But OBV starts moving UpWard/Downward direction before getting Price Action and breaking its previous highs/lows, it tries to make its new Higher highs/Lower lows. Like that Breakouts known as Advance Breakouts.
Those we identify on applying On-Balance Volume Indicator on our chart.
Here we can take our positions before getting confirmation from Price Action. But here high risk is involved but possibly we can grab good profits than other traders. Because we taking our position before others Enter.
In ranging market Advance Breakout Strategy helps a lot.
Bullish Advance Breakout Identification with help of On-Balance Volume Indicator
In a ranging market, if the Price action starts moving towards breaking its previous Resistance. Before Bullish Breakout occurred, OBV tries to make its new high on breaking its previous high. In this Situation we determine Bullish Advance Breakout occurred here, then aftermarket goes Upward Direction.
Because the OBV indicator shows volume pressure on buying assets rather than sellers, so we get Uptrend Market then after.
In that situation, we need to place Buy long positions rather than Sell Shot, with proper Stop loss for grabbing good and quick profits here.
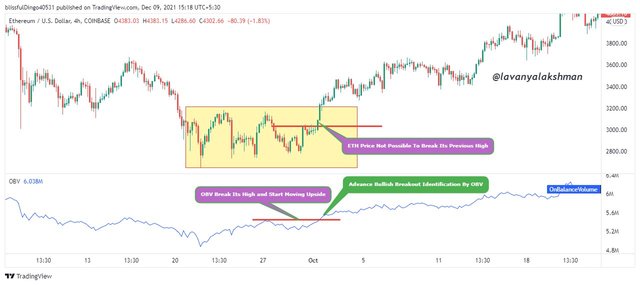
Image Taken From TradingView
In the above Example, ETHUSDT 4hour Chart, we see before resistance breakout, we see OBV breaks its previous high and start moving upward direction. It significant's buyer's volume, so soon it gets Bullish Breakout, then start moving Upward Direction.
Here we identify upcoming price moves before its Bullish Breakout happens, if we give our entries here, then there is a high chance to grab good profits than other traders.
Bearish Advance Breakout Identification with help of On-Balance Volume Indicator
In a ranging market, if the Price action starts moving towards breaking its previous support. Before Bearish Breakout occurred, OBV tries to make its new lows by breaking its previous low. In this Situation we determine as Bearish Advance Breakout occurred here, then aftermarket goes Downward Direction.
Because the OBV indicator shows volume pressure on selling assets rather than buyers, so we get Downtrend Market then after.
In that situation, we need to place Sell Short positions rather than Buy long, with proper Stop loss for grabbing good and quick profits here.
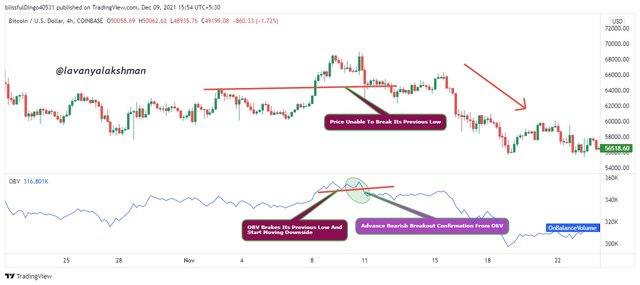
Image Taken From TradingView
In the above Example, BTCUSD 4 hour chart, ETH price does not break its Support level but OBV breaks its previous low and start moving Downside. It signifies soon we get Bearish Market, so close your open positions and be ready for placing sell short orders when we get the opportunity.
Like that with help of the On-Balance Volume Indicator, we can easily determine Advance Bullish/Bearish Trends. Based on that signal we can give our entry/exit positions at an early stage.

Identifying Bullish Divergence and Bearish Divergence with help of On-Balance Volume Indicator.

We know in Bullish Market, price action on making its Higher Highs it goes upward Direction.
Similarly in Bearish Market, Price action on making its Lower Lows moves downside.
Some times OBV indicator does not move along with Price Action, It moves in the opposite direction. In that situation is known as Divergence.
Whether If it goes opposite to Bullish Market it makes Bearish Divergence.
Similarly, if it goes opposite to Bearish Market, it makes Bullish Divergence.
Now we try to understand what is Bullish/Bearish Divergence.
Bullish Divergence:-
In Bearish Market, Price action move on making its new lower lows. But OBV goes opposite to it on making its Higher Lows, it indicating slowly Buyers Volume flow in that market rather than selling pressure. It indirectly significantly as Bullish Divergence occurred here.
It indicates to us, Bearish Trend does not continue for more days, it gets end soon. So we get Uptrend Market once again.
In that situation taking Buy long is a good choice than Sell Short.
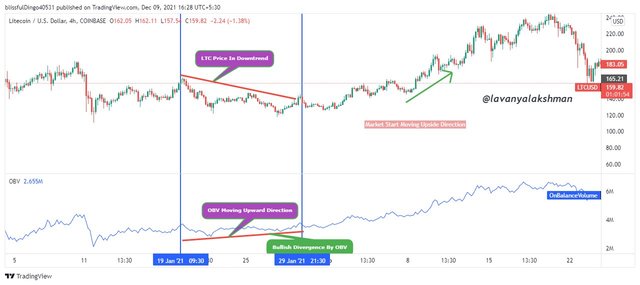
Image Taken From TradingView
In the above Example, LTCUSD 4hour chart, we see LTC price moving in Downside but OBV moving Upside and Form Bullish Divergence here.
This means soon Bearish market get to end and the Bullish market we get. So based on this signal we need to place Buy long rather than Sell Short.
Bearish Divergence
In Bullish Market, Price action move on making its new higher highs. But OBV goes opposite to it on making its Lower Highs, it indicating slowly Sellers Volume flow in that market rather than buying volume, It indirectly significant as Bearish Divergence. Occurred here.
It indicates us soon Bullish Trend does not continue for more days, it gets end soon. So we get Downtrend Market again.
In that situation taking Sell Shot is a good choice than Buying long.
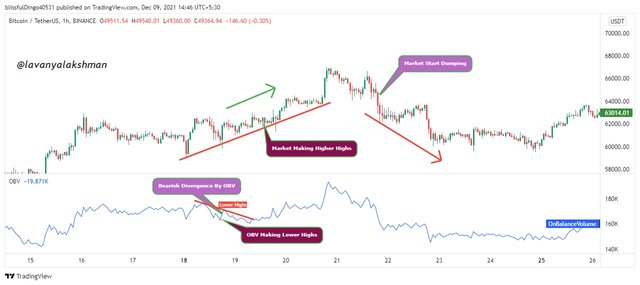
Image Taken From TradingView
In the above Example, BTCUSDT 1 hour chart, We see price action moving in an uptrend, but OBV start making Lower Highs, It is significant here Bearish Divergence occurred, so soon Market start moving in Downtrend, so we need to prepare ourselves for placing Sell Shot orders when we get opportunities.
Like that based On- Balance Indicator move, we can identify Market moves very easily.

Demo Trades

For this Illustration here apply Exponential Moving Averages with On -Balance Volume Indicator. Because of both combinations, we can easily identify entry/exit points very easily.
BNBUSDT Buy Long Setup:-
When Market Start moving Upside Direction on taking EMA's support, and On-Balance Volume also show upward Direction we took our Buy Long Position.
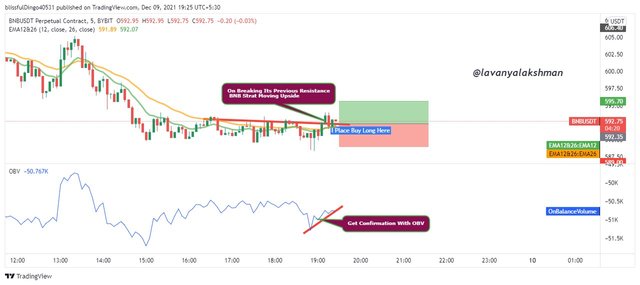
Image Taken From TradingView
Here I took 5 minutes chart when I check in the previous 20 to 30 minutes market in Consolidated and moved below EMA's. But Suddenly it starts moving Upside Direction on breaking its previous Resistance, I wait until 2 more candles close here.
Now I check OBV, it also starts moving upward direction. So I think the Market soon go in the upward direction in that particular time frame.
So I quickly place Buy Long here. And set up a 1:1 ratio as Risk and Reward here.
SAND/USDT Sell Short Setup:-
When Market Start moving Downside Direction on taking EMA's support, and On-Balance Volume also show Downside Direction we took our Sell Short Position.
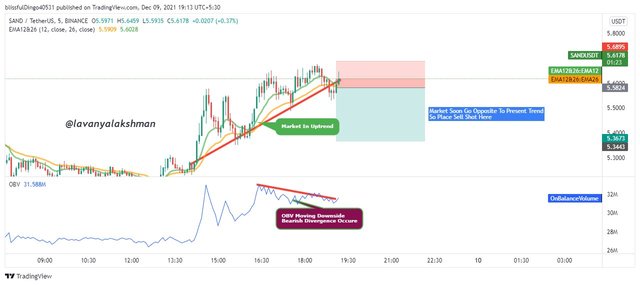
Image Taken From TradingView
Here I take 5 minutes chart, when I check the chart, the Market moving upward Direction but OBV start making Bearish Divergence.
We also know after Bearish Divergence from OBV, the Market must start moving in the opposite direction. That's why here I place my Sell Short orders. And also set 1:2 ratio as Risk and Reward.
We can also check my complete Trade History here. For this Trades Illustration, I use TradingView Paper Wallet. Because I am a learner not a professional. After getting practice I will try to use the original wallet for my trading needs.

Image Taken From TradingView
In the above image, we see my Two Trades History here.

Advantages and disadvantages of On-Balance Volume Indicator?

Before applying the On-Balance Volume Indicator on our needs must learn its limitations too, then oy possible to take the correct decision at the correct time.
Advantages of On-Balance Volume Indicator:-
Very simple indicator. Applying to the chart and understanding its signal is very easy because it contains only a single line chart. So even beginners also read its chart very easily.
Most familiar and very popular Indicator. Most of the traders apply this indicator for their trading needs.
This Indicator give perfect signals in all most all Market Conditions.
On-Balance Volume Indicator is a cumulative Indicator. Based on Volume flow direction it gives signals to us.
Using this we can identify the market further move after Breakouts.
OBV indicator gives signals based on present market conditions, that's why a lot of traders follow its signal for their trading needs.
Using this indicator we can Identify breakouts very easily.
Using this Indicator we can Identify upcoming exhaustion(Bull/Bear)
moves in the Market too.
Disadvantages of On-Balance Volume Indicator:-
Sometimes whales manipulate volume also for their needs, in that situation OBV give false signals.
Can’t be used Indicator alone, we must confirm with signals with another indicator.
In a Short time frame OBV give an irrelevant signal due to high volatility in the market. That's why for Short Time Trading needs, this Indicator is not useful.
Sometimes due to the project latest announcement, the project token price spikes, but OBV does not react based on it. If we wait for its signal, then we lose a good opportunity here.

Conclusion:-

The on-balance volume shows the intent of market players, often before the price action generates a buy or sell signal.
That's why most of the Traders use this Indicator for taking their Decision.
On-Balance volume give signals based on present market conditions, that's why it always follow Price Action Direction.
But it also works based on past data, so we cont took our decisions based on OBV signals alone. Because no indicator gives 100% correct signals always.
So don't trade blindly based on Indicator Signals, Must observe market conditions before making your decision.

Thanks once again professor @fredquantum for giving a wonderful and helpful lecture to us.
Thanks For Reading My Post
Veo que es extenso el mundo de steemit, tiene mucha variedad por lo visto, y me gustaría aprender más
Downvoting a post can decrease pending rewards and make it less visible. Common reasons:
Submit