

- Explain the Japanese candlestick chart? (original screenshot required)
- In your own words, explain why the Japanese candlestick chart is the most used in the financial market
- Describe a bullish and a bearish candle. Also explain its anatomy

Explain the Japanese candlestick chart? (original screenshot required)
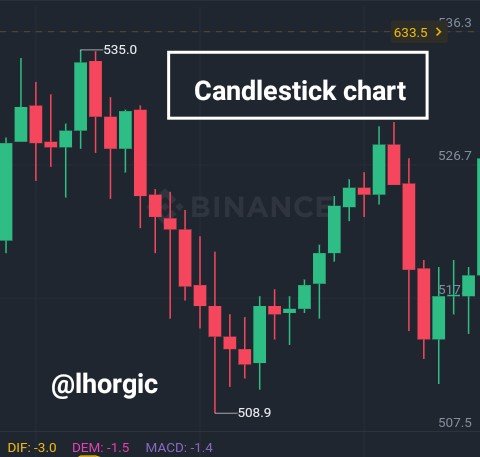
The candlestick chart like every other established chart is a graphical representation of price using what we call the candlestick. The Japanese candlestick was developed by a farmer who is a rice Marchant who and very knowledgible but wasn’t really famous but we use it today becaue we saw sense in what he came up with and reffered to as candlestick. The name of that famer was Munehisa Homma, he discovered the candlestick technique in the 1870 after studying how the market move, he understood that market moves based on demand and supply and then deviced a way through which one can benefit from the basis law of demand and supply that controls th market. Futher in this candlestick analysis, we denote movement with red and green candles.
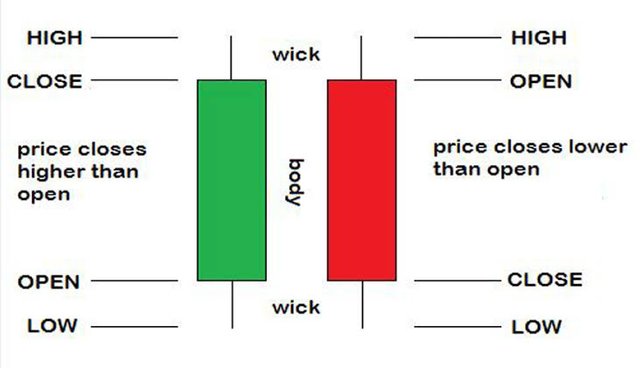
The green candle signals to a trader that price is on the increase (bullish) and the red candle signals to the tader that price is on the decrease (bearish). Now the formation of the candle or what you can choose to call the anatomy is structured into 5 parts which are:
- High
- Open
- Body of the candle
- Close
- Low
It is also important to mention that candlestick have pattern that helps trader studies price action effectively. These patterns includes doji, evening star, morning start, hammer etc. knowing how to interpret all these patterns will help you make wise trading decision coupled with the knowledge of a good technical analysis.

In your own words, explain why the Japanese candlestick chart is the most used in the financial market.
The candlestick chart has become one of the prominent chart over time and that is because of it very interesting features and benefit, traders all over the world has embraced it. Lets see why it is mostly used by traders below.
It can be easily interpreted by just glancing at it. It is not confusing in any way, you can determine the trend just by looking at the chart.
The direction of the market is also very clear, it can tell if the market is in an uptren or a downtrend coupled with the fact that it can also tell if the trend is strong or not
The wicks or shadow on the chart can also help inform trader of where price had been before which can also help in making wise decision.
Candlestick chart give a detailed view of price, by showing the opening price, closing, highest and lowest point that a price attained.
Candlestick patterns such as hammer, doji, morning and evening star and the host of other can give a trader further detailed information of the price action.
It can be easily understood even by a newbie, a newbie would rather start off learning with candle stick that trying to learn using another kind of chart.
It can give you a clear signal for entry and exit in the market.

Describe a bullish and a bearish candle. Also explain its anatomy.
Bullish Candles.
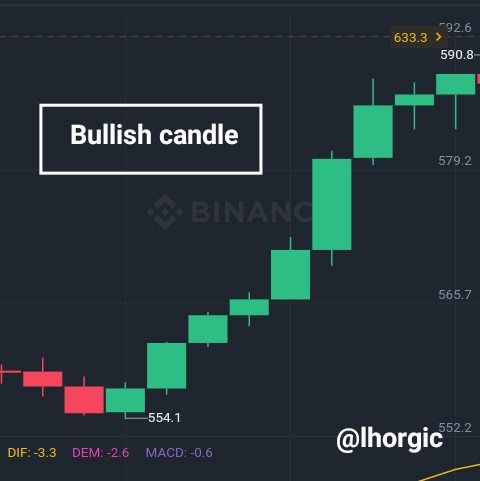
The bullish candles are the green candle and the message it passes across when you see it on the chart is that price is increasing and you will always see it moving in an upward direction. A wise trader who had bought at a point and then realized based on the chart that there is an increase (based on the green candles following each other in succession) will sell so that he can make profit from what he bought initially. The idea about trading is buy low and sell high.
Anatomy of a bullish candle.
- High : this mean the highest price an asset was sold at a particular period of time
- Open: this is the rate/price at which an asset traded with when it opened initially at a particular period
- Body: this is what I consider as the main price action, this is where most buying and selling took place
- Close: this is the price at which a particular asset close at a particular time before another opened
- Low: this is the lowest price at which an asset was bought at a particular period of time.

Note: bullish candle opens from below and then closes at the top
Bearish Candle
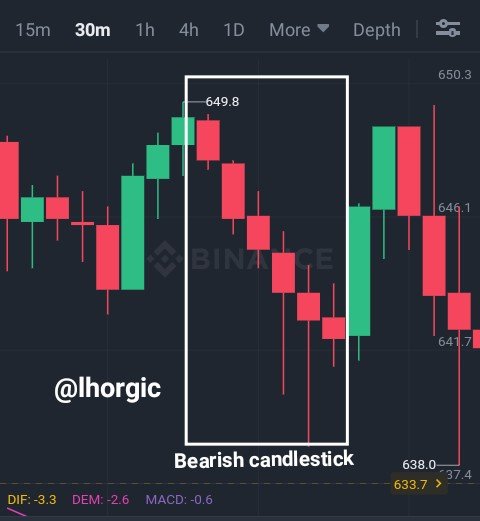
You can call the bearish candle the direct opposite of the bullish candle, they are the red candles you see on the chart and the messages it passes across when seen on the chart in succession is that price or value of an asset is falling or decreasing. Well a trader can benefit from this by allowing it to fall to the bearest minimum and then buy in order to sell at a profit later on. And on the other hand any trader holding a particular asset should sell when he start seeing signals of a bearish trend.
Anatomy of a bullish candle
The bearish candle like the bullish also has five main component and they are ;
- High : this indicates the highest price at a particular period
- Open: this is the price at which a price movement started with at a particular period.
- Body: this is where major activities took place such as buying and selling till there was a close
- Close: this is the price the asset closed at the end of a particular period before another opened
- Low: this is the lowest price at which which as asset traded at a particular period of time.
See my screenshot below ( online shot of a bullish candle anatomy)
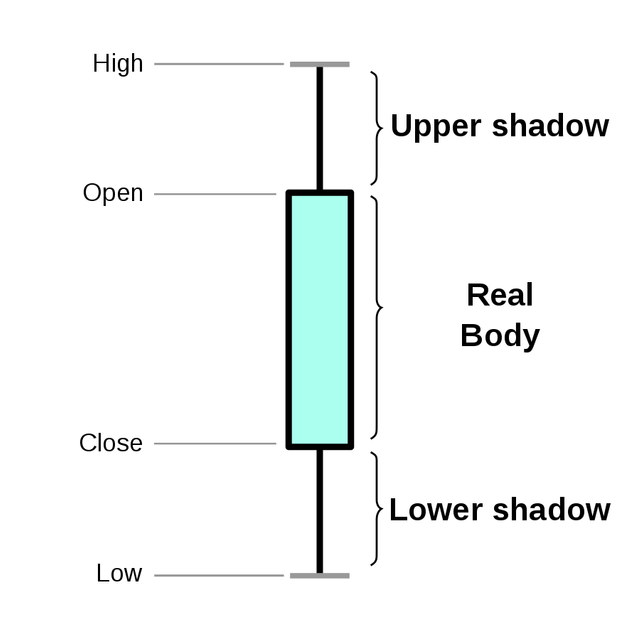
Note: bearish candle opens from above and then closes below

Conclusion
Learning to study the movement of price is very important if you must be successful in your trading Endeavour. Candlestick is a very good place to start as it can help you get a very solid foundation in studying price action. Thanks to it founder who did a good job that we are all enjoying from today.
Thanks so much for the lessons @reminiscence01 and to @dilchamo who has been an awesome prof.
#club5050

Regards:
@lhorgic
#club5050 😀
Downvoting a post can decrease pending rewards and make it less visible. Common reasons:
Submit