
Edited with Canva

Hi all Steemit Crypto Academy Season 5 friends.
How are you all friends? May you always be healthy and happy, happy to see you again and especially to Prof. Who has tried hard to always give us valuable lessons about every lesson taught. And for this time I will be a student of Prof. @kouba01, I hope I can answer all the assignments you give and add to my knowledge about the ATR Indicator.

ATR INDICATOR

1.Discuss your understanding of the ATR indicator and how it is calculated? Give a clear example of calculation

Every cryptocurrency trader wants to make sure that what he is trying to do is profitable and away from losses so that various efforts are made so that all these things can be realized. In addition to the need for sharp analysis in assessing a trade, knowledge of crypto, then a trader should also need indicators to find out the appropriate information needed.
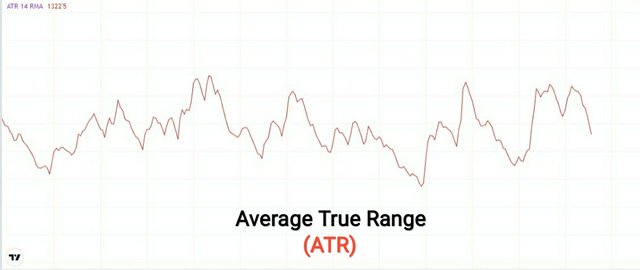
There are so many indicators that can be used to fulfill goals in cryptocurrency trading, but there is a stock market indicator that is very widely used and in demand, namely the ATR (Average True Range) indicator. This indicator is very often used as an excuse by stock traders in setting take profit and stop loss levels than what stock traders usually do to set buy/cell orders. So we can conclude that the ATR indicator is used as a indicator of market volatility in market movements.
It's great for me as a beginner in Crypto trading to know more about indicators that show market volatility because it's very important to know them too because beginners like me will need this knowledge someday.


To calculate the ATR indicator we must first understand how this formula can show us significant market movements so that we can make trading decisions correctly.
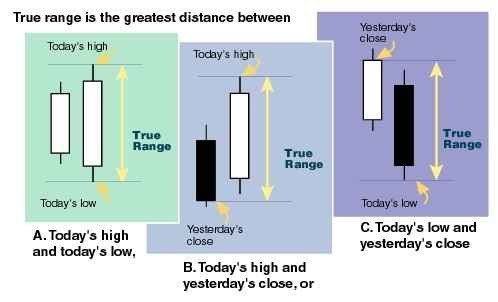
The main thing that we can look at before starting trading activity is to see how the Candlestick is formed so that we can measure the moving average of the market, and Prof. @kouba01 has explained that usually this Indicator is done through one of the three methods available.
- Method 1: current high is lower than current low
- Method 2: current high is lower than previous close(absolute)
- Method 3: current low is lower than previous close (absolute)
To calculate ATR we also need to choose the period we want, but period 14 is the period that is often used.
- current ATR= ((previous ATR*13+current TR))/14
And before we calculate the current ATR, we must first know the TR;
- TR = max ((high - low)(high - previous close), (previous close-low))
After knowing and understanding the formula, let's calculate the value of the two formulas.
Height: 9.5
Low : 4.5
Close: 8.6
Previous ATR : 11.5
TR = max((9.5 - 4.5),(9.5 - 8.5),(8.5-4.5))
TR= max((5),(1),(4))
TR= 5Current ATR= ((11.5x13+5))/14
Current ATR= ((149.5+5))/14
Current ATR= 154.5/14
Current ATR= 11.035
After knowing the current ATR that has been calculated above, it is clear that it shows a decrease in volatility.

2.What do you think is the best setting of the ATR indicator period?

From what I learned through this course, the period is one of the most decisive things about smoothness in using the ATR indicator, where each period will give a different ATR signal, the higher the value of the period we use, the smoother the ATR signal will be. generated, and vice versa, the lower the value of the period used, the more sensitive the resulting ATR signal.
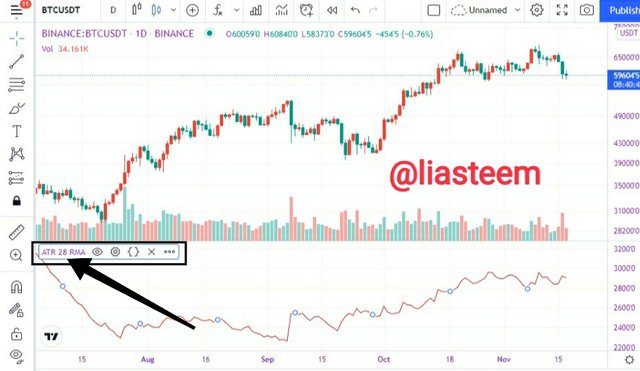
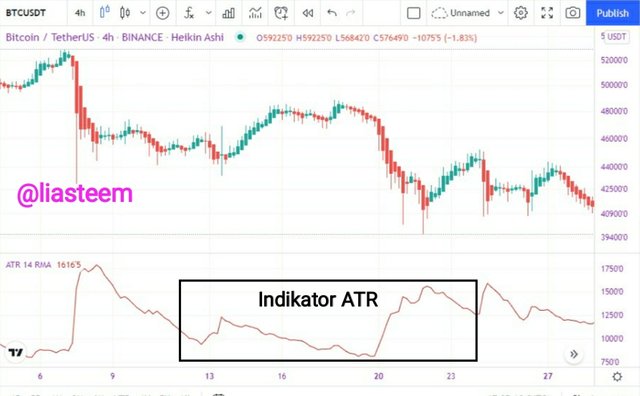
Period 14 is a period that is commonly used by beginners like me, this period provides quite good and almost accurate signals, but in some cases or periods it is used according to the needs and style of traders. Take a look at some examples of period 7, 14, and period 28 that I did.
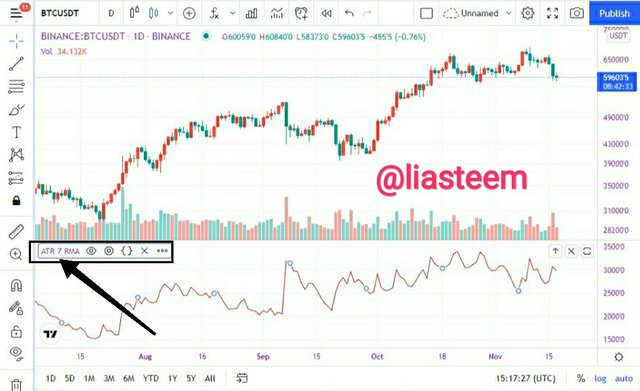
Period 7
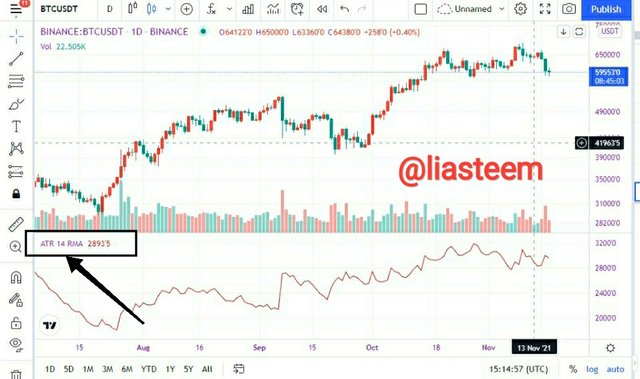
Period 14
Period 28
The three pictures with each period show that there are differences that radiate from the given signal and this gives us the knowledge that the period will provide us with important information to know the actual market movement.

3.How to read the ATR indicator? And is it better to read it alone or with other tools? If so, show the importance. (Screenshot required)

Reading the ATR indicator is very easy because ATR is also an indicator, and the indicator serves to analyze and measure market volatility just like the indicator we are studying.
- We can spot high market volatility when we see a wider candlestick body leading to a larger/upper ATR value.
- we can tell low market volatility when we see the body of the candlestick is also smaller which leads to a smaller/downward ATR value.
Both types of market volatility can be calculated from the formula that has been given and we studied above, so that it will produce a more accurate value of market volatility.
It is not wrong if we only use one indicator to perform and understand market movements, because each indicator has its benefits, but we never know when a market reversal occurs which causes wrong analysis and incorrect confirmation of volatility according to the strength of the stock's momentum or not when we want to trade.
Therefore, the use of more than one indicator will be very helpful in determining the decision to make a trade. This will really help improve a more accurate reading of market movements and will certainly make us more profitable from every side, especially beginners like me. And the ATR indicator will be more accurate if it is paired with an indicator that has a function in communicating the same volatility value.
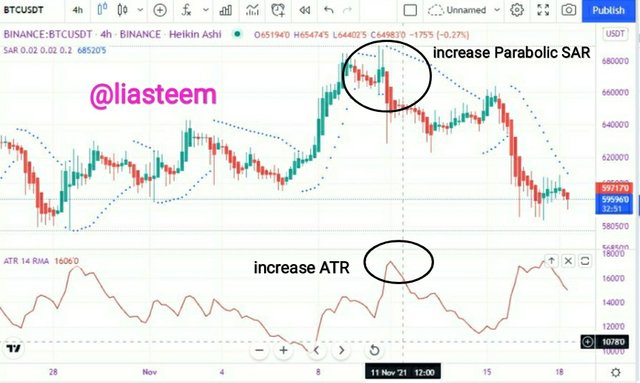
Parabolic SAR, is one indicator that is very suitable to be paired with the ATR indicator which has almost similar properties and this indicator was also created by the maker of the ATR indicator, Welles Wilder. However, this ATR indicator can also be paired with other indicators such as CCI, etc. which aims to find out more precise price levels.
In the chart above we can see that the ATR indicator shows high price volatility with the wick rising upwards, and with the Parabolic SAR indicator we see that there was a price spike happening right away. This means that these two indicators show each other volatilehigh market price and this will be very accurate and help traders in placing stop loss and take profit.

4.How to know the price volatility and how one can determine the dominant price force using the ATR indicator? (Screenshot required)

We can find out price volatility, one way is to use this ATR indicator where we will be very easy to find out through an increase in the ATR value where if it moves up the ATR value will also be high, and if it moves down the ATR value will also decrease. And we need to know that the ATR value will immediately change when it reaches the minimum value.
Look at the chart above, where ATR is very easy to read with a chart, there we can see the points where volatility occurs. As it should be, if the market movement continues to increase, the ATR indicator will provide high market volatility with a signal line moving upwards, and if the market movement continues to decline and this is usually the start of bearishness, then the ATR indicator will provide high market volatility. low with a signal line moving downwards and is usually the start of a bullish one.
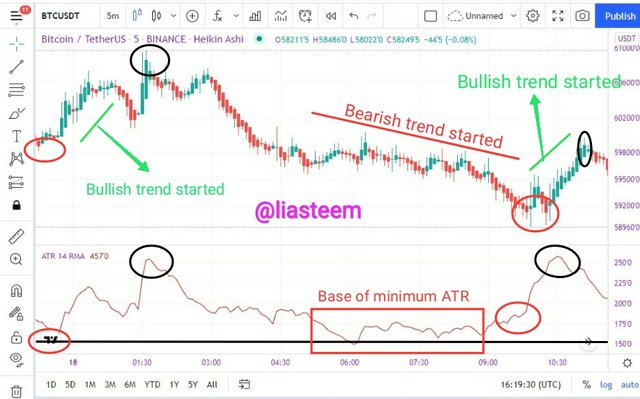
Look at the chart again where Bitcoin/TetherUS on the 5 minute timeframe, and period 14 provides very significant information about the occurrence of market volatility.
On the black circle there is market volatility where we also see that the ATR experienced a significant increase which started a bearish trend, while the red circle also experienced low market volatility which is usually indicated by a bullish trend. The chart also shows that when ATR returns to its minimum value, ATR will increase again, which indicates the end of the bearish trend and a bullish trend is in progress.
Well, from the chart above we can also conclude that if market volatility has spiked, then ATR will be too, and if market volatility has decreased, then ATR will be too, this means that market volatility is a sign of a trend reversal.


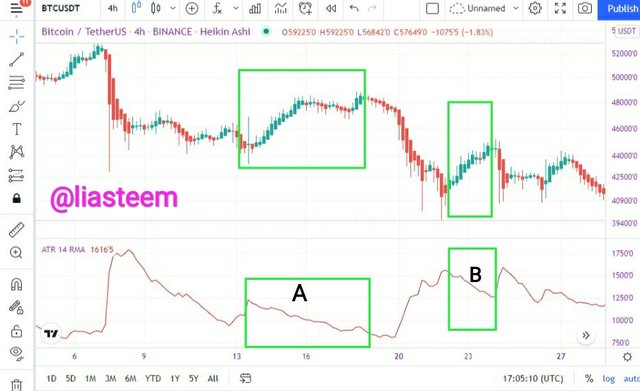
To get accurate information in trading using the ATR indicator, it must be directly proportional to the market movements that occur so that we can determine the dominant strength.
In the graphic above, the green box is when the trend is up or when an uptrend is occurring, which is a bullish phase, but the price volatility that occurs in the ATR indicator (A, B) is inversely proportional to the indicator line moving downwards which indicates a decline. price, it can be concluded that the upward movement of the market is not in accordance with the dominant power in the price.
Don't we see market movements that occur like a clear market trap? We can only find out with the ATR indicator that we use, just imagine if a beginner like me, or a fairly experienced trader only relies on candlestick movements. Now, to see the dominant price here, we can see the volatility movement of the ATR indicator.
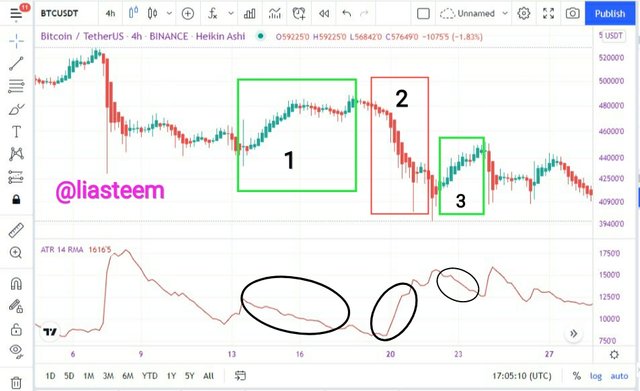
In the chart above we can see that the value of BTCUSDT in boxes 1 and 3 is increasing, but the ATR indicator shows that the market is moving downwards, which means they are inversely proportional to the dominant force at the current market price.
However, in the red box number 2, we can see that the ATR indicator rose sharply upwards which caused an increase in the ATR value, thus indicating price volatility from bearish to bullish which became strong.tan dominant price at that time.
In cases like this, we have to look at the chart well and compare it with the ATR indicator so that we will be accurate in assigning the dominant strength of the market price to the asset pair that we are doing, so we don't have to be afraid to place a trade.

5.How to use the ATR indicator to manage trading risk ?(screenshot required)

Trading risk is one thing that is avoided by market traders, anyone does not want to lose and fall into poverty, all traders want big or even very large profits.
Well, we can manage this trading risk by using the ATR indicator where we use the ATR indicator to place Stop Loss and use the ATR indicator to place Take Profit.
- Stop Loss
Stop Loss is one of the important things that must be considered and should not be ignored, because if you ignore it then in an instant we will lose everything and nothing is left. Well, Stop Loss is a very necessary action because we never know how the market will move in an hour or even a minute in the future.
By setting ATR as the indicator of our choice will be very helpful for us in setting Stop Loss because ATR is an indicator that works for it.
The formula used is as follows;
- Entrance price +/- ATR value
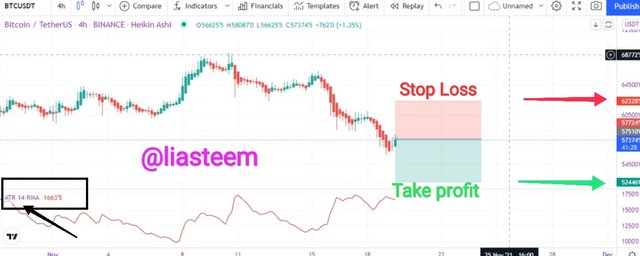
For example I assume I have a selling Entry price for BTCUSDT currently is $57367 and the current ATR value is 1653. So now I will calculate the point where I will place my stop loss from the above formula;
- $57367 + (3 x 1653)
Stoploss = $62326
It is at the price of $62326 that I will place a stop loss. And you can see that the minimum value of the market price has been reached and it is possible that a bullish start will occur but we also cannot deny that the bearish phase has not ended and will continue to fall down and we can see price volatility on the ATR indicator which is also moving decrease.
- Take profit
Unlike the case with stop loss, which we do to avoid losses, but at this time we will do anything to get multiple profits, and for beginners like me it is highly recommended to take a ratio of the two to 1:1.
The ATR indicator is very helpful in maintaining the current market price range. This is one of our efforts to monitor the profit we want and the best step so that we don't lose money in trading is to determine the take profit level.
And I calculated the take profit with the formula described earlier;
- Take profit = $57367 -( 3 x 1653)
Take profit = $52408
And I set my Take Profit at $52408 and I don't have to be dizzy and awake to keep monitoring the market price. It is possible that the price will go down at the take profit price that we have placed, and when the market movement suddenly reverses direction, then we have made the profit we wanted, and the ATR indicator is one of the great indicators that maintains risk in the market.

6.How does this indicator allow us to highlight the strength of a trend and identify any signs of change in the trend itself? (Screenshot required)

As we know that the main function of the ATR indicator is to measure the level of price volatility, but by using this ATR indicator we can also determine the strength of a trend with support and resistance which will show the movement of assets formed by market traders. And both of these benefits we can take as an action to identify the strength of the trend.
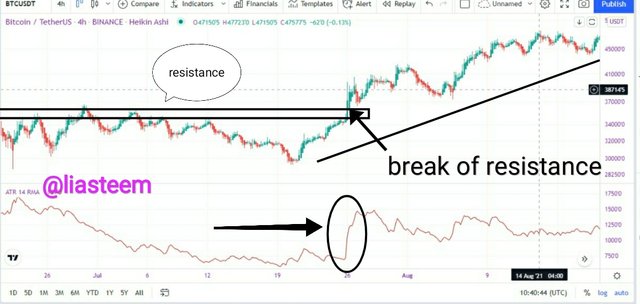
A market trend is created by the injection of traders into market supply and demand, which makes support and resistance lines occur. If the support line is broken it shows tThe ren falls very low and maybe for a little while, and if the resistance line is broken, then on the contrary the trend will show an uptrend and it could even be a very large price increase.
From the chart above we can see that the uptrend is valid with a given ATR volume, there we see the price breaking through the resistance and continuing to rise for a long time due to the dominant force by the market buyers.


If the ATR indicator will determine the strength of the trend, the ATR indicator also gives us information when a trend reversal occurs very easily. When an uptrend is occurring, the ATR will show an increase in volume, and a large market price, but if suddenly the ATR volume decreases and moves towards a downtrend and moves back into an uptrend, then we can consider that there is an uptrend reversal from ATR and vice versa.
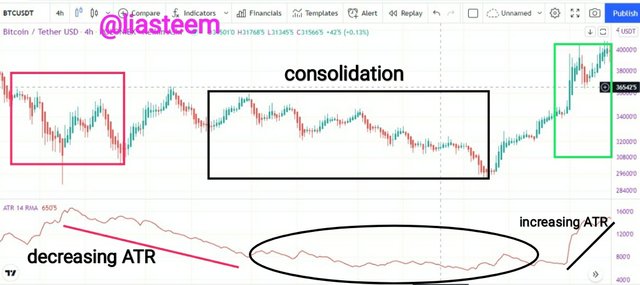
From the chart above we can see that the price is moving and there we see that there is a consolidation which means that the market pressure for buyers and sellers has worn off and is starting to make new decisions in placing orders.
From the chart above, we also see that after the consolidation phase occurred and after that the trend started to rise and this trend was confirmed by the ATR indicator which showed volume was increasing upwards, and a few moments later the ATR value decreased and decreased which caused the market trend to also go in a bearish direction.


Advantages
- ATR indicator is one of the very easy to read indicators with charts
- The ATR indicator provides the right direction of volatility so that it will be easier for us to place a clear stop loss and Take Profit so as to minimize the occurrence of losses.
- The ATR indicator can be paired with any indicator which will help improve more precise market volatility information.
- ATR indication is very simple and very suitable for use on any time frame, any period and of course according to our trading needs.
Disadvantages
- Because the indicator only focuses on measuring market volatility, it does not provide a continuation of a trend so it will be very difficult to analyze the movement of the trend.
- The ATR indicator does not have a single value so it cannot provide the movement of a trend so it requires other indicators to make market movement information more accurate.

8.Conclusion

The ATR indicator is one indicator that measures market volatility. This indicator is very often used as an excuse by stock traders in setting take profit and stop loss levels than what stock traders usually do to set buy/cell orders. So we can conclude that the ATR indicator is used as a indicator of market volatility in market movements.
It's great for me as a beginner in Crypto trading to know more about indicators that show market volatility because it's very important to know them too because beginners like me will need this knowledge someday. This ATR indicator is also very suitable to be paired with other indicators so as to provide more accurate information.

Many thanks to Prof. @kouba01 who has given a very useful lecture for me as a beginner. I can find out more about the ATR indicator. If there is an error in my writing and explanation above, please be willing, Prof. Check it out.
I am very happy to follow the lectures of Prof.
Many thanks to Prof. @kouba01
Thanks also to all crypto students
Thanks also to all Steemians
From your friend,
❤️❤️❤️
.png)
Hello @liasteem,
Thank you for participating in the 1st Week Crypto Course in its 5th season and for your efforts to complete the suggested tasks, you deserve a Total|8/10 rating, according to the following scale:
My review :
Work with good content, because you have taken every question seriously, allowing you to get answers that are precise and in-depth in its analysis and clear in its methodology. And here some notes :
A good interpretation of the ATR indicator, it was possible to rely on a graph to confirm the results obtained in calculating the value of the indicator at the instant t.
It would have been possible to go in more depth to explain the difference between an increase or decrease in the value of a period and to have clearly stated your personal choice.
Your answer to the third question was clear and successful.
You did well to answer the rest of questions.
Thanks again for your effort, and we look forward to reading your next work.
Sincerely,@kouba01
Downvoting a post can decrease pending rewards and make it less visible. Common reasons:
Submit
Thanks you very much Prof.
😇🤗
Downvoting a post can decrease pending rewards and make it less visible. Common reasons:
Submit