Edited with Canva
Hi all Steemit Crypto Academy Season 5 friends.
How are you all friends? May you always be healthy and happy, happy to see you again and especially to Prof. Who has tried hard to always give us valuable lessons about every lesson taught. And for this time I will be a student of Prof. @fredquantum, I hope I can answer all the assignments you give and add to my knowledge about the Aroon Indicator.

AROON INDICATOR

1. What is Aroon Indicator in your own words? What are Aroon-Up and Aroon-Down? (Show them on Charts)

Each indicator has different capabilities and functions. And on this occasion I am very happy because I will learn about the technical indicators used to measure the price behavior of an asset in a certain period, namely Aroon Indicator. This will really help market users to get the desired profit and results, but beginners like me are highly recommended to take a 1:1 ratio between Stop Loss and Take Profit.
The Aroon indicator is an indicator that serves to identify the presence of a trend, change in trend, and measure the strength of the trend. All of these market movements will greatly help market users at a certain period which will provide more accurate and complete information.
The Aroon indicator was first created by a financial manager from India, namely Tushar Chande. The Aroon indicator is taken from Sanskrit which means first light, the purpose of which this indicator is designed is to provide information on the initial movement of a market. The Aroon indicator was created in 1995.
What are Aroon-Up and Aroon-Down? (Show them on Chart)
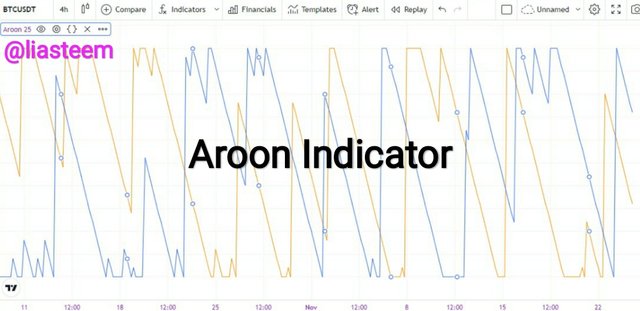
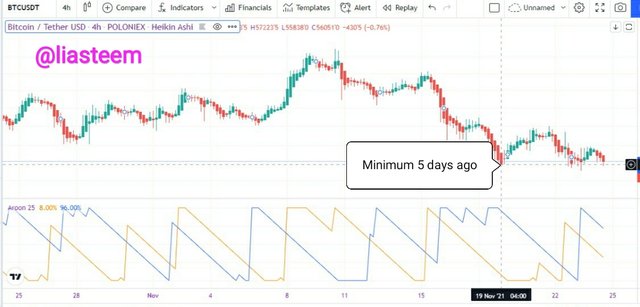
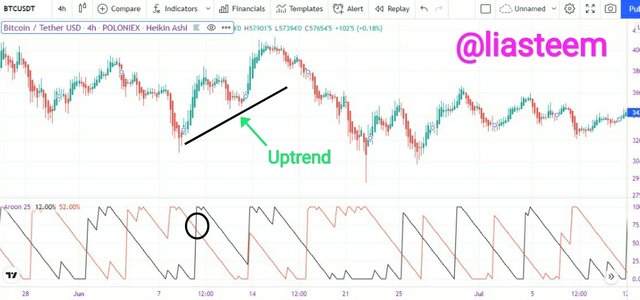
The Aroon indicator is formed from the movement of two lines, namely the Aroon Up line which charts the highest days of the last 25 days, and the Aroon Down which charts the lowest days of the previous 25 days, each chart showing a bullish trend and a trend. bearish on a scale of 0-100, but there is also a single line used to measure market movement on a scale (100 and -100).
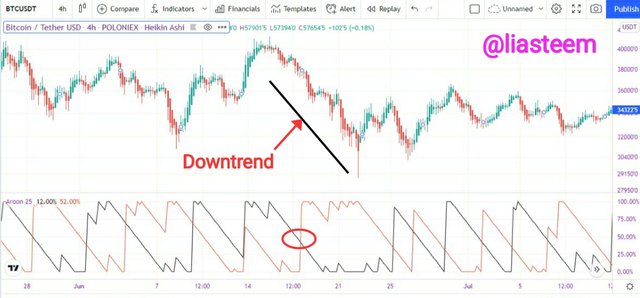
The Aroon Up and Aroon Down indicator lines represent rising market trends and declining market trends, as usual if the Aroon indicator line is soaring high then the market trend is increasing or called the Aroon Up indicator, while the Aroon indicator line is down, the market trend is moderate. experienced a decline called the Aroon Down indicator.
The two lines of the Aroon indicator are very useful and very easy to read on the chart because they have two lines that will clarify which direction the market is moving, making it easier for traders to trade whether to sell or buy.
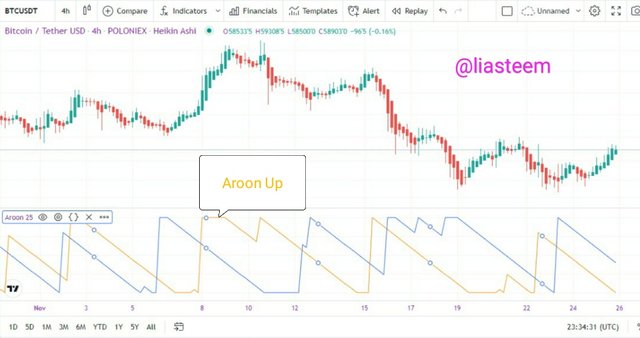
- Aroon Up Indicator
In the chart above, we can clearly see that the Aroon Up indicator line is yellow and measures the movement of the rising market trend on a scale of 0-100.
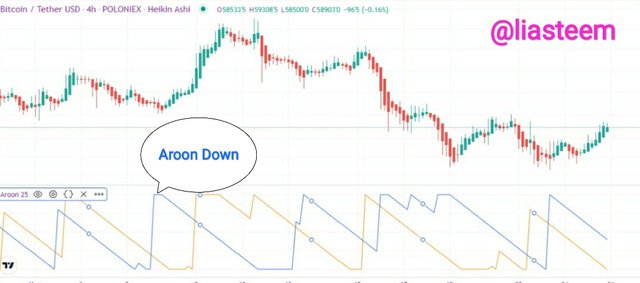
- Aroon Down Indicator
In the chart below, the line of the Aroon Down indicator is blue and measures the movement of the declining market trend on a scale of 0-100.

2.How is Aroon-Up/Aroon-Down calculated? (Give an illustrative example).!

There is a formula to calculate the two lines of the Aroon indicator so that we can analyze the movement of the market trend properly as below in period 25.
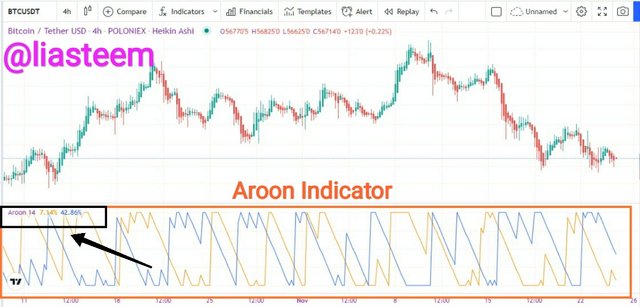
Aroon Indicator
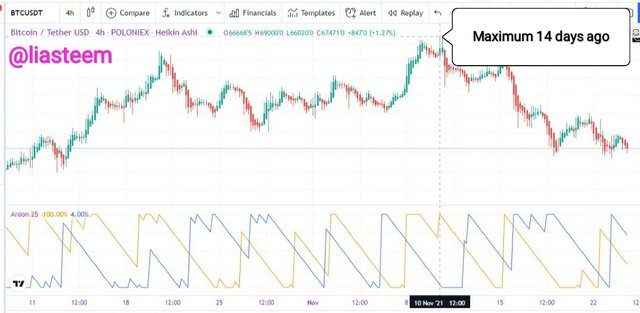
- Aroon Up = (25 - Number of Periods Since the Recent 25 Period High/25) x 100
Aroon Up = (25 - 14/25) x 100
Aroon Up = (11/25) x 100
Aroon Up = 0.44 x 100
Aroon Up = 44
TradingView
Aroon Down = (25 - Number of Periods Since the Recent 25 Period Low/25) x 100
Aroon Down = (25 - 5/25) x 100
Aroon Down = (20/25) x 100
Aroon Down = 0.80 x 100
Aroon Down = 80When the Aroon Up line approaches 100 and the Aroon Down line approaches 0 then the market movement is in a Bullish trend.
When the lines of the Aroon indicator are in a parallel direction, the trend is undergoing a ranged consolidation.
When the Aroon indicator line is below 50 it can identify the next trend direction.
When the Aroon indicator line is close to 100, it could be a long market trend movement so the asset becomes overbought or oversould
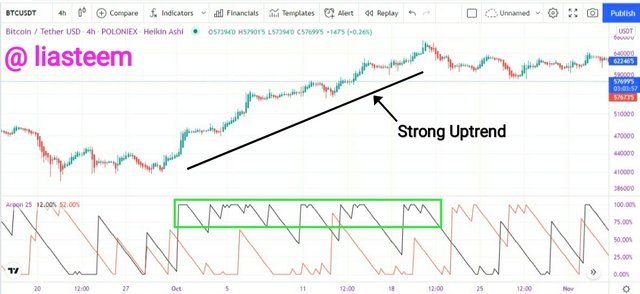
When the Aroon indicator line feels above the 70-100 number, the market is trendingcurrently strong.
When the trend line is below 30 or below, the current market trend is weak.

3.Show the Steps involved in the Setting Up Aroon indicator on the chart and show different settings. (Screenshots required).

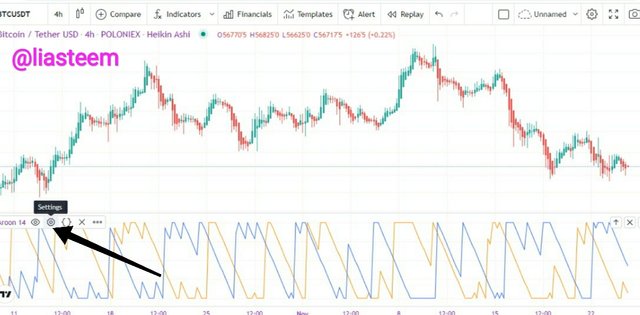
There are several steps that we can take to add this Aroon indicator in the chart chart, and I will describe them as follows.
- Step 1
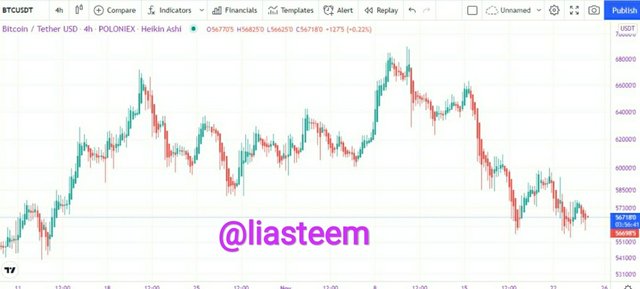
Visit the TradingView and select the Chart option, then a graph will appear as below.
- Step 2
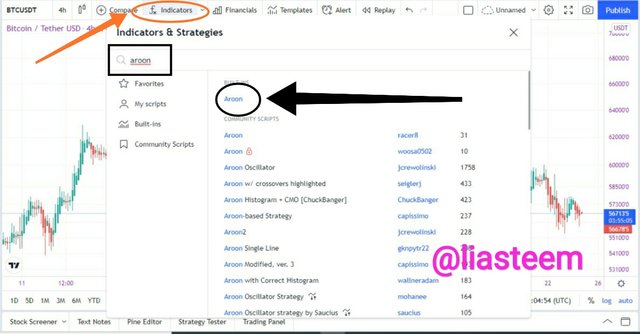
Select the fx icon which is the symbol of the indicator settings, and type in the Aroon indicator. Just click it once, because if we double click it will bring out the same two indicator charts, then the chart will appear as below.
- Step 3
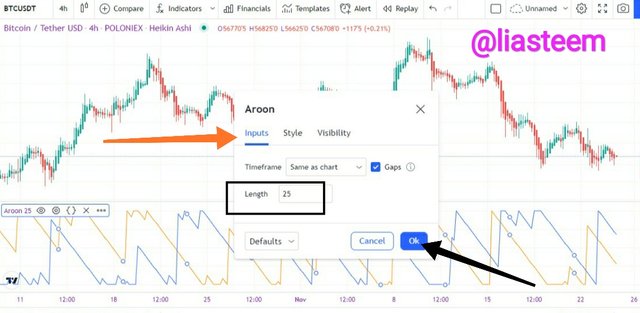
We will set the period of the indicator, then we click the icon like a bolt which indicates that the setting of the indicator, then a chart display will appear as below
Select the length option as desired, and I set it to 25 as suggested which is the form of the period.
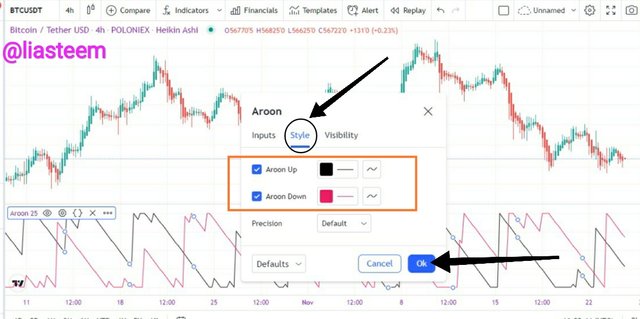
I also changed the color of the Aroon indicator line by selecting the style option, there are already colors from both indicators and I set the color for Aroon Up to be black and Aroon Down to be red with a horizontal straight line.
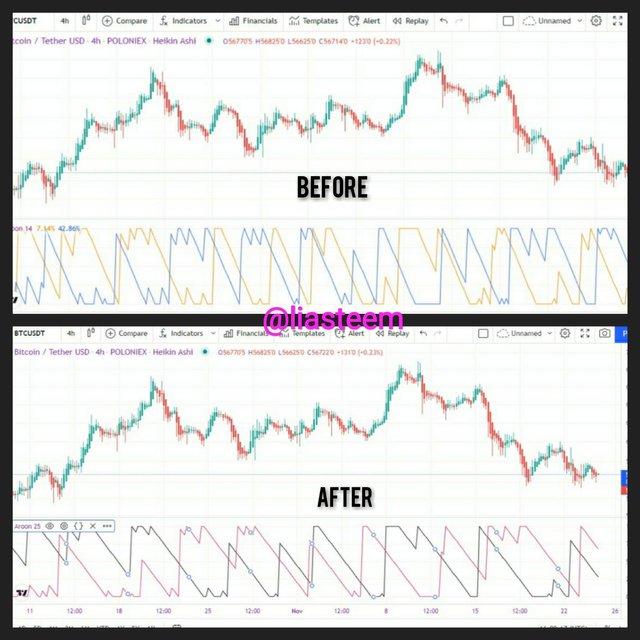
After all the steps above we have done, then you can see the difference between the chart before and after the Aroon indicator is changed. We can change the period to 10, 20, etc., but it is highly recommended that we set the period to 25.

4.What is your understanding of the Aroon Oscillator? How does it work? (Show it on the chart, kindly skip the steps involved in adding it).

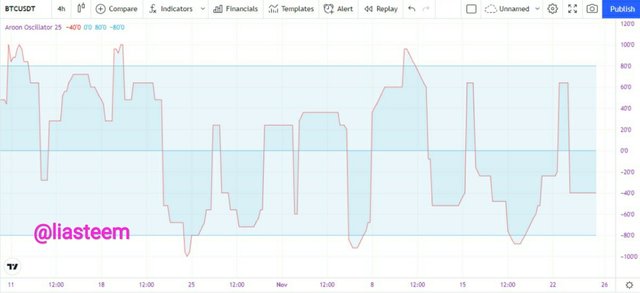
The Aroon Oscillator is a technical indicator that signals the occurrence or non-occurrence of a strong trend which will regularly signal new trend highs, and signals the occurrence or non-occurrence of a weak trend which will regularly signal new trend lows in 25 years. final. This Aroon Oscillator indicator is used to identify asset movements, strong and weak trend movements using Aroon Up and Aroon Down aspects.
In the chart above we can see that the BTCUSDT asset is moving downwards or the Aroon Up Oscillator crossed the Aroon Oscillator Down line which is the beginning of a bullish phase and we can place a buy position and cross the 70 scale which identifies a strong trend movement.
By looking at the Aroon indicator on the BTCUSDT chart, we will also find a very strong and lasting trend movement that will even run in the long term. On the Aroon indicator, we can see the Aroon Up signal line is on the 100 scale for a long time which indicates to us that the trend is very strong and lasting.
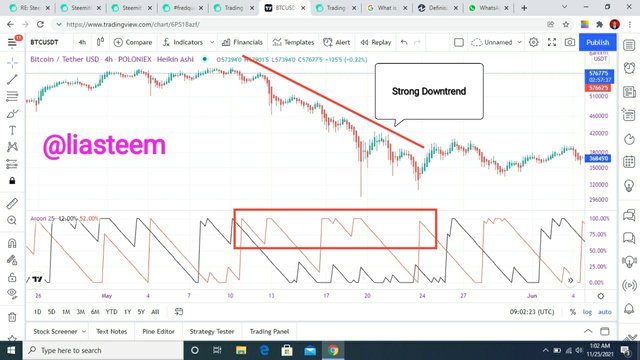
Just as we can find a long uptrend on the Aroon indicator chart, so we can also find a long downtrend signaled by Aroon Down where the red line is an Aroon Down signal and stretches long before a trend reversal occurs.
If the Aroon Oscillator line moves above zero, it identifies an uptrend, and conversely if the Aroon Oscillator line moves below zero, it identifies a downtrend, not just p.trend movement on the zero line but also movement of the Aroon Oscillator line above 50 up or 50 down which identifies a large market price movement.
The significant change given by the direction of the Aroon Oscillator moving without Aroon Up and Aroon Down can be seen from the displayed chart which can identify new trends.
How does it work?
- Buy Signal
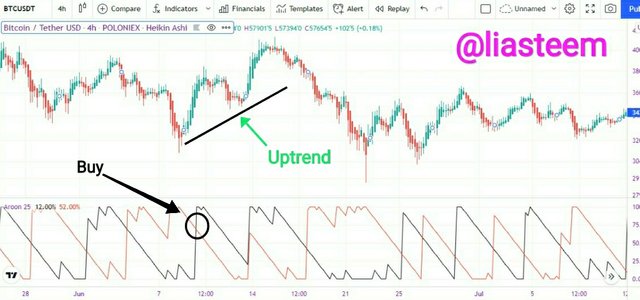
In opening a buy position, we can see that Aroon Down has been above Aroon Up for a long time, and if we see Aroon Up changing direction at some point and continuously increasing until it crosses Aroon Down, this is where we can see that the trend is undergoing a significant change. significant and usually the market trend will continue to increase for a long time, until at the current position, we can place a position on a buy signal.
There is also an uptrend that occurs for a while which also has the same identification as a long uptrend as above, it's just that in an uptrend like this, the signal given will change at one point in the not too distant future.
- ** Sell Signals**
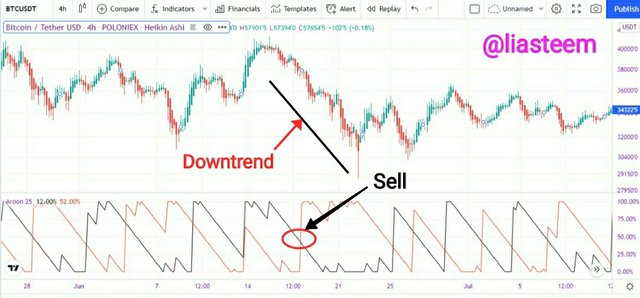
In opening a short position, we can see that Aroon Up has been above Aroon Down for a long time, and if we see Aroon Down changing direction at some point and continues to increase until it crosses Aroon Up, this is where we can see that the trend is undergoing a significant change. significant and usually the market trend will continue to decline for a long time, until at the current position, we can place a position on a sell signal.
There is also a downtrend that occurs for a while which also has the same identification as a long downtrend as above, it's just that in a downtrend like this, the signal given will change at one point in the not too distant future.

5.Consider an Aroon Indicator with a single oscillating line, what does the measurement of the trend at +50 and -50 signify?

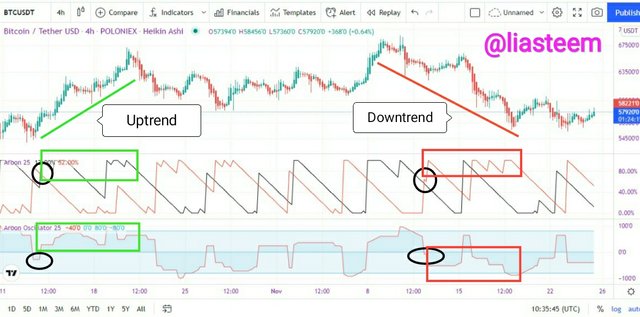
As I said above, the Aroon indicator also has a single oscillating line which makes it easier and simpler to identify bearish and bullish trend signals. The Aroon Oscillator indicator line is also used in conjunction with the Aroon Up and Aroon Down lines to better and more accurately identify and identify trend signals.
In the chart above, we can see that we get accurate information about the market movement that is both bearish and bullish where the bearishness will be confirmed when the Aroon Down line crosses with the Aroon Up, while the single line indicator Aroon can confirm that the line is below -50. While Bullish looks confirmed from the Aroon single line which is above the 50 scale and also Aroon Up which crosses with Aroon Down.
What does the measurement of the trend at +50 and -50 signify?
As I said on the occasion above that the trend line at +50 and -50 is a trend line that simplifies and makes it easier for traders to identify market price movements whether they are in a bullish or bearish phase.
If the trend line is at +50 and continues to increase then this indicates a strong and prolonged Bullish phase which is an uptrend, whereas if the trend line is at -50 and continues then this identifies a declining and weak bearish phase which is a downtrend.

6.Explain Aroon Indicator movement in Range Markets. (Screenshots required).

The Aroon indicator is very easy to see on the chart and has Aroon Up and Aroon Down lines crossing each other which identify the movement of the market trend in a bearish or bullish position. Not only that, the Aroon Indicator also functions to identify when there is no market trend. This is very helpful for traders to observe the direction of the market trend movement.
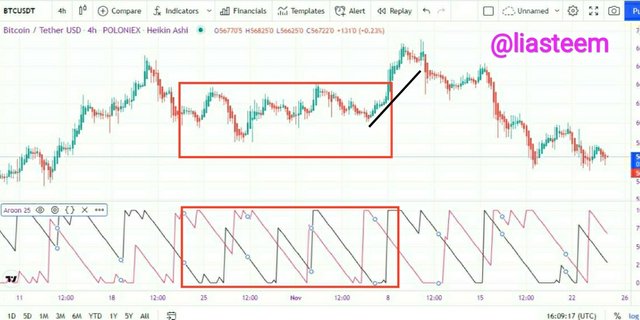
The movement of the Aroon indicator in the market range will give the Aroon Up and Aroon Down lines that cross but are not strong for some time and will move again following the asset injection by traders where the indicator line will cross with a large movement and give the market movement in the next direction ( bearish or bullish).
In the chart above we can clearly see that the asset initially experienced a bullish phase whichstrong and then there is a downward trend movement and it moves horizontally and we can see that the asset is starting to consolidate and this movement can be identified with the Aroon indicator.

7.Does Aroon Indicator give False and Late signals? . Show false and late signals of the Aroon Indicator on the chart. Combine an indicator (other than RSI) with the Aroon indicator to filter late and false signals. (Screenshots required).

The Aroon Indicator is an indicator, where each indicator must have its advantages and disadvantages, and because of this weakness, the Aroon indicator is not fully effective and of course there will be times when the Aroon indicator will give false/late signals and make this indicator unable to become one. the only indicator that we will use in trading, like other indicators it is also highly recommended to be paired with other technical indicators.
- False Signal
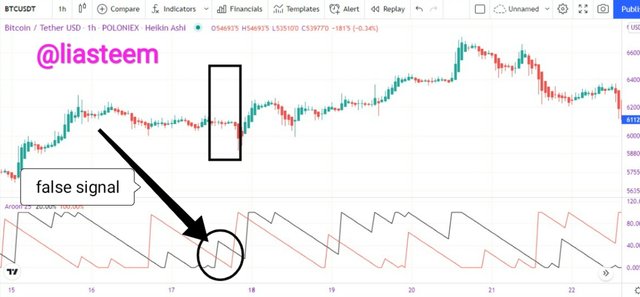
In the chart above, we can see that the Aroon Up line crosses the Aroon Down line which identifies a long position, but in the actual market movement, the market trend continues to decline which is identified as a downtrend phase. It is highly inversely proportional to the market trend and the given line of the Aroon indicator. Therefore, we are required to always be careful in identifying the actual market movements.
- Late Signal
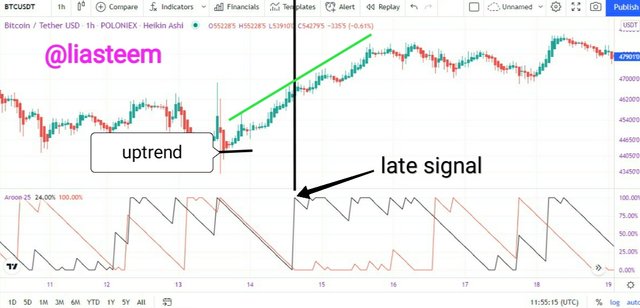
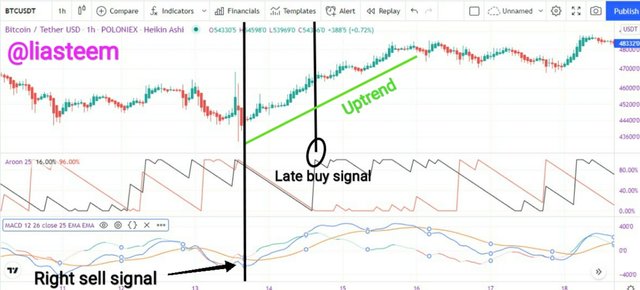
In the chart above, we see the movement of the market trend soaring upwards continuously, but look at the Aroon indicator which gives a late signal in identifying the movement of the trend is still declining and a moment later it identifies the movement of the market trend that is experiencing an increase or an uptrend.
Combine an indicator (other than RSI) with the Aroon indicator to filter late and false signals
- Detect false Aroon indicator signal with MACD indicator
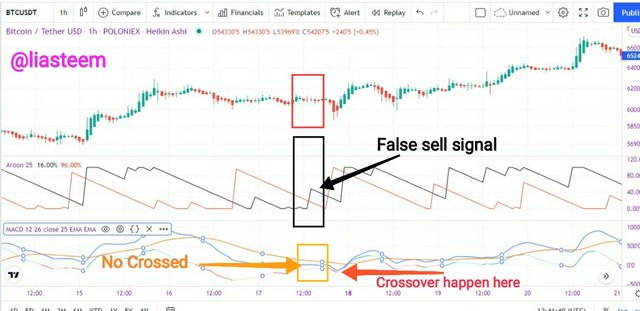
Combining indicators is one of the good things to do to improve trend analysis that is more accurate and precise. And I will pair the Aroon indicator with the MACD indicator which is also able to identify false signals along with the Aroon Indicator.
In the chart above, we can see that I combined the Aroon and MACD indicators to identify a good trend movement, where on the signal line the Aroon indicator shows an uptrend movement, but in fact on the trend line there is no trend movement, or consolidation is happening. When I added the MACD indicator, it was identified that the Aroon indicator gave the wrong uptrend signal.
- Detect late Aroon indicator signal with MACD indicator
One of the reasons for combining the Aroon indicator and MACD indicator is to identify late trend movements so that it will reduce errors in analyzing the current trend.

8.Place at least one buy and sell trade using the Aroon Indicator with the help of the indicator combined in (7) above. Use a demo account with proper trade management. (Screenshots required).

In placing buy and sell positions we must be careful in trend movements and even trend reversals that can occur suddenly. Each indicator has different benefits and functions that will help traders according to their needs, that's why I use the MACD indicator to pair it with the Aroon indicator which will be able to read trend signals better and more accurately.
- Buy order
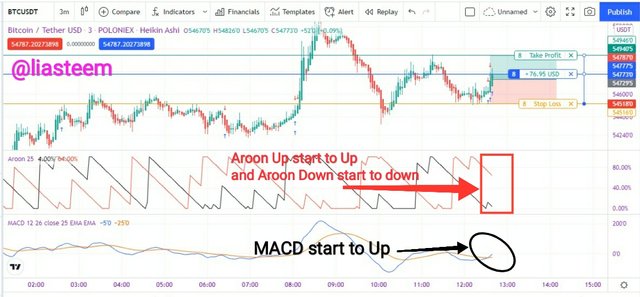
The best position to place a buy order is when the price trend is down and at the right point when we see a market movement that is about to reverse. I use the MACD indicator and the Aroon indicator to place buy positions here in order to identify market movements better and more accurately.
On the cryptocurrency BTCUSDT, I placed a buy order at the entry price of $5472 and I set a Stop Loss at a price of $54518 and a Take Profit at a price of $54787 in 3 minutes with the Aroon indicator and the MACD indicator clearly identifying that the Aroon Down line crosses the Aroon Up and MACD indicator line identifying pemarket movement Yang began to soar up.
I made a profit of up to $ 111 after waiting for a while the price movement decreased until I closed my position and this was all thanks to the Aroon and MACD indicators which identify price trend movements well and accurately.
- Sell Order
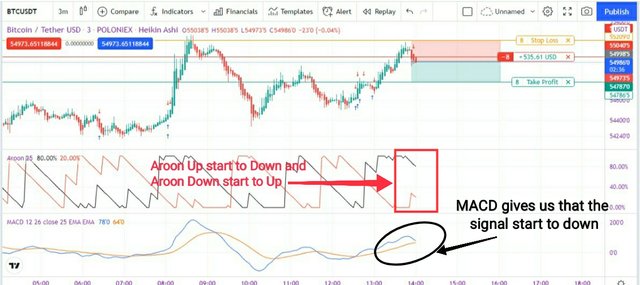
In placing a sell order position, I as a beginner will take Take Profit and Stop Loss at 1:1. I placed stop loss above and take profit below.
In the picture above, I see a cross between Aroon Up and Aroon Down which identifies that the market price will follow the Aroon cross and some time later the Aroon Up line moves down and the Aroon Down line moves up, while both MACD signal lines indicate a downward volume movement. In the picture above I placed a sell position with an entry price of $ 54998 and I placed a take profit at a price of $ 54787 and a Stop Loss at a price of $ 55040.
And the results I get from my trading process are above $ 579 and you can see this in the screenshot above.

9.State the Merits and Demerits of Aroon Indicator.

Merits of Aroon Indicator
- Easy to use and understand for novice traders to see the actual market movements.
- Because it has two indicator lines, Aroon is one indicator that gives almost no false signals.
- Stable because it is on a scale of 0-100.
- Accurately identify any reversal of market movements.
- Gives us good information to place buy and sell positions.
Demerits of Aroon Indicator
- Gives a slightly late signal when there is a reversal of a trend.
- Requires other indicators in trading to prevent false signal readings from being generated and can provide a more accurate identification of market movements.

Conclusions

The Aroon indicator is an indicator that serves to identify the presence of a trend, change in trend, and measure the strength of the trend. All of these market movements will greatly help market users at a certain period which will provide more accurate and complete information.
The Aroon indicator is very easy to use, especially for beginners like me who need a simple and easy to understand indicator, and I believe this is a very useful indicator for traders in identifying market movements.

Many thanks to Prof. @fredquantum who has given us a very useful lecture for me as a beginner. I can find out more about the Aroon indicator. If there is an error in my writing and explanation above, please be willing, Prof. Check it out.
I am very happy to follow the lectures of Prof.
Many thanks to Prof. @fredquantum
Thanks also to all crypto students
Thanks also to all Steemians
From your friends,
❤️❤️❤️
.png)
