


Moving averages are trend-following indicators that are used to determine price movement. Moving averages are formed by determining the average closing prices during a period of time using past price data points. To construct a dynamic line on the chart, the simple moving average takes into consideration the average closing prices of an asset over a period. The simple moving average lags behind the price and responds to unneeded price changes. This results in a lot of noise and erratic signals, which can lead to traders making poor trading decisions.
To gather smooth and clear signal information from the market, the TRIMA indicator was created as an enhanced Simple moving average with an extra weight. The TRIMA indicator is a twice-averaged double-smoothed simple moving average. Unlike the basic moving average, the TRIMA indicator filters noise and reacts less to needless price changes. Traders may get a smooth and clear trading signal this way, allowing them to make smart trading judgments.
The cryptocurrency market is very volatile, with significant and seemingly random price movements. TRIMA is the greatest indicator for filtering out market noise while simultaneously signaling correct trade information.


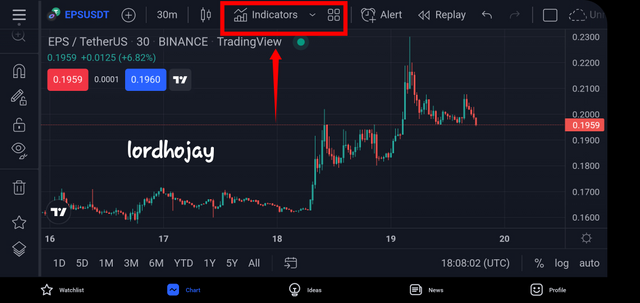
• We can add this indication to the chart by going to the Indicators option in the center of the chart.
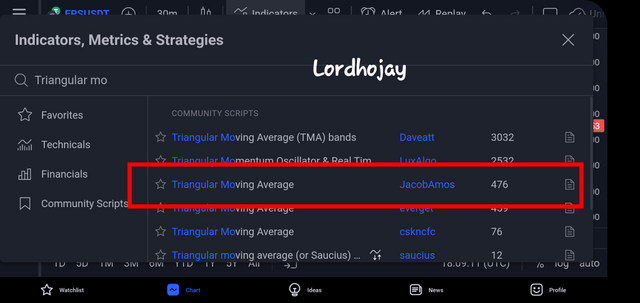
• Search for Triangular Moving Average in the Search field and click on the Traingular Moving Average. as seen in the picture below.
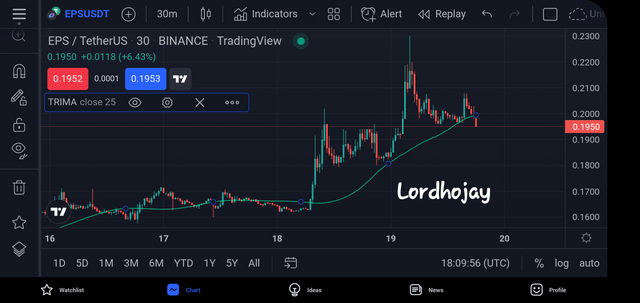
• TRIMA Indicator will be added to the chart when you click it.
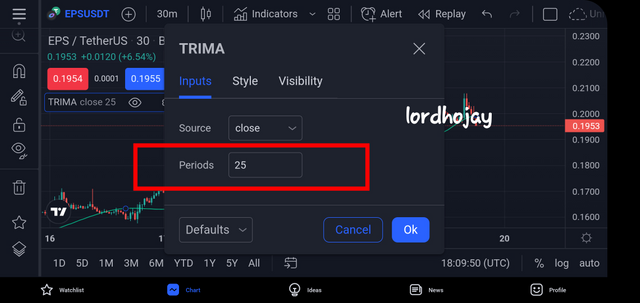
• We may also change the parameters to our liking. We may customize the duration of this indication by selecting the Input option. Its default length is ten. By selecting the Style option, we can also modify the color of the indication.
Calculation of TRIMA Indicator
As I previously indicated, the TRIMA Indicator is a SMA-based indicator that displays the average price over a given time period. So, in order to calculate the TRIMA Indicator, we'll need the SMA value.
So, first, we'll compute SMA, and then we'll plug that number into the TRIMA algorithm.
SMA = (P1 + P2 + P3 + P4 + P5 +......+ Pn)/n
where,
P = Price of crypto asset at particular period
Pn = Price of crypto asset of last period
n = Total no. of periods
Now we'll plug the value of SMA into the TRIMA formula, and we'll be able to quickly compute TRIMA.
TRIMA = (SMA1+ SMA2+ SMA3+ SMA4+ SMA5+....+SMAn)/n


Uptrend
To recognize an uptrend movement with the TRIMA indication, we must ensure that we observed the TRIMA growing in such a manner that the indicator is trending towards the market price, where the market might be traveling above the TRIMA indicator, while the TRIMA is moving below the market price.
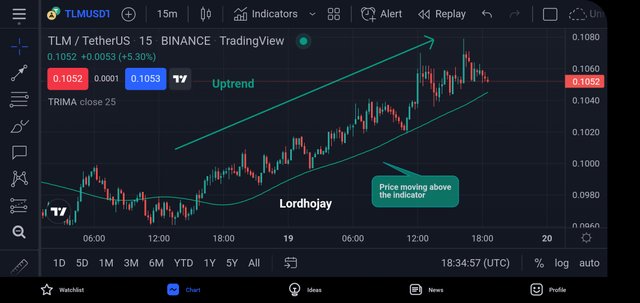
Since can be observed in the figure above, the market is in an uptrend, as the price is moving above the TRIMA indication.
Downtrend
To use the TRIMA indication to detect a downtrend, we must first ensure that the TRIMA indicator is dropping, which in this case means that the market is moving below the TRIMA indicator while the TRIMA is moving above the market price.

As can be observed in the figure above, the market is in a downtrend, and the market is moving below the TRIMA signal.


Support and resistance are crucial levels on the chart where the market is seeing a lot of buying and selling activity. Traders frequently monitor these regions for opportunities to enter and leave the market. Unlike the horizontal support and resistance drawn by linking past highs and lows, this support and resistance is drawn automatically. As pricing circumstances alter, dynamic support and resistance are drawn automatically. As the market condition changes, a trader does not need to draw horizontal lines on the chart.
TRIMA Indicator Support
TRIMA may also be used to find dynamic support and resistance. During a retracement in an uptrend, price finds support on the TRIMA line. After that, the price goes back in the opposite way. This dynamic support might be used as an entry point for a purchase position. Below is an example of dynamic support on the TRIMA indicator.
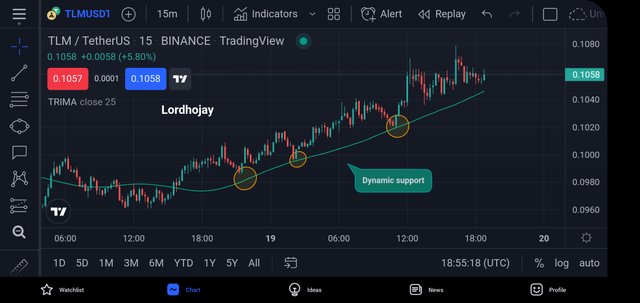
The TRIMA indicator provides as dynamic support to price during an upswing, as shown in the chart above. Take note of how the pricing is rejected when it comes into contact with the TRIMA indication.
TRIMA Indicator Resistance
The TRIMA indicator is also a useful dynamic resistance indicator. During a retracement in a downtrend, price finds resistance on the TRIMA line. After that, the price goes back in the opposite way. This dynamic resistance can be used as an entry point into a sell position. On the TRIMA indicator, an example of dynamic resistance is displayed below.
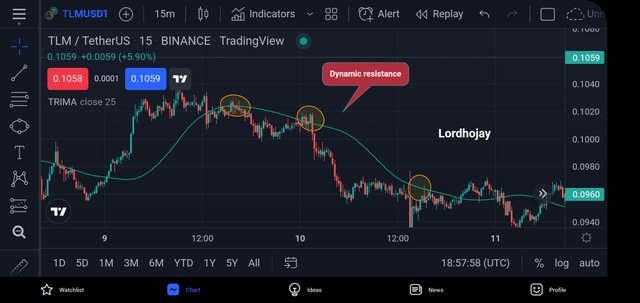
The TRIMA acts as dynamic resistance on the chart above, since price is rejected when it hits the indicator during a retracement. Following price rejection, a solid sell trade may be conducted.
TRIMA Indicator in a Consolidating Market
Price is viewed with no direction during a consolidating market, also known as a ranging market, since it bounces off support and resistance levels. This indicates low market volatility as well as demand and supply balance. The TRIMA indication is shown within price during this market circumstance. Price is neither in an uptrend nor a downturn at this time. The graph below serves as an example.
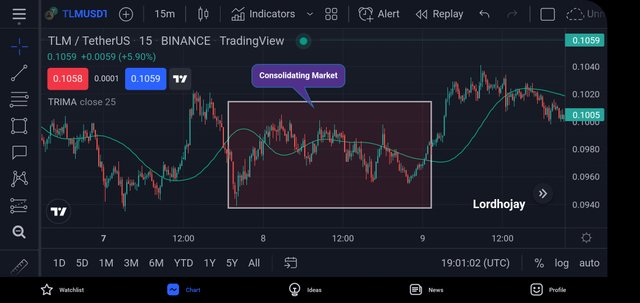
The TRIMA indicator's movement during a consolidating market may be seen in the chart above. As price swings inside a range, the signs were observed inside price. A breakout occurs when the TRIMA line crosses above or below price, signaling the start of a trend.


Buy Signal
To find entry positions, I'll combine two TRIMA Indicators. I'm going to combine a TRIMA with a length of 9 as a lower period length TRIMA and another with a length of 25 as a longer period length TRIMA.
When shorter TRIMA crosses over to longer TRIMA and rises above the longer period length TRIMA, we may consider that point to be our purchase entry point.
When the shorter TRIMA crosses over the longer TRIMA, we know we're in an uptrend and may start buying.
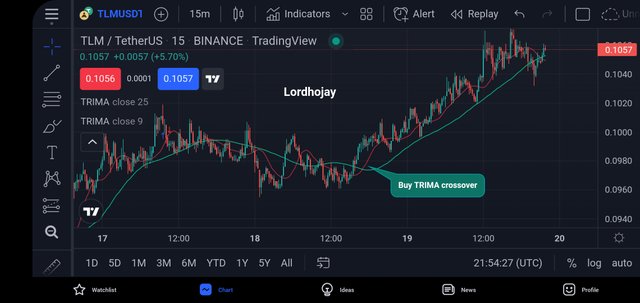
The shorter length TRIMA crosses over the larger period length TRIMA in the preceding graphic, and that moment might be regarded a purchase point.
Sell Signal
Because I have both short and long period TRIMA Indicators, I will continue to combine the same duration of both of these TRIMA for my sell signal.
When longer TRIMA crosses over to shorter TRIMA and rises above the shorter period length TRIMA, that is our entrance point for short positions or our departure point for long positions.
When the longer TRIMA crosses over the shorter TRIMA, it indicates that the market is in a downturn, and we may enter a short position.
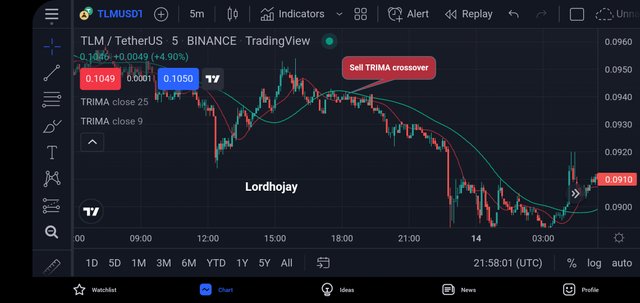
The longer length TRIMA crosses over the shorter period length TRIMA in the preceding graphic, and that moment might be regarded a sell point.


Bullish Reversal
First, I'll combine two TRIMA Indicators, one with a lower period length and the other with a longer period length, and use the Crossovers of both TRIMA lines to anticipate trend.
I'll be looking at the RSI Indicator as well. It is critical for the bullish reversal to test the Oversold zone on the RSI.
As I stated in my earlier response, if shorter length TRIMA crosses over longer length TRIMA, we may consider that moment to be a positive reversal.
Our trading setup should be based on thorough research and risk management. A stop loss should be placed immediately below the support level.
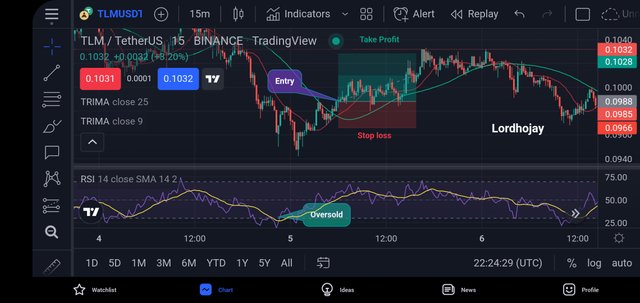
As you can see in the chart above, I started a Buy position as the shorter TRIMA crossed the longer TRIMA and the RSI reached the oversold zone.
Bearish Reversal
I'll combine two TRIMA Indicators, one with a lower period length of 9 and the other with a larger period length of 25, and use the Crossovers of both TRIMA lines to anticipate trend.
I'll also be watching the RSI Indicator for a bearish reversal. The RSI must test the overbought level.
As I said in my earlier response, if the longer TRIMA crosses over the shorter TRIMA, we may consider that moment to be a bearish reversal.
We should wait for one or two red candles on the chart to confirm the bearish reversal once all of the aforementioned parameters have been satisfied. A stop loss should be placed immediately above the resistance level.
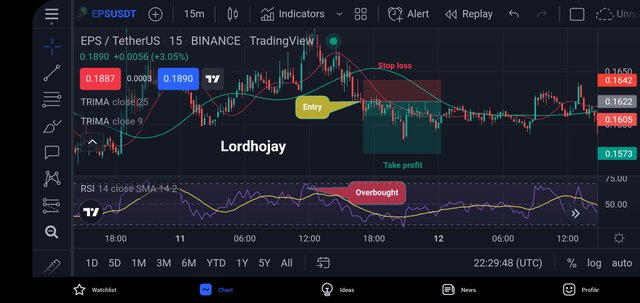
As you can see in the chart above, I started a sell trade as the longer TRIMA crossed the shorter TRIMA and the RSI reached overbought territory.
Combining MACD with TRIMA indicator to confirm Trend Reversals
Another momentum-based indicator that may be used to predict market direction is the MACD. Two EMAs, a fast period EMA and a slow period EMA, make up the MACD. A trend reversal indication is a crossover of the fast period EMA above and below the slow period EMA. I've included a slow period and fast period EMA of the same duration as the TRIMA indication in this area. The MACD crossover will be utilized to corroborate the TRIMA indicator's trend.
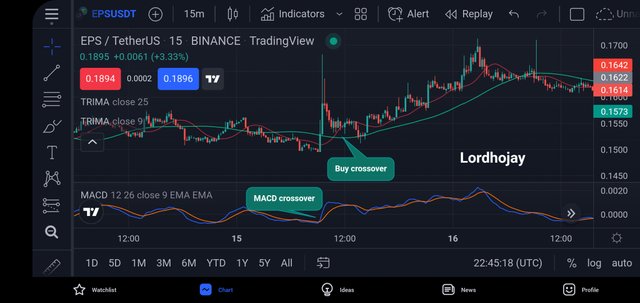
On the MACD, we can see a crossover of the slow period EMA over the fast period EMA in the chart above. This is thought to be a bullish trend reversal, which was subsequently verified by the TRIMA. We can also see a crossing of the slow period TRIMA over the rapid period TRIMA when looking at the TRIMA indicator. After the TRIMA crossing, a buy position can be created based on the convergence of the two indicators.
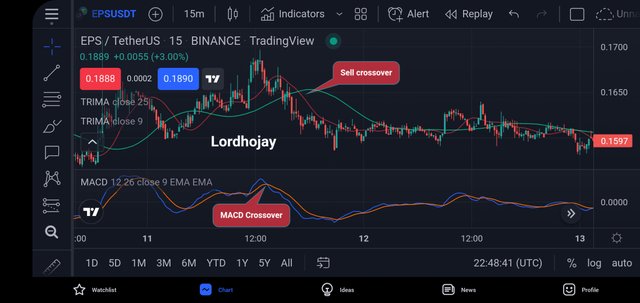
A crossover of the slow period EMA below the fast period EMA, which is a bearish reversal signal, can also be seen for a bearish reversal. In addition, the slow period TRIMA has crossed below the fast period TRIMA, indicating a bearish reversal.
I've integrated the MACD and TRIMA indicators in this part to confirm trend reversals. Before an entry position can be made, there must be a clear convergence of both indicators.


Buy Setup
I'm going to look at the SRM/USDT chart in the 5 minute time frame, and I'm going to combine a TRIMA of 9 length with another TRIMA of 25 length. I've also made use of the RSI Indicator.
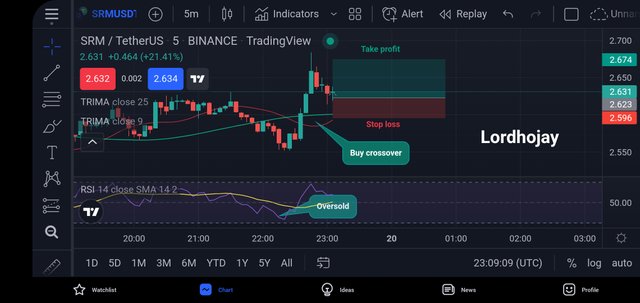
The shorter length TRIMA has crossed over the longer TRIMA and is now above the longer TRIMA, as shown in the above illustration. In the RSI, the price recently tested the Oversold zone, confirming my indication. My stop loss is set just below the support level.

Sell Setup
I'm going to look at the EPS/USDT chart in the 3 minute time frame, and I'm going to combine a TRIMA of 9 length with another TRIMA of 25 length. I've also made use of the RSI Indicator.
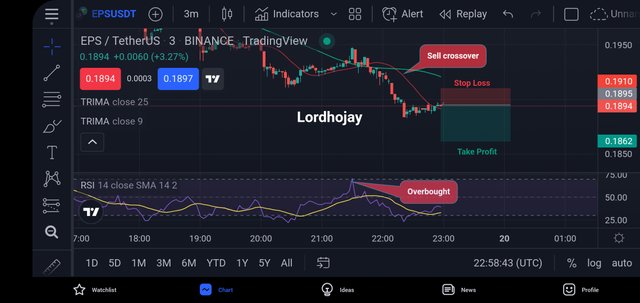
The longer TRIMA has crossed over the shorter TRIMA and is now above the shorter TRIMA, as shown in the above illustration. Then I looked at RSI, which had recently tested the Overbought zone, confirming my indication. Just above the resistance level, I've placed a stop loss order.


Advantages of TRIMA indicator
• TRIMA Indicator reduces noise and disruption from the chart, making it simpler to understand for the trader.
• Traders may use this indicator to spot trend reversals and emerging trends. We may combine it with other indicators to confirm trend reversals.
• Using the crossover method of these indicators, we may readily spot buy/sell signals. We can find buy/sell signals from their crossings if we mix shorter period length TRIMA and longer period length TRIMA.
• We can simply forecast forthcoming trends because this indicator is a trend based indicator.
• It provides significantly better findings than SMA since it takes more time and provides more smoother data.
Disadvantages
• We can't rely on a single TRIMA Indicator since it replies slowly. As a consequence, using this alone will not produce improved outcomes.
• It is slow to react since we will only receive a signal after the market has moved in a specific way. As a result, this signal may be downgraded.


The TRIMA indicator works by smoothing the basic moving average values using a twofold smoothing function obtained by its calculation. This function ensures that the TRIMA indicator ignores lags and random price fluctuations, resulting in a smoother representation of the indicator data in relation to price movement, making the TRIMA the best option for identifying trends, trend structure, support, and resistance areas using the average indicator. Because no trading indication is 100 percent effective, the TRIMA indicator should be used in conjunction with other indicators to provide solid trade signals.
Thank you professor @fredquantum for this class.