


Traders utilize one of three basic ways of analysis to analyze and anticipate price direction. Fundamental analysis, emotive analysis, and technical analysis are three of these methodologies. Fundamental analysis was formerly the most widely utilized approach, to the point that financial professionals considered technical analysis was magical. People nowadays, however, are employing technical analysis. In reality, many traders are beginning to employ technical analysis more often.
Fundamental analysis and emotional analysis both have flaws. The majority of the data required for analysis is not as readily available as that required for technical analysis, which may be found on a price chart. As a result, some traders favor technical analysis since it allows them to readily forecast price direction by glancing at the price chart.
The movement of price, which is reflected on the chart, is a representation of traders' emotions and psychology, therefore the explanation for price action. Price action may assist us comprehend what is now happening and what will happen in the future by predicting what will happen based on previous historical prices. Price action traders rely only on the reading of the graph/chart, which is why it is so vital in technical analysis.
To forecast market direction, price action traders employ tools such as support and resistance, candlestick and chart patterns, market structures, technical indicators, volume, and other tools on the chart. They look at what has happened in the past to predict how the price will move in the future. It's a common belief that the market follows the same trends. Traders take advantage of the possibility to follow the price when such patterns repeat themselves by researching the patterns that have occurred in the past.
Retail traders are able to track price directions thanks to the usage of price action. There are certain institutional traders, known as whales, who hold massive amounts of cryptocurrencies. These individuals or groups have the ability to affect price movement. Retail traders can forecast the direction of price and follow it when it moves in a given direction by using price action, but this needs traders to be extremely proficient in the use of technical tools to be able to predict with some accuracy.
We can see how beneficial price activity may be. Traders can utilize price activity to determine where to enter and leave the market.


Price action is critical in the financial markets since it aids in the determination of trend direction. The following are some of the reasons why price action is so important.
Market Structure from a Different Perspective:
The study of price behavior is crucial to comprehending market structure. Market structure prediction is difficult to grasp in the market, but traders may discover market structure through price movement. Pricing action can be used to discover important price and market data information. With the use of price action, areas of supply and demand may be easily recognized, which can help with price direction forecasts.
Understanding the Psychology of Buyers and Sellers: Price action is an excellent tool for alerting traders about what other buyers and sellers are doing in the market. Price action, which is always represented by price pattern, may reveal the psychology and emotion of both buyers and sellers.
Filtration of Market Noise and Misleading Signals: Another important feature of price action is its capacity to filter out market noise and false signals. As we all know, the price of an asset is constantly influenced in the market by professional and large investors and institutions. This causes the price to deviate from the previously established trend. Technical indicators are another factor that can produce market noise or erroneous signals. Because certain indications lag behind the price of an asset, it may take some time to catch up with the market trend. Price action is beneficial since it aids in the filtering of misleading signals and market noise.
Price Action vs Other Technical Analysis Tools
Price action, in my opinion, is the greatest type of technical analysis since it consists of raw price movement, which makes trend identification simple while removing noise caused by random price fluctuations, as well as a thorough grasp of the trader's psyche and emotions. A candlestick chart may be used to apply price activity to many markets and asset classes. Though other types of technical analysis, such as indicators, algorithms, and others, provide similar features to price action, such as trend identification, trade signals, and so on, it's important to remember that the foundation of these other types of technical analysis was built on the principles of price action.


The Japanese Candlestick Chart is a graphical representation of the interaction between buyers and sellers that shows the value of an item in real-time. A Japanese candlestick chart has a component called a candlestick that indicates price movement over a period of time. The high, open, close, low, shadow, and genuine body are the six important aspects of a candlestick. Each of the above described components depicts a price flow over a set period of time.
The Japanese candlestick chart is widely regarded by traders because of the way it depicts price, with high, open, low, and close displaying analytical data. The candles, unlike any other price chart, account for the trader's emotion by depicting the fight between buyers and sellers in the shape of shadows. Candlesticks provide traders with valuable pricing information that may be improved upon via candlestick analysis, resulting in better trading decisions.
Candlesticks on the Japanese candlestick chart are classified according to which side of the price movement they represent. For example, bullish candles, which are generally printed in shades of a different hue, are connected with price movement up (green). The initial price of the candle is generally lower than the ending price, indicating that the price of the asset represented has increased.
While bearish candles, which are commonly printed in shades of a different hue, are connected with price movement down, bullish candles are related with price movement up (Red). The initial price of the candle is generally higher than the ending price, indicating that the price of the asset represented has decreased.
The Japanese candlestick chart also exposes other important details regarding price movement, such as market volume, which is defined by the length of the candles that form, and price momentum, which is determined by the speed with which the candles are printed. When candlestick patterns are paired with additional price variables such as resistance and support, traders are able to make better trading decisions and benefit from executed trade orders.
Candlestick Chart vs Other Technical Chart
Other technical charts, such as line charts, bar charts, and Heikin Ashi charts, give price information through various graphical data representations. However, in my opinion, the Japanese candlestick chart is the most valuable and relevant price chart because of how crucial price data is displayed on the chart, making it easier for traders and investors to efficiently assess price movement.


The use of many time frames in the chart to forecast market movement and entry points for starting trades is known as multi-timeframe analysis.
Traders employ several time periods to determine the market's direction or a future trend's direction, as well as the exact entry points for a trade.
Traders can use lengthier time frames to determine the specific direction of the trend, while shorter time frames can be used to determine the exact entry points and stop losses.
The trader's trading strategy influences multi-timeframe analysis. If we are swing traders, we may utilize the Monthly time frame to determine the trend's direction before lowering our time frame to determine our trade's entry point and stop loss.
If we are Scalp traders, we may utilize the Daily time frame to determine the trend's direction before lowering the time frame to 15 minutes or 5 minutes to determine the entry and stop loss points.
Importance of Multi-timeframe analysis
• Utilizing longer time frames, we can readily discern the direction of an oncoming trend, and using shorter time frames, we can quickly estimate the entry point and stop loss. So, utilizing multi-timeframe analysis, we may quickly initiate a trade and book a profit.
• This analysis aids in the removal of noise and disruption from the chart, which is extremely beneficial to traders. Like If the chart has an accumulating zone, we may use a longer time period to better understand the trend's direction.
• We can also control our risk by employing multi-timeframe analysis since it allows us to pinpoint the correct stop loss for our trade, allowing us to simply manage our risk.
• Using this approach, we can corroborate our signal. Like If a signal has been anticipated using a time frame, we can move to other time frames to validate the signal.


As I indicated in the last article, multi-timeframe analysis is a useful tool. Using multi-timeframe analysis, I will offer an entry position on an asset.
I'm going to look at the AVAX/USDT chart. And, based on this analysis, we'll begin by reading a chart with a larger time period, then move on to a chart with a shorter time frame.
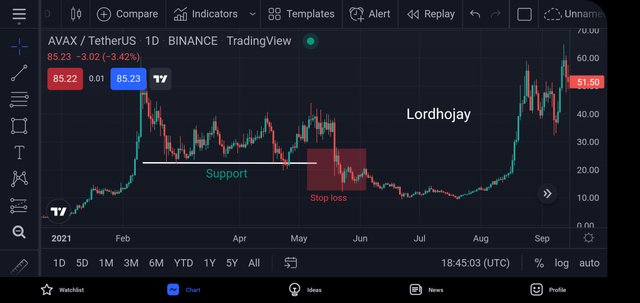
The chart above shows the AVAX/USDT in the 1day time frame, which is a longer time frame, and I've identified a Strong Support level, which has been retested by price. As a result, I drew a line through my entry at that moment. My stop loss is set just below the support level.
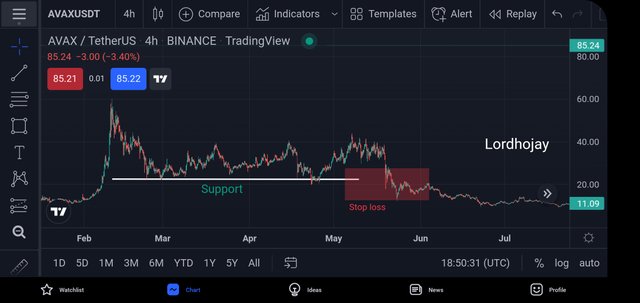
After reading the chart in the 1 day time frame, I moved to the 4 hour time frame and examined that point, marking a solid support level there through which price has rebounded numerous times and retested at that time. My stop loss is set just below the support level. As a result, I've recorded my entry at that location, and it's also confirmed in a shorter time period than before.
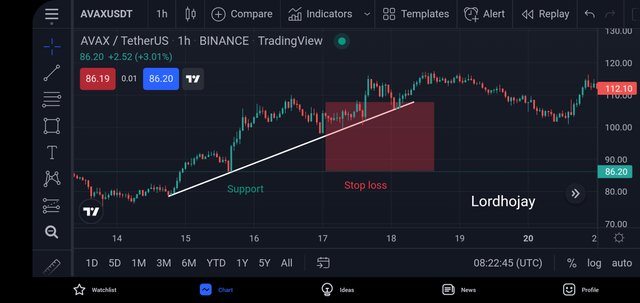
After that, I looked at this chart on a 1-hour time scale and saw a Support Trendline through which price was recovering, as well as my entry point, which was also after the retesting of price, confirming my entry point signal, and I placed my stop loss right below the support trendline.
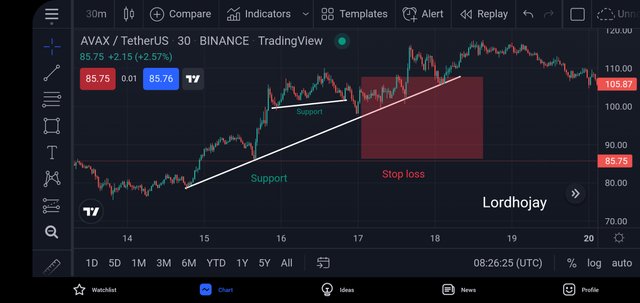
Finally, I used a smaller time frame chart of 30 minutes and identified a Strong Support Trendline through which Price has rebounced several times, as well as a support level that was providing support to the price in its upward movement, and I placed a stop loss right below the support.
I validated that my purchase signal was correct utilizing multi-timeframe analysis.


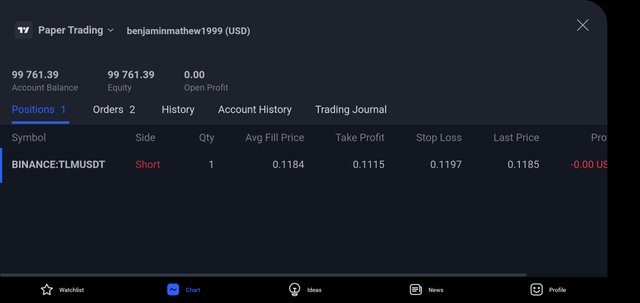
Now, I'll use multi-timeframe analysis to execute a sell order, as well as identify support and resistance levels in my trade setup.
I'll look at the TLM/USDT chart and interpret it in larger time frames first, then transition to shorter time frames, and finally confirm my signal with a good stop loss.
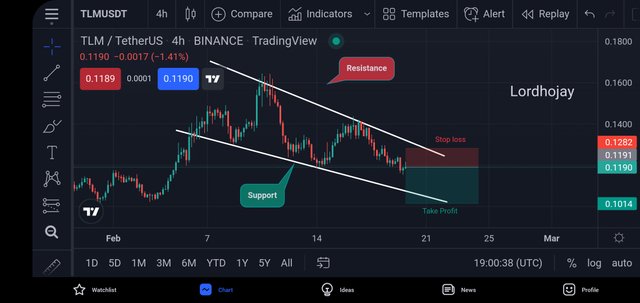
The chart in the accompanying graphic is for a 4-hour time frame. As you can see in the chart, I've found a significant Resistance Level, and the price has now retested that level, therefore I've taken this as a sell signal and entered at that time.
I've also found a Support level, and I've highlighted a Stop Loss level just above the resistance level and a Take Profit level just below it.
Now I'll move on to a shorter time range than the one described previously.
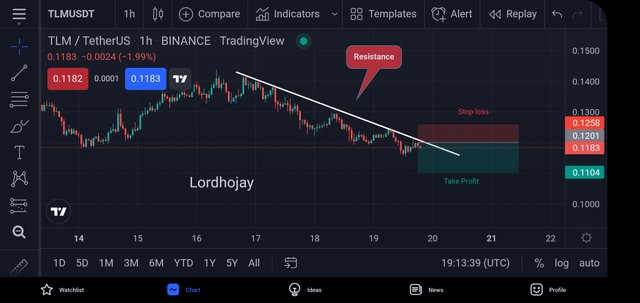
The above chart is in a one-hour time period, and I've found the Resistance level there as well. As a result, in this time period, I validated my signal and placed my stop loss right above the resistance level.
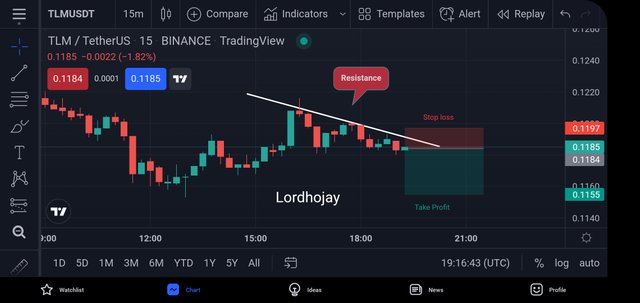
The above chart is in a 15-minute time frame, and I have that strong Resistance Level in the chart through which Price is recovering, so my signal is validated in this time frame as well, and my stop loss is right above that resistance level.
After that, I'll move on to a shorter time period, which will be 5 minutes.
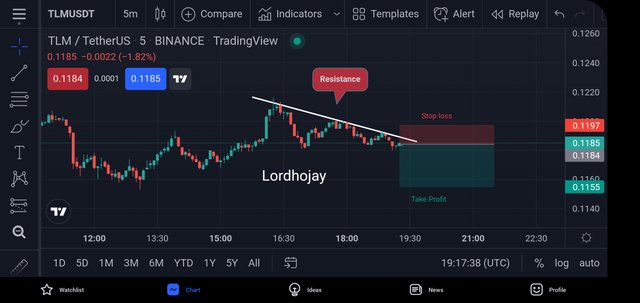
Two Resistance Levels in the Chart have been detected in the above graphic. One is the high resistance level shown above, and the other is the Resistance Trendline, which has seen price rebound several times and has also been challenged by my entry point.
As a result, my sell signal has been confirmed in all time periods. My stop loss is set just above the resistance level.


Price action is the study of past price data using graphical tools such as charts, patterns, indicators, algorithms, and price action in order to anticipate probable price changes. The price chart reveals traders' emotion and psychology, since the fight between buyers and sellers reflects the entire market emotions of its players, according to the concept of price action. While Japanese Candlestick charts are a graphical depiction of the interaction between buyers and sellers that shows the worth of an asset that correlates to the item's actual price in real time.
Thank you professor @reminiscence01 for this class.
