


The ultimate oscillator indication is a momentum indicator that analyzes and measures market momentum by combining short, medium, and long term price movements. Larry Williams created this indicator in 1976 to help traders solve the challenges that oscillators have when utilized in many periods at the same time. This indicator is significantly less volatile and produces fewer but more accurate signals than other oscillators on the market since it does not rely on numbers from a particular period for its analysis.
This indicator is commonly used to identify divergences and produce signals based on them. It also gives out reversal signals based on overbought and oversold conditions in the market. The ultimate oscillator indicator, like any other oscillator, gives a number between 0 and 100, and traders may use the signals to figure out where the market is at the moment. The indicator usually hovers around the 50 level, with readings over 70 suggesting overbought and readings below 30 indicating oversold.
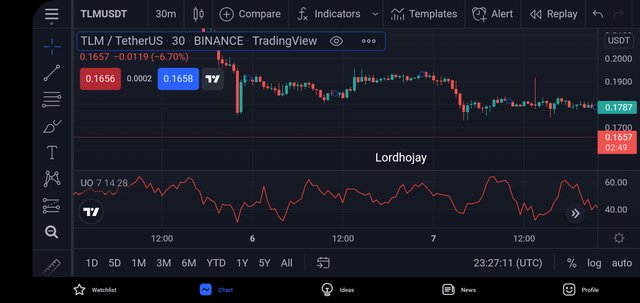
The following is the general mathematical formula for calculating the indicator values:
UO=(((A7 * 4)+(A14 * 2)+(A28))/7)100
where
UO = Ultimate oscillator
A7 is the average determined by computing (Sum of BP for the last 7 days / Sum of TR for the previous 7 days) over a period of 7 days.
A14 is a 14-period average produced by dividing (Sum of BP for the last 14 days / Sum of TR for the previous 14 days) by the number of periods.
A28 is the average obtained by multiplying the value by (Sum of BP for the last 28 days / Sum of TR for the previous 28 days) across 28 periods.
Bullish Pressure (BP) = Current Close – Min(Current Low or Previous Close)
True Range (TR) = Max(Current High or Previous Close) – Min(Current Low or Previous Close).
Illustrative example of the calculation (TLM/USDT)
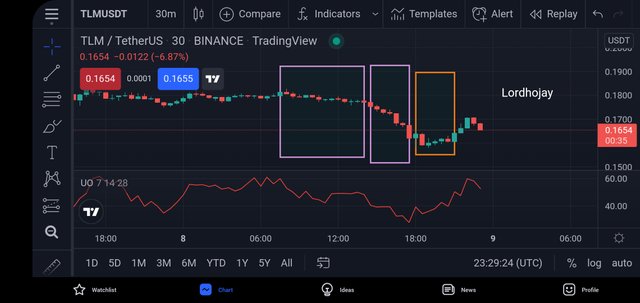
I've computed the different values for the buying pressure and true range over the past 28 periods below.
| periods | buying pressure | True range |
|---|---|---|
| 1 | 0.0039 | 0.0039 |
| 2 | 0.0003 | 0.0027 |
| 3 | 0.0023 | 0.026 |
| 4 | 0.0016 | 0.0023 |
| 5 | 0.0021 | 0.0042 |
| 6 | 0.0004 | 0.0055 |
| 7 | 0.0055 | 0.0074 |
| 8 | 0.0005 | 0.0061 |
| 9 | 0.001 | 0.002 |
| 10 | 0.0012 | 0.0053 |
| 11 | 0.0007 | 0.0022 |
| 12 | 0.0008 | 0.0023 |
| 13 | 0.001 | 0.0027 |
| 14 | 0.0001 | 0.0023 |
| 15 | 0.0003 | 0.0016 |
| 16 | 0.0009 | 0.0015 |
| 17 | 0.0017 | 0.0026 |
| 18 | 0.0006 | 0.0018 |
| 19 | 0.0006 | 0.0018 |
| 20 | 0.001 | 0.0014 |
| 21 | 0.0007 | 0.001 |
| 22 | 0.0011 | 0.0028 |
| 23 | 0.0003 | 0.0012 |
| 24 | 0.0013 | 0.0013 |
| 25 | 0.0002 | 0.0013 |
| 26 | 0.0009 | 0.0027 |
| 27 | 0 | 0.0023 |
| 28 | 0.0016 | 0.0019 |
From the information computed and given above
Now, that we have the BP and TR, we can determine the A7, A14, and A28.
Average7 = Sum of BP for the past 7 days/Sum of TR for the past 7 days
Average 7 = 0.0162 / 0.0727 = 0.02228
Average 14 = Sum of BP for the past 14 days/Sum of TR for the past 14 days
Average 14 = 0.0215/ 0.956 = 0.02249
Average 28 = Sum of BP for the past 28 days/Sum of TR for the past 28 days
Average 28 = 0.0351 / 0.9812 = 0.03577
Now that we have gotten the necessary details, let's proceed to calculate the Ultimate Oscillator Value.
Ultimate Oscillator = 100 x [(4 x Average7) + (2 x Average14) + (1 x Average28) / ( 4 + 2 + 1)]
UO = 100 x [(4 x 0.2228) + (2 x 0.02249) + (1 x 0.03577) / ( 4 + 2 + 1)]
UO = 100 x [(0.08912) + (0.04498) + (0.03277) / ( 4 + 2 + 1)]
UO = 100 x [(0.16687) / ( 7)]
UO = 100 x 0.0238
UO = 2.38 approximately to 2
The UO value gotten in the chart above is 2.38 which means the calculation is accurate. With the use of the mathematical formula, I've been able to calculate the value for the ultimate oscillator indicator.


Bullish Trend
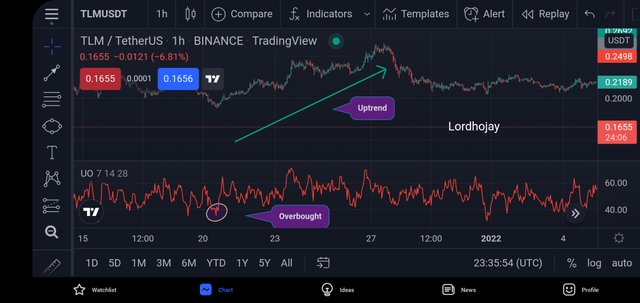
Identifying trends is usually simple using momentum-based indicators. When the selling force in the crypto market is particularly strong for a period of time, buyers rush in to acquire more of the asset since the price has decreased. As a result, the market is on an upward trend. The reading of the Ultimate oscillator falls between 0 and 30 to indicate that the asset is being oversold and to encourage buyers to acquire more of the asset. The price moves in an upward trend as a result of this.
Bearish Trend
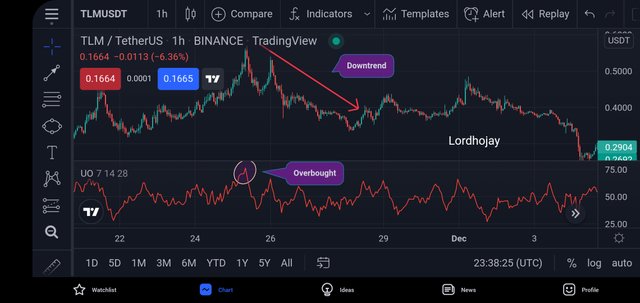
Identifying downtrends, on the other hand, is the polar opposite of identifying uptrends. When the asset is in a downtrend, the Ultimate indicator runs between 70 and 100, indicating that it is overbought. As a result, individuals begin to sell more of their holdings, causing the asset's values to decrease. Because the majority of investors are dumping their assets, the market is in a downward trend.
| Ultimate oscillator | slow-stochastic |
|---|---|
| Its analysis is based on values created from three separate periods (7, 14, and 28). | The slow stochastic analysis is based on values generated from just two periods (14 period and 3 period). |
| Generates a lot of signals each period and frequently delivers wrong signals if not filtered | Generates a lot of signals per period and often gives inaccurate signals if not filtered |
| Around the 70 level upwards, an overbought condition develops, and around the 30 level downwards, an oversold condition arises. | An overbought condition happens around the 80 area upwards, while an oversold condition occurs around the 20 region downwards in the slow stochastic. |
| Multiple timeframes are used to smooth out divergence signals, resulting in more reliable signals. | Fewer timeframes are used, resulting in numerous erroneous divergence signals. |


Bullish Divergence
A bullish divergence occurs when the asset's price moves in a negative direction while the indicator moves in a bullish direction at the same time. The price quickly reverses in a positive trend after such swings, resulting in the bullish divergence. The price of the asset would be in a decline with the Ultimate indicator, whereas the ultimate indicator would be in an uptrend. The divergence is genuine due to the swift reversal in the positive trend.
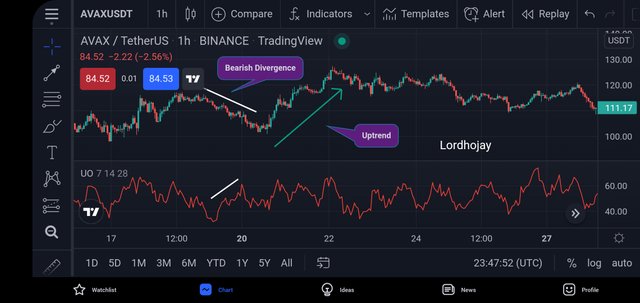
Bearish Divergence
A bearish divergence occurs when the asset's price moves in a positive direction while the indicator moves in a bearish direction at the same time. The price quickly reverses in a negative trend after such swings, resulting in the bearish divergence. While the price is in an uptrend, the ultimate indication first swings in a negative direction. In such circumstance, a bearish divergence is a certain conclusion.
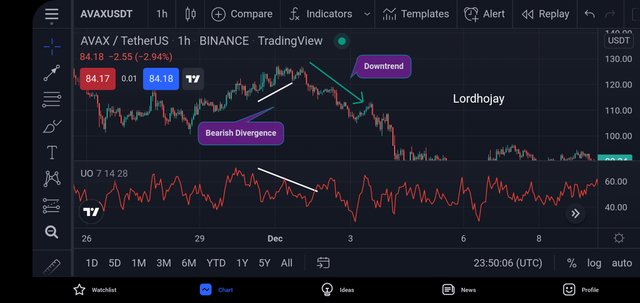
We may use additional momentum-based indicators in addition to the Ultimate indicator to spot divergence and enter trades. Although the final indicator detected divergence, I believe that utilizing the RSI, William percent R, and the Stochastic indicator would be easier.


Using the ultimate oscillator to take entries is a breeze. Here, I'll show you how to use the ultimate indicator to recognize signals and trade them.
Buy trade
The first thing we notice is a bullish divergence. When the price goes in a negative manner and the signal moves in a positive direction, this is what happens.
While the price continues to decline and the indicator continues to rise, the initial lower low in the price must fall below the 30 ultimate oscillator level.
Above the divergence high, the final oscillator must increase (the point between two lows of the divergence.)
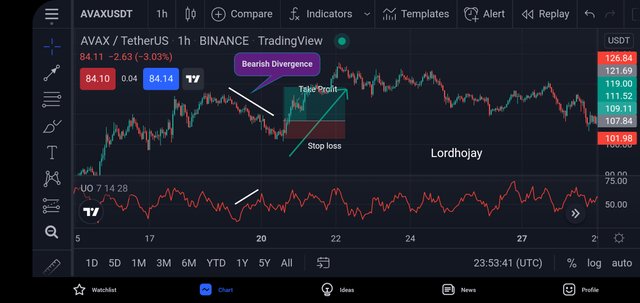
We can see from the AVAX/USDT chart above that it meets all three requirements.
Sell Trade
The first thing we notice is a bearish divergence. When the price advances in a positive way and the signal swings in a negative manner, this is what happens.
While the price continues to rise and the indicator continues to decline, the original higher high in the price must rise above the 70 final oscillator reading.
The final oscillator must be below the divergence minimum (the point between two highs of the divergence.)

We can see that the AVAX/USDT chart above meets all three of these criteria.


The ultimate oscillator, in my opinion, is a very good indicator that may be utilized for trading. However, based on how the signal works, I believe it should be utilized in conjunction with other technical techniques or indications as a confirmation before trading.
In comparison to technical tactics, they appear to recognize signals quite late, based on my experience with a technical indication. Although the Ultimate oscillator may be used alone, I believe it is ideal to utilize it in conjunction with other tactics.
In terms of the timeframe appropriate for this indicator, I believe it may be used by both scalpers and swing traders. Because the ultimate indicator analyzes three distinct periods (7, 14, and 28 periods), scalpers and swing traders can select the timeframe that best suits their needs. Scalpers, on the other hand, have a greater edge with the final indication. Many trading indications may be identified in shorter periods.


The ultimate oscialltor indicator is a fantastic technical analysis tool for studying multiple periods in the market, and it excels at finding divergences as well as providing successful trade signals in this market.
Hello @utsavsaxena11 i made some error in my markdown while export the draft form my pc. There's was no time for me to correct it because it has pass the deadline. Please prof. Can i correct it now.
Downvoting a post can decrease pending rewards and make it less visible. Common reasons:
Submit
ok!!!
Downvoting a post can decrease pending rewards and make it less visible. Common reasons:
Submit
I have corrected it professor. Thank you sir
Downvoting a post can decrease pending rewards and make it less visible. Common reasons:
Submit