Good day fellow steemians, I'm called Abdul-Razak Lukman but my user name is @lukman1 here on steemit.
It's been a pleasure attending the lecture of Professor @lenonmc21. I must attest to the fact that this lecture was very educative especially when it was blended with it's practical side. In all, this lecture was helpful to me and I hope it's helpful to you to.
Below is my homework submission for the questions that were asked after the lecture.

Simple moving average(SMA) is one of the important technical tools commonly used by financial analysts to ascertain the changes of price over a period of time.
The Simple Moving Average is also used to find out the possible trend and standing of an asset. Because of it's ability to determine the trend of an asset, it's primarily referred to as a trend indicator.
The SMA is always represented or seen as a line on the graph. This indicator helps and assist financial analysts to calculate the average closing price of an asset over a specific period of time.
Another important use of this indicator is that, financial analysts also use it to determine the possible resistance and support levels of an asset on a chart.
The Exponential Moving Average(EMA) is also one of the important technical tools mostly used in the financial markets by traders or analysts.
The Exponential Moving Average looks exactly like the Simple Moving Average, but they have some little differences which does not make them the same.
Unlike the Simple Moving Average, the Exponential Moving Average always takes into consideration the current price of an asset which makes it more effective than the Simple Moving Average.
Another advantage of the EMA over SMA is that, EMA moves with the changes in price well than the SMA.
Calculations of simple moving average is very easy and precise. As I already stated above, simple moving average basically calculates the average closing price of an asset over a particular period of time on a chart.
This time period can be in minutes, hours, days or months. It depends on the time frame you desired. For instance, if I decide to use 6 moving average with 1 day time period on my chart, then the simple moving average will calculate the average of each closing candle for 6 days.
I think the explanation above will be made more clearly and understandable if we look at it in the mathematics perspective. Let's give it a try;
Assumption: To use 6 simple moving average on 1D (1Day) chart.
Let's also assume that the closing price of a
candle for the past six (6) days are: $45, $36, $40, $25, $30 and $42.
From the above data, the simple moving average will now be calculated by summing each closing price and divide it by 6.
That is: ( 45 + 36 + 40 + 25 + 30 + 42) ÷ 6 = 36.33
Therefore, 36.33 is the simple moving average of the values. This 36.33 can be plotted on a graph.
Know that it is relevant to use exponential moving averages when the closing prices of assets are far away from each other.
Exponential Moving Averages is mostly used by traders because it an indicator which does not lag behind price. Because the Exponential Moving Average does not lag, it's use to calculate the most recent price of an asset.
Calculation of this average is somehow tedious as compare to the SMA. Let's give it a try and see how the EMA is calculated.
Assumption: Let's assume that I have an asset whose closing prices for the past 5 days, on a daily chart are $10 , $14.5, $5.5, 8.5 and $15.
EMA is calculated by summing the recent price of market to the previous EMA.
EMA can be calculated using the formula given below:
Exponentialxponential moving average (EMA) = Closing price x multiplier + EMA (previous day) x (1-multiplier)
NOTE: If we know the multiplier, the EMA of the given data can easily be calculated using the formula above.
- Moving averages are used to determine the trend of an asset: Both the SMA and EMA are used to determine the trend of an asset when it comes to finance trading.
Various kinds of traders use this indicators to determine movements of assets. The EMA and SMA are used to predict the direction in which price is heading to with the help of other indicators.
The SMA and EMA are used with a line on the chart called the trend line.
In a situation where the two moving averages(SMA and EMA) crosses, and the candlestick meets the trend line, a confluence is formed. So this means that the moving averages are used as a confluence with the trend line.
- SMA and EMA are used with support and resistance level on the chart: Most traders usually take a trade when they realize that the moving averages cross at a support or resistance level on the chart.
Therefore, moving averages are used with support and resistance.
As I already stated in the first point, moving averages are primarily used for trend which means that they are best when it comes to dynamic support and resistance.
- One important use of the moving average is that, they play a major role in the prediction of price reversal in a market. When the Golden cross is formed at a very extreme area, a price reversal may be signalled.
The simple moving average is very easy and simple to calculate. It is more or less like average arithmetic where calculations are simple to carry out.
In simple moving average, the moving average is basically calculated by adding the closing prices of the asset together and divide them by the number of closing prices, it will provide us the SMA.
This is just like calculating for the mean of a given data. The procedure and process is the same.
Where as the exponential moving average is very technical, complex and somehow tedious to calculate. It doesn't follow the same procedure as the SMA but it rather uses a formula in it's calculation.
Simple Moving Average is believed to be commonly used by most traders and financial analyst. Nonetheless, combination of both the SMA and EMA are very strong, particularly golden cross that indicate reversal of a price or continuation of a trend.
Although the Simple Moving Average (SMA) is a technical indicator, and it calculate the average closing price of an asset, it does not give us the current or recent price of an asset.
Whereas the Exponential Moving Average (EMA) is also a technical indicator, it calculates the recent price of data of an asset.
Some analysts may sometimes refer to the EMA as Weighted Moving Average(WMA). This is because the Exponential Moving Average provides the weight of the current or recent prices of an asset.
The Fibonacci retracement is a technical tool that is usually used alongside the moving averages. The Fibonacci retracement is made up numbers in a sequence. That is, the numbers follow a certain pattern or order.
The Fibanocci retracement is used to measure the probable future correction or it is used to calculate the retracement of an asset after a powerful impulse.
The Fibonacci retracement are horizontal lines, this lines shows the possible support and resistance area of an asset on a chart.
As stated already, the Fibonacci retracement are numbers which are in sequence, the numbers that formed the the sequence are gotten by adding the previous two numbers.
For example, if I have this sequence of numbers 0,1, 1, 2, 3, 5, 8, 13, 21, 34, 55, 89...etc. Someone might be confused and ask himself, how does this come about? Let's do small calculations in order to understand better.
0+1 =1
1+1 =2
1+2 =3
2+3 = 5
3+5 = 8
5+8 =13
8+13 = 21
13+21 = 34
and it goes on and on.
These numbers gotten above are referred to as the Fibonacci sequence.
We can as well calculate the fibonacci retracement ratio.
This ratio is basically obtained by dividing the previous number by the next and the previous by the second number on the right side of the sequence.
For example, the illustration below indicates how the Fibonacci retracement ratio is calculated. The explanation is made simple by viewing it in a mathematical perspective. This is how the pattern goes;
0 / 1 =0
1/1 =1
1/2 =0.5
1/3 = 0.333
2/3 = 0.666
3/5 =0.6
3/8= 0.375
5/8 =0.625
5/13= 0.384
8/21 = 0.380
13/34= 0.382
21/55 =0.3
34/89 = 0.617
and many more.
Hence, all this numbers are referred to as the fibonacci retracement ratio.
The Fibonacci retracement is used to measure the correction of both the bullish and bearish candlestick.
When the Fibonacci tool is used to measure the correction of the bullish candlestick, it's referred to as the bullish correction and when it is measures the bearish candlestick, it's referred to as the bearish correction.
We measure the bullish correction by using the Fibonacci tool to draw a gradient or slope from the swing low to the swing high on the chart.
Because we are drawing from the low to high, 100% of this slope will be at the swing low whilst 0% will be at the swing high on the chart.
The tool always show different percentages of the fibonacci numbers within this gradient.
On the other hand, the slope of the bearish retracement is drawn from the swing high to the swing low on the chart. The 100% of this slope will be at the swing high and the 0% will be at the low on the chart.
This clearly shows that the bullish correction is the direct opposite of the Fibonacci bearish correction.
Now, it's important to bring to your notice that the Fibonacci retracement has a golden ratio. This golden ratio of the Fibonacci retracement is 0.618 or 61.8%
This ratio is gotten by simply dividing one Fibonacci number by the next. For example, 34÷55. Some traders might decide to say this ratio is 61.8% and others can also say it's 0.618, either way is accepted.
PRACTICE (ONLY USE YOUR OWN IMAGES)
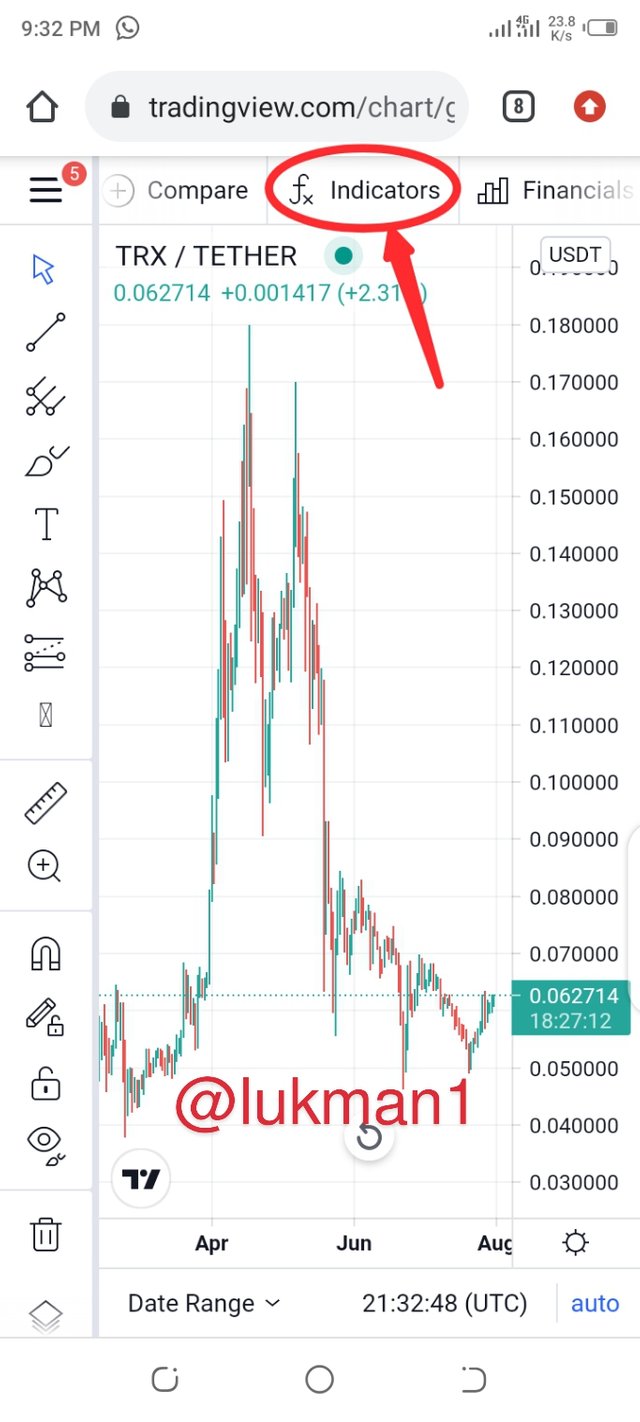
I will be using the tradingview platform to do this illustration. First of all, visit https://tradingview.com.
After the page opens, you click on indicators as circled in the screenshot below.
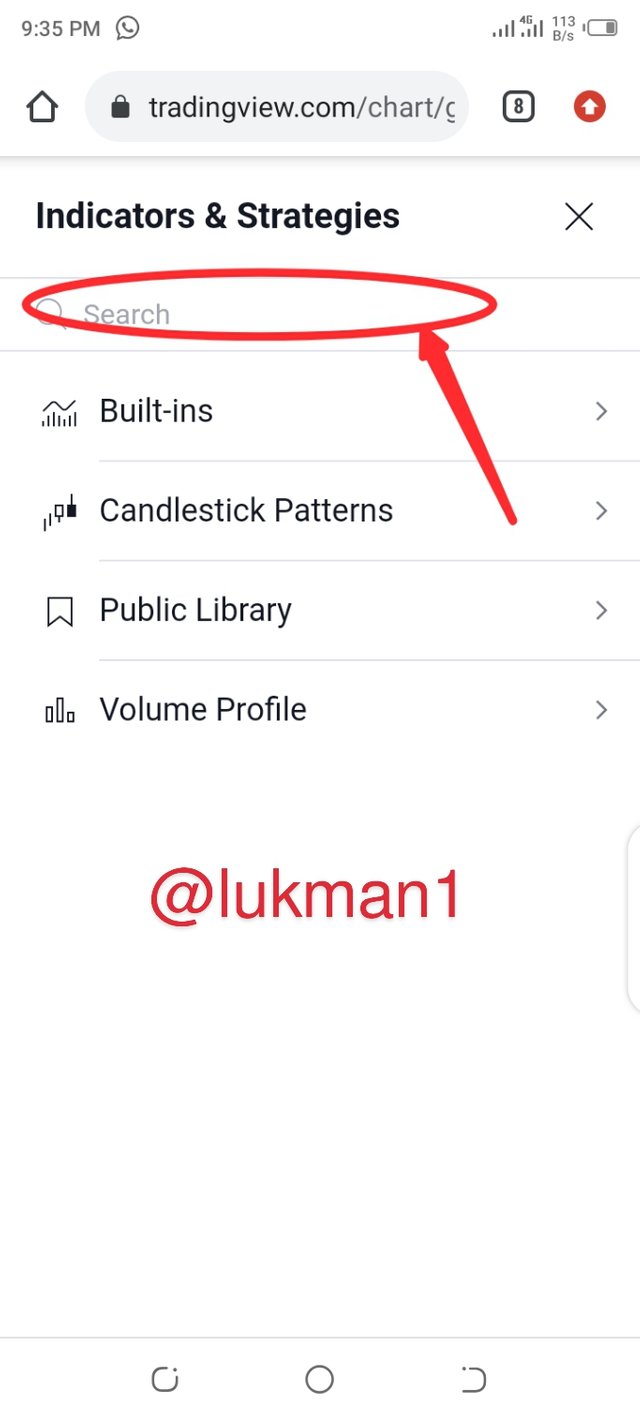
- You will realize a list of items shown, ignore them and search for "moving averages" in the search box provided.
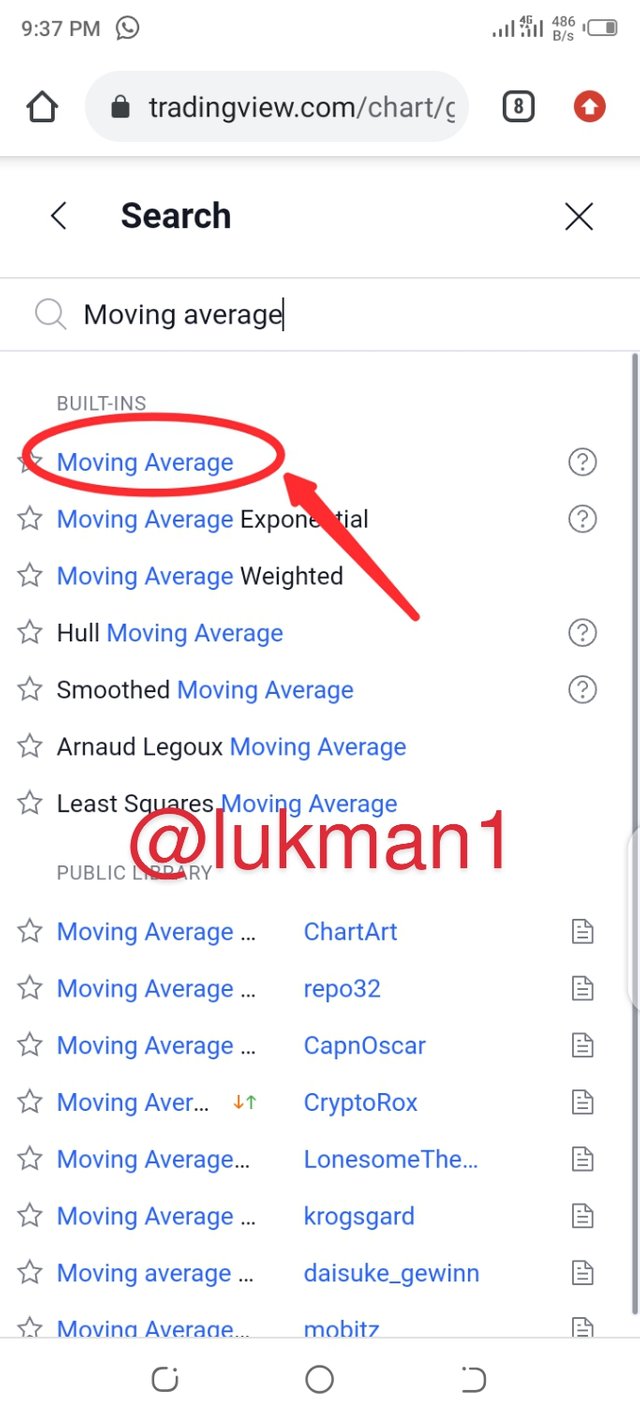
- After searching, you will see the moving average displayed clearly. Click on it and go back to your graph/chart.
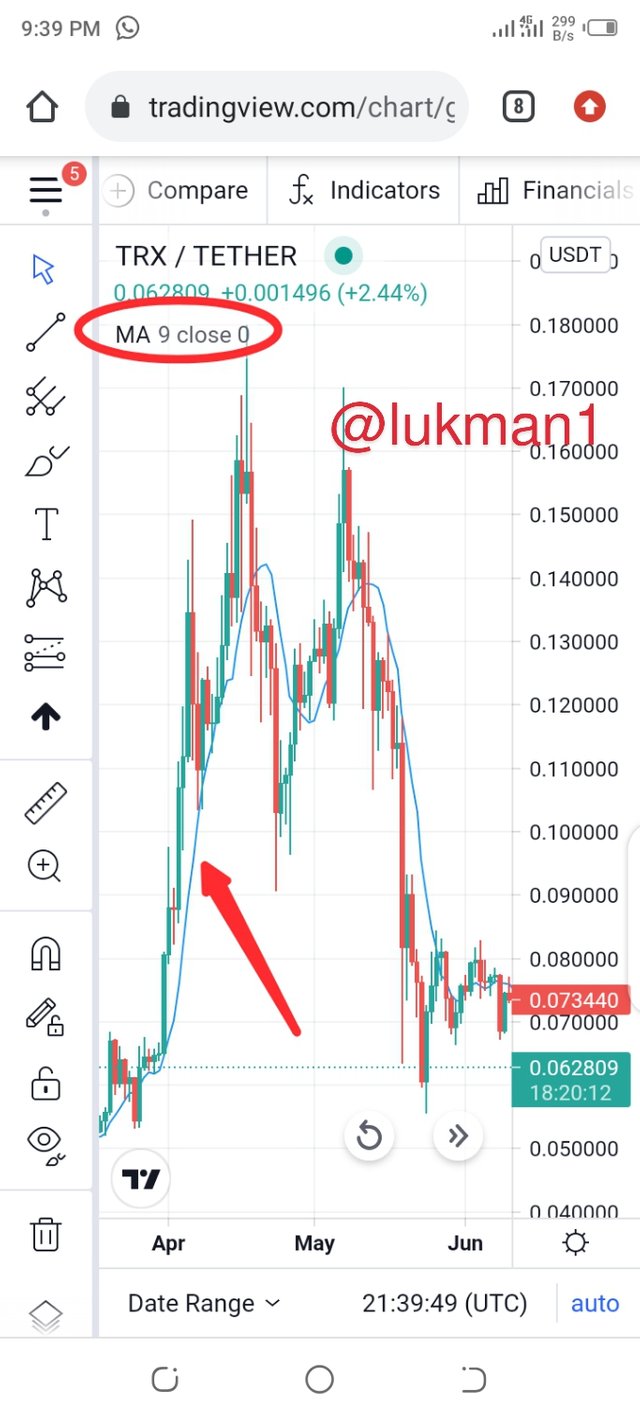
- You will realize that a line has been added to your chart, that's the simple moving average line. At the top of your graph, you will realize that there is a portion where MA with some numbers is written, click on it as shown below.
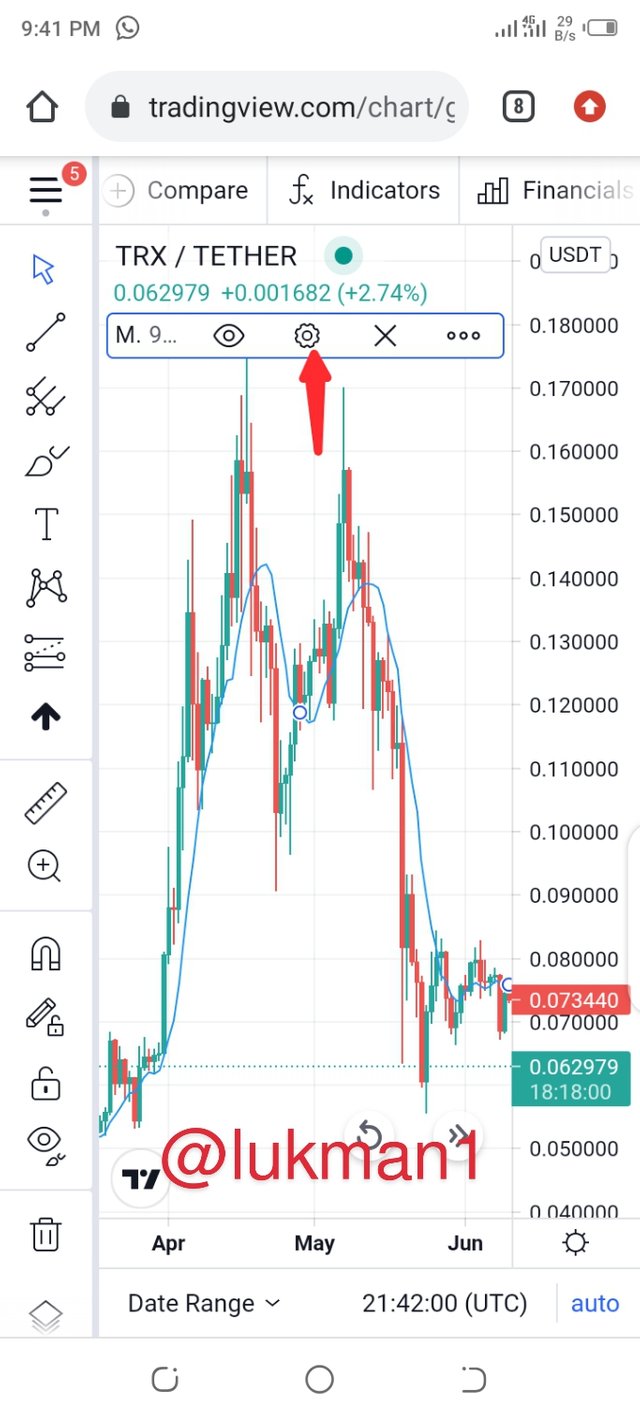
- Click on the settings as highlighted below in the screenshot.
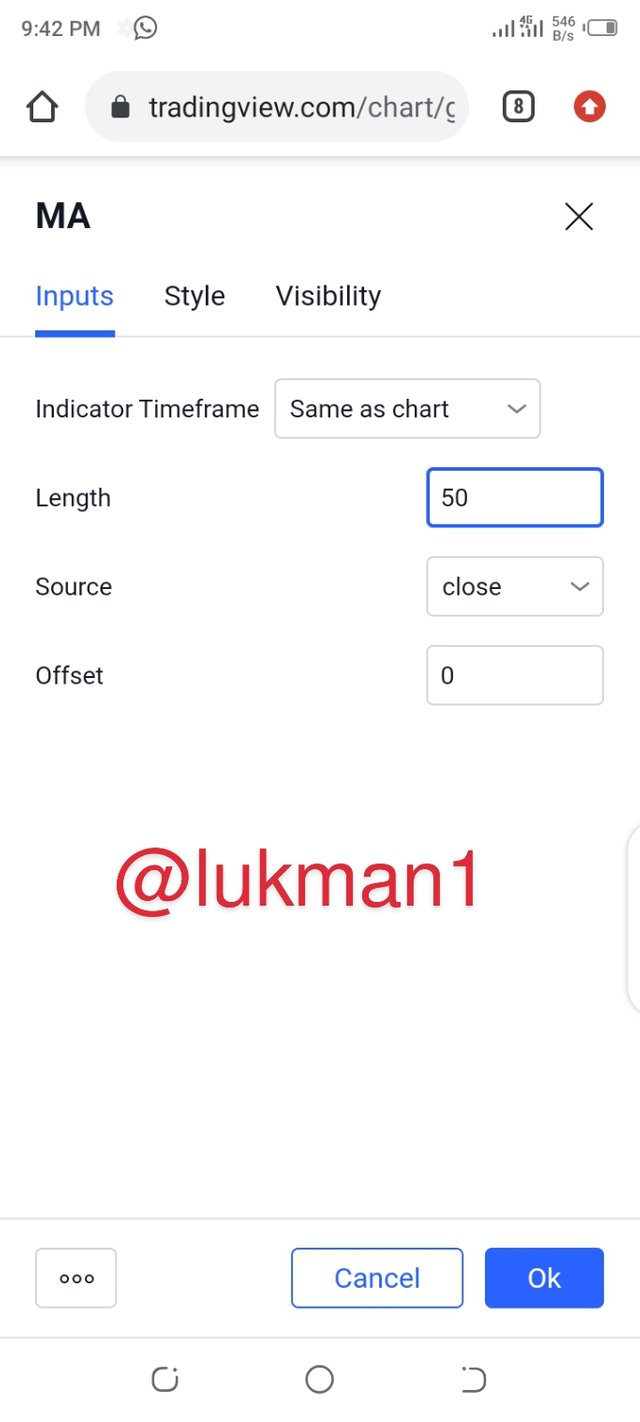
- A page opens where you will be given the option to fill in the boxes with your parameters. I will put 50 in the length box and click on Ok.
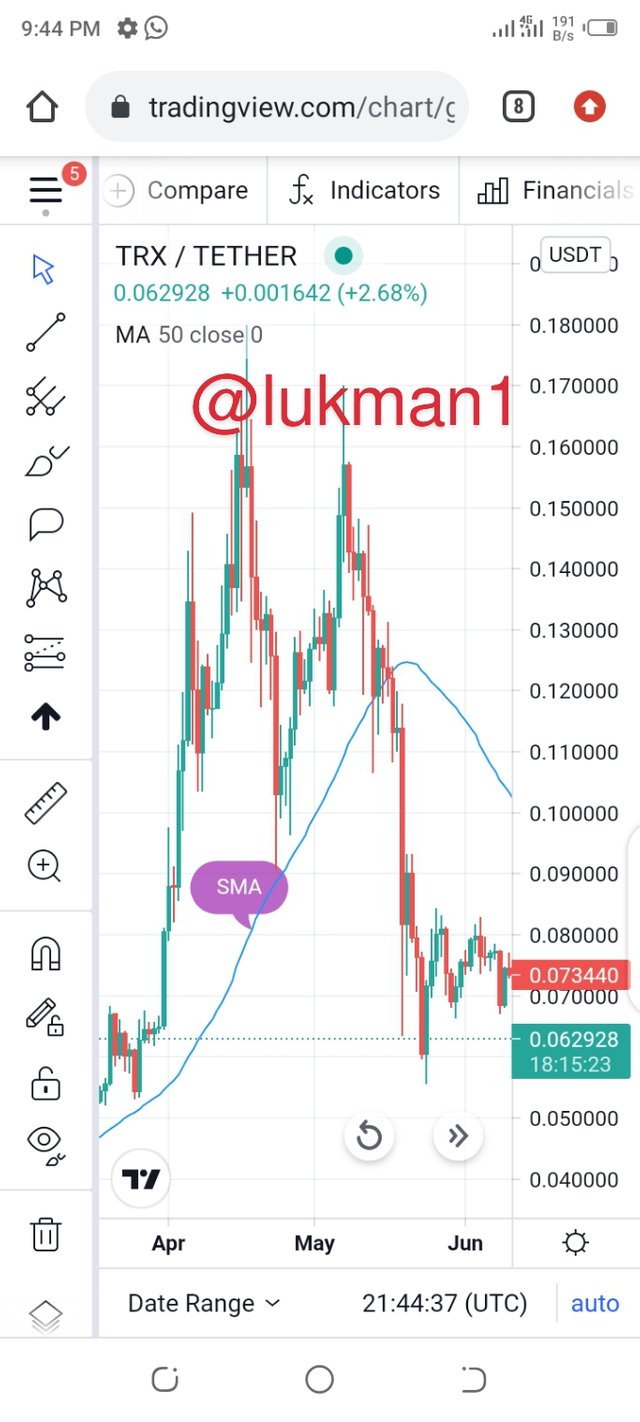
- I hope you can now see clearly the simple moving average.
- Type "Moving average Exponential" inside the search box provided.
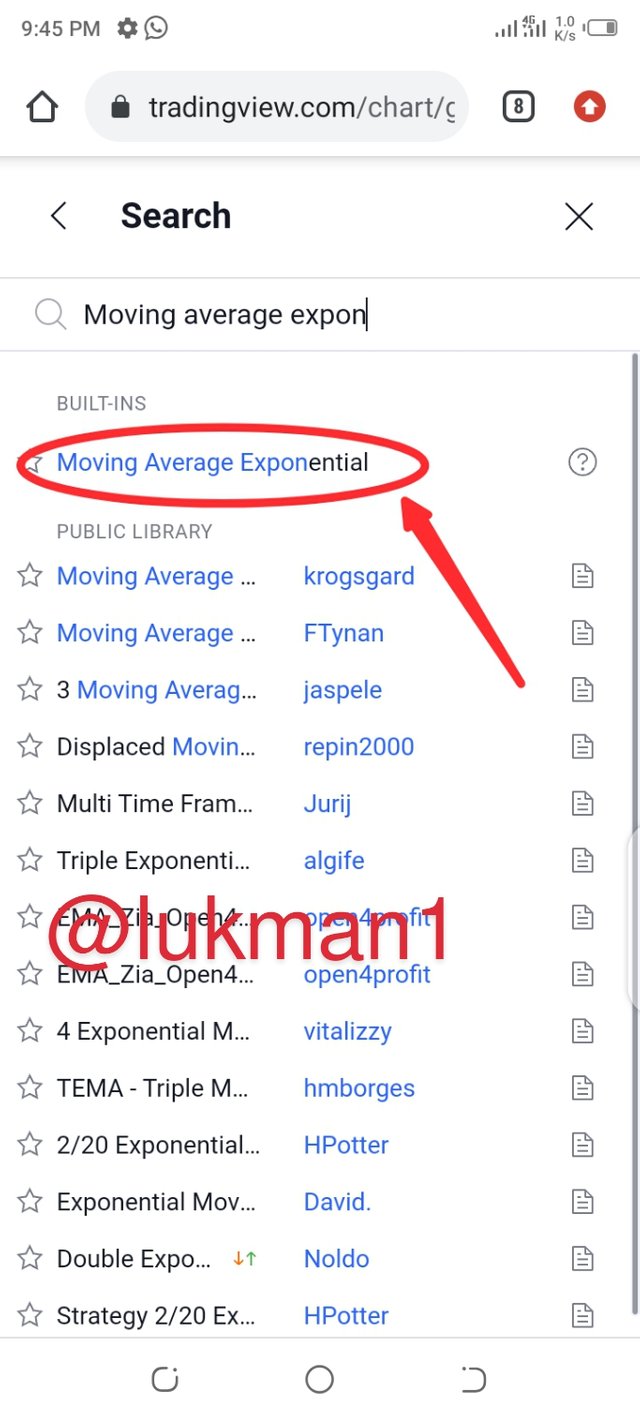
- The results are displayed, you click on the moving average Exponential and go back to your graph.

- You will realize another line has been added to your graph, that line is the Exponential moving average.
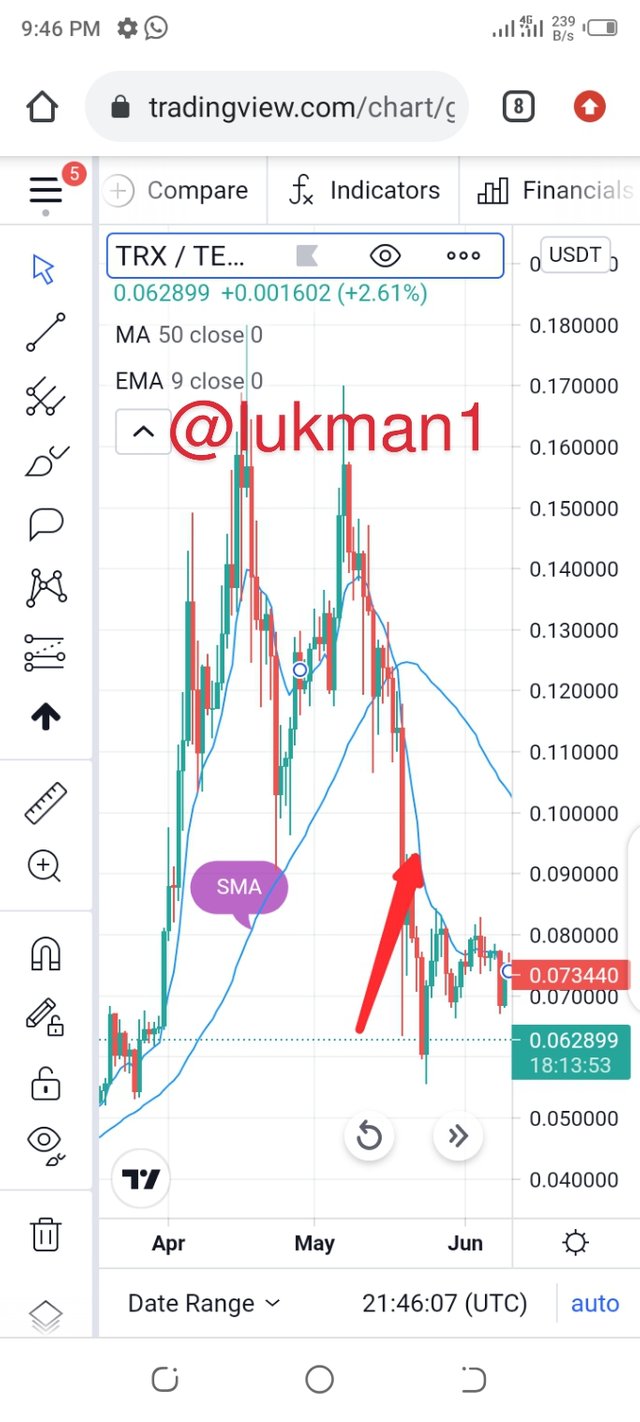
You can see that the distance between the two lines are very close and they both have the same color. So I have to change the color of the EMA as well increase it's length.
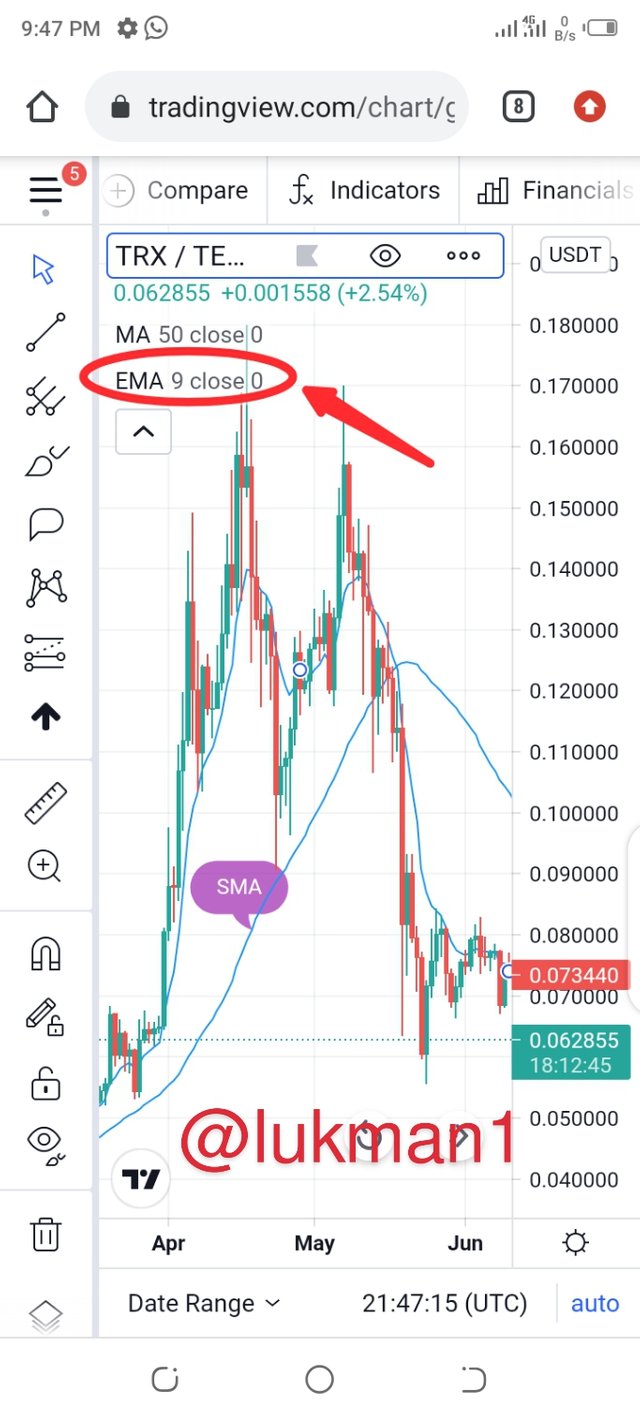
At the top you will realize that EMA has been added to MA which was initially there. Click on EMA as shown below.
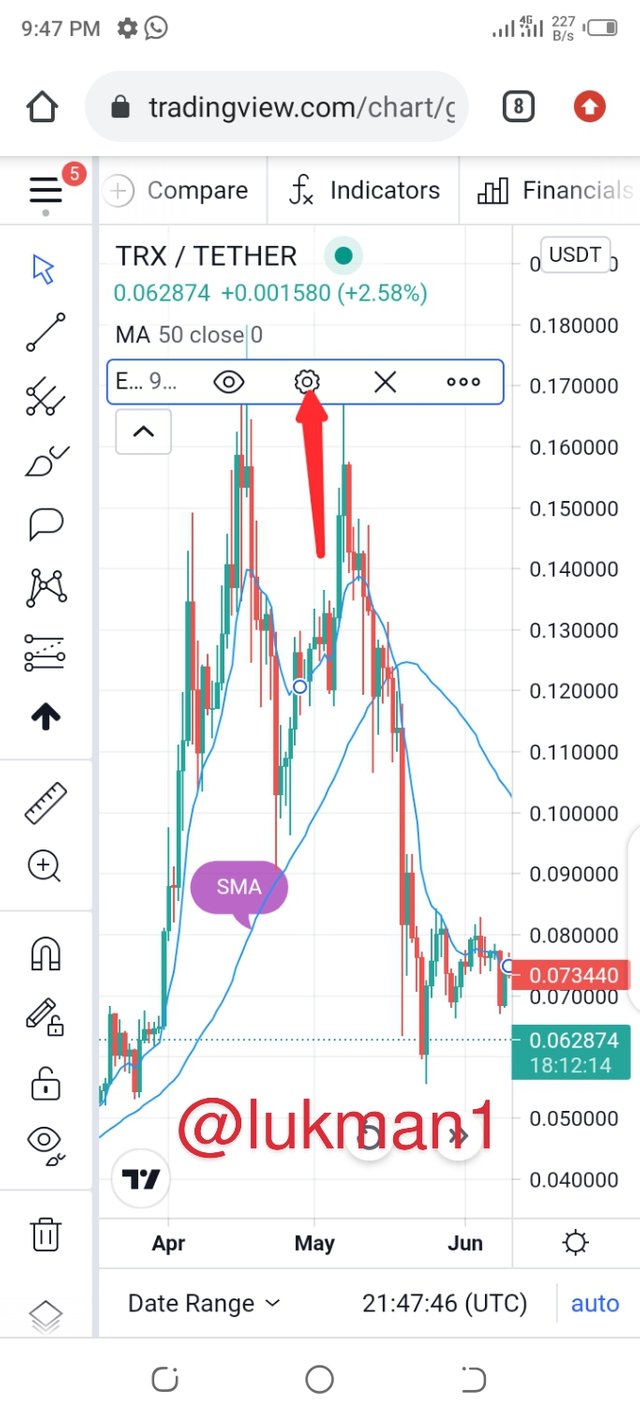
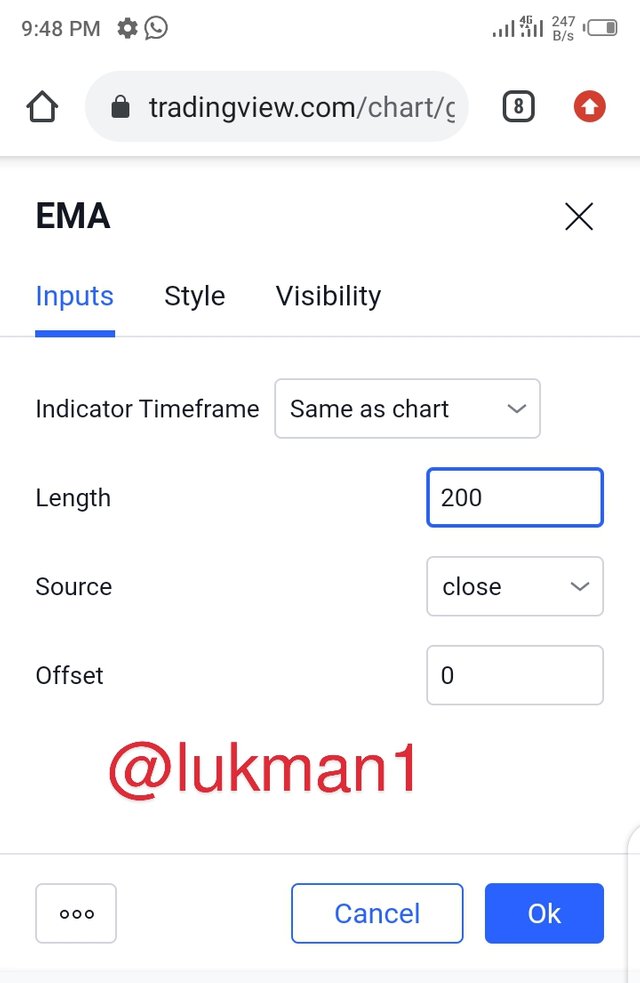
- Click on settings and a page will open for you to put in your parameters to adjust your line.
- I will put 200 in the length box.
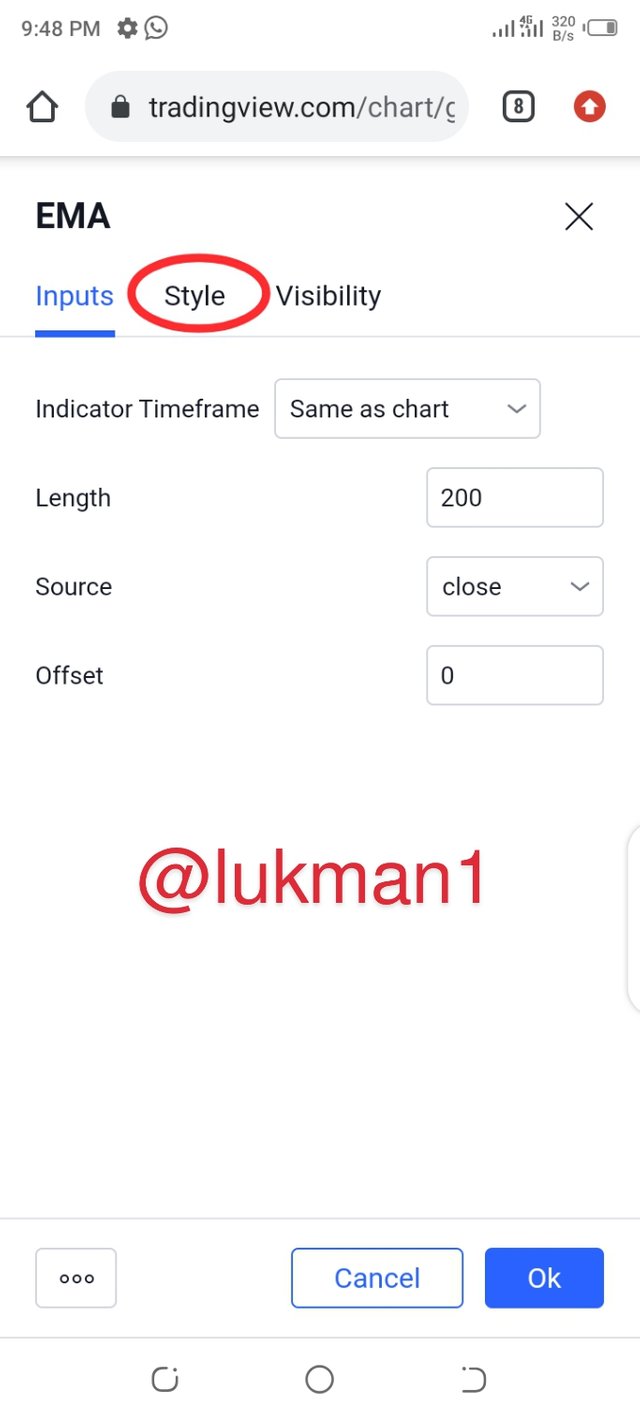
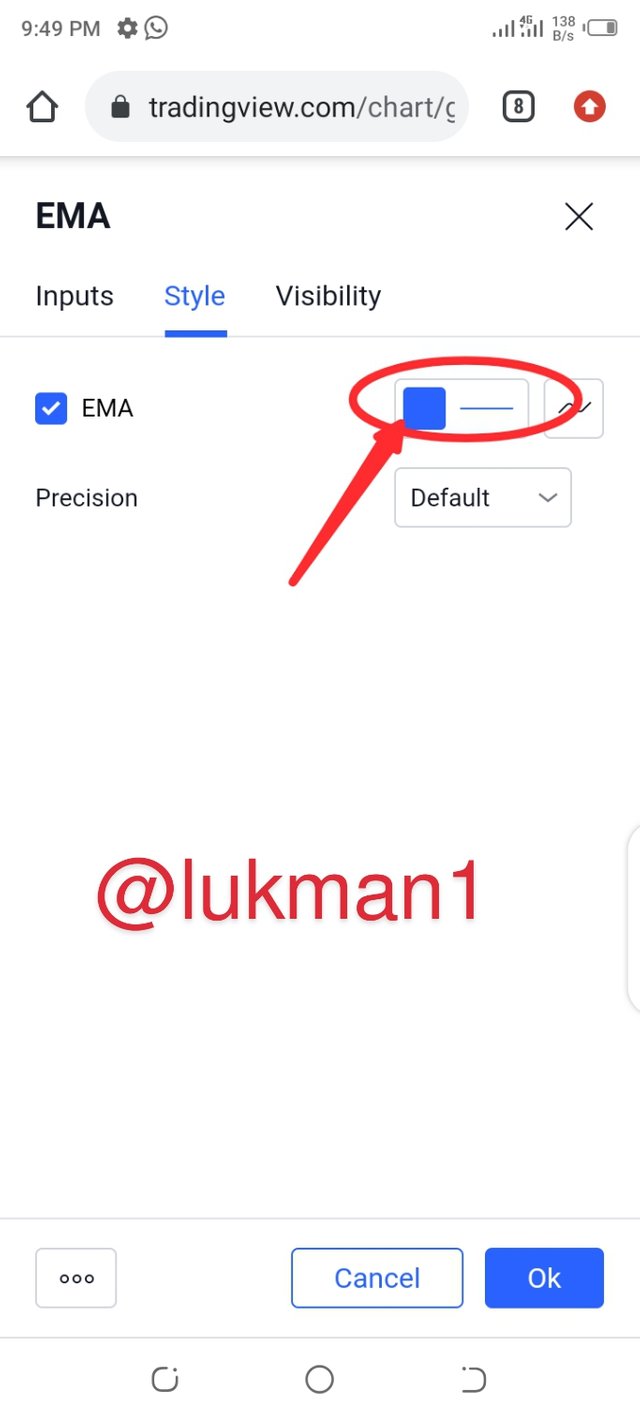
- Next thing is, you click on style. This helps you to choose a unique color of EMA to be different from that of MA.
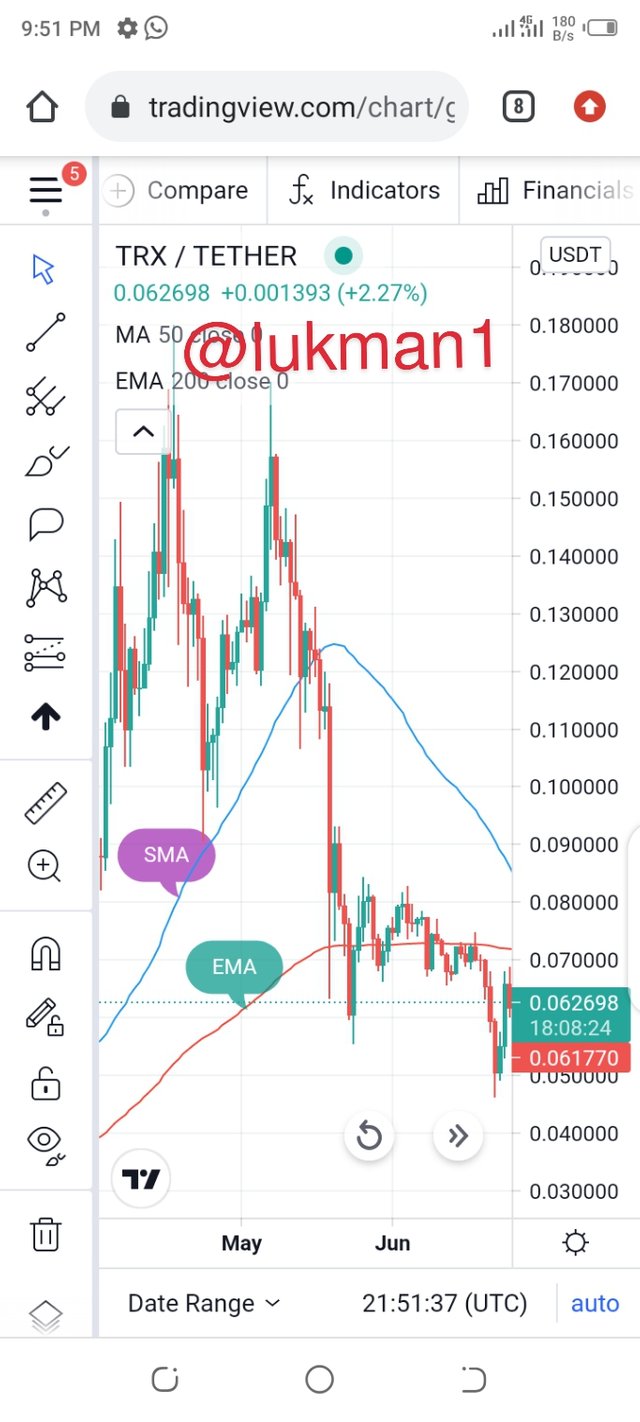
- I chose red as my color. Then click on Ok and go back to your chat. You will realize that the two lines has been modified in your graph as shown below:
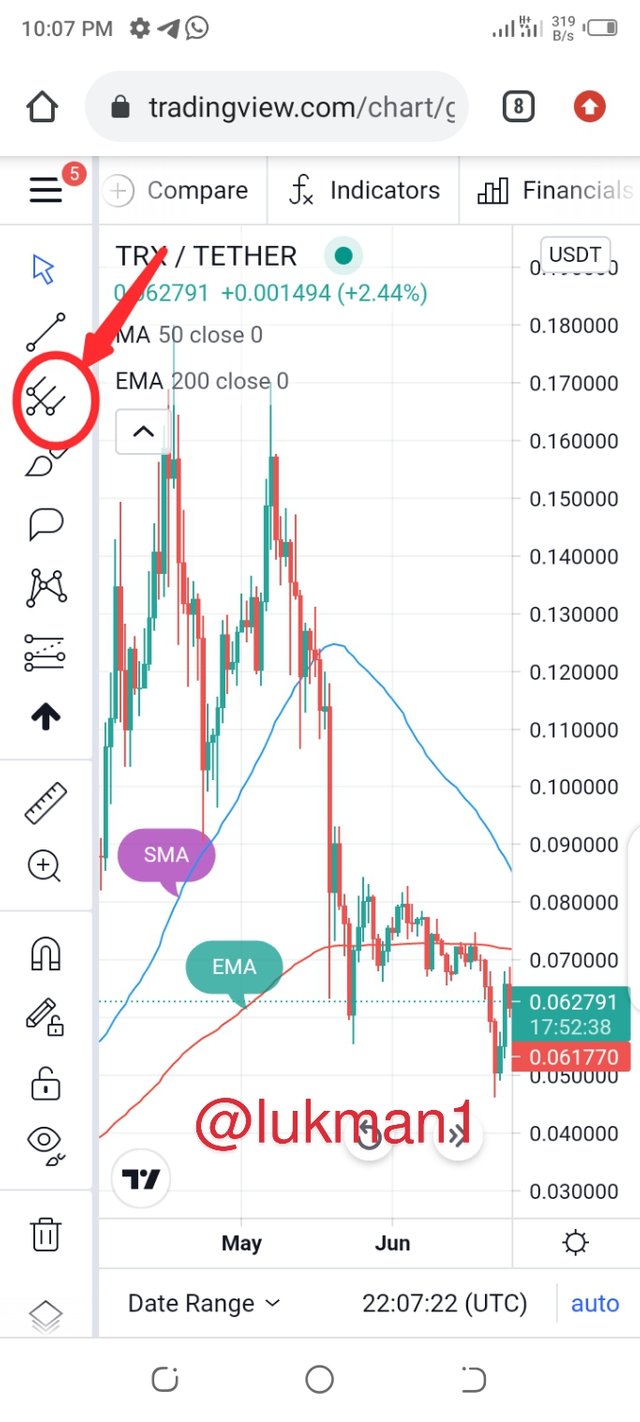
- After you enter the trading view graph, you will see various tools aligned at the left side of the graph. Click on the tool I circled in the screenshot below.
- You will see a number of drop down tools again, click on the Fib retracement I circled below.
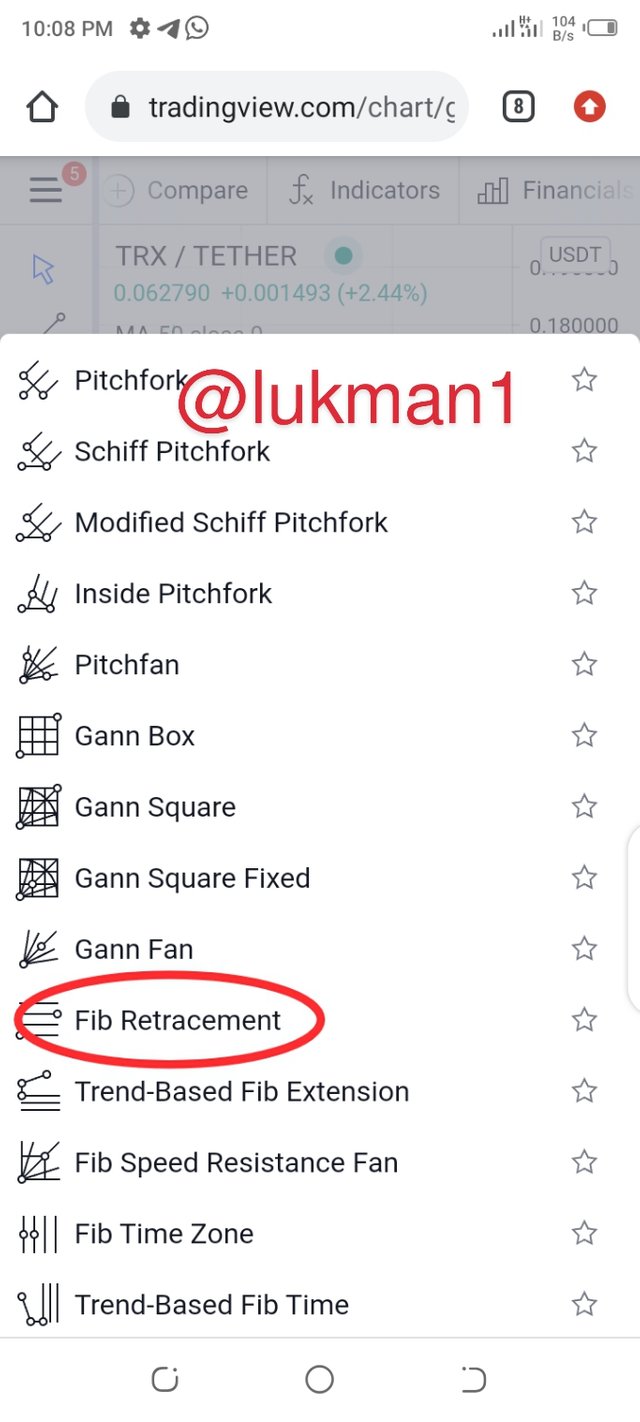
NB: The Fib stands for Fibronacci
- It takes you back to the chart. For bullish retracement, you start the drawing from the swing low to the swing high. It's shown below.
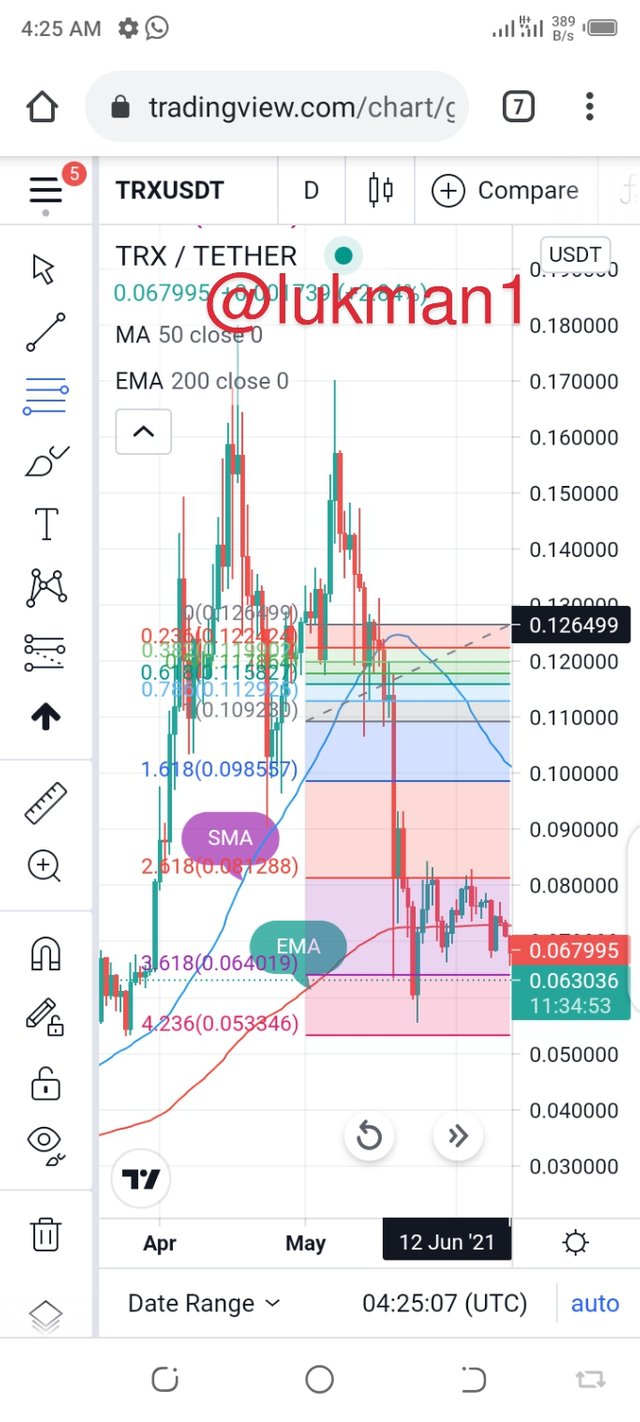
- For bearish retracement, you start the drawing from the swing high to the swing low. It's also shown below.

The moving averages, that's both simple and Exponential moving average together with the Fibonacci retracement are technical tools which assist investors and traders a lot when they want to decide on a market status.
It helps the investors and traders to decide when to enter the market and at the same time when to exit.
Although the EMA moves with recent price well than the SMA, it's calculation is very tedious as compare to the SMA. This compels many investors to prefer the use of SMA when analysing price changes over time.