
The purpose of this publication is to formally deliver my participation in the class developed by professor @kouba01, in compliance with the assigned task and framed within the Temporada 4 corresponding to Week 6 and themed on "Crypto Trading With Chaikin Money Flow Indicator"

1. In your own words, give a simplified explanation of the CMF indicator with an example of how to calculate its value?

The Chaikin Money Flow (CMF) indicator was developed by the famous founder of the Chaikin Analytics trading platform and very popular stock analyst Marc Chaikin, who set out to create a technical indicator that could measure the volume of money flow during a specific period.
Marc Chaikin, in developing the CMF indicator, made the premise that if the stock closes near the high of the session with higher volume, the Chaikin Money Flow indicator will increase in value, while if the price action closes near the low of the session with higher volume, the Chaikin Money Flow indicator will decrease in value.
▶ Technical functionality of the CMF indicator
Specifically, the technical functionality of the Chaikin Money Flow indicator is to determine whether the price action of a financial asset is in an accumulation or distribution zone by comparing the closing price with the maximum-minimum range of the trading session.
The CMF indicator's implied variables are derived from simple statistical elements that allow for the projection of momentum, trend strength, and liquidity of a given market.
▶ Buying pressure or selling pressure
One of the key elements of the Chaikin Money Flow indicator is that it graphically provides visual data that provides guidance on the buying or selling pressure of a security over a given period.
▶ Strength or weakness of price action
The CMF indicator is based on the fact that if the closing price is close to the maximum, an accumulation is evident, while if the closing price is closer to the minimum, a distribution occurs, behaviours that serve as technical guidance to determine the strength, weakness of the price action of a financial instrument.
▶ Reversals or breaks in trends
On the other hand, the CMF indicator, in addition to projecting the strength or weakness of the price action of a financial instrument, also serves as a guide to possible trend reversals or breaks.
▶ Key signals revealed by the CMF indicator
The fundamental signals provided by the CMF technical indicator is that if the indicator is above zero (0) it is interpreted as a bullish signal, while a reading below zero (0) is interpreted as a bearish signal.
▶ Form for calculating the value of the CMF indicator
According to the information socialised in the class of professor @kouba01, and based on the research, the formula for calculating the value of the CMF indicator is as follows:
CMF = [Sum over the period (((Closing price - Minimum price) - (Maximum price - Closing price)) / (Maximum price - Minimum price) x Volume)] / (Total volume over "x" period).
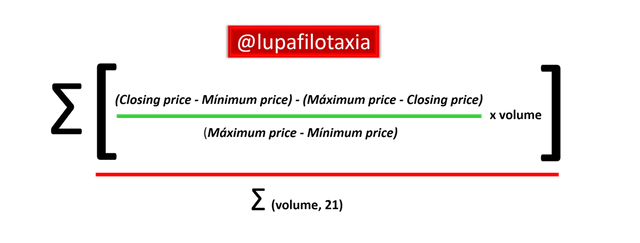
In order to perform the respective calculations, the following three simple steps must be considered:
➀ First, the money flow multiplier is calculated as follows;
Money flow multiplier = [(Closing price - Lowest price) - (Highest price - Closing price)] / (Highest price - Lowest price).
➁ The second is to find the volume of money flow by multiplying the money flow multiplier for "x" associated period, as indicated in the following formula;
Money flow volume = Money flow multiplier x Volume of the period.
➂ Finally, the volume of money flow for "x" period under consideration is summed, and then the value is divided by the sum of "x" period of the volume.
CMF of "x" period = Sum of volume of money flow of "x" period / Sum of volume of "x" period.
As you may have noticed, the way to calculate the value of the CMF indicator is to sum the accumulation or distribution line for "x" periods of a given trade, it is to be emphasised that usually 20 or 21 periods are used to calculate the indicator.
▶ Example of how to calculate the CMF value
In order to comply with the guidelines of the class, I exemplified how to determine the CMF as of 15 October of the current year, for this I considered real data of the price action of the ADA cryptocurrency according to statistical values reported on the Coinmarketcapportal.
DATA:
Maximum price: 2,24
Minimum price: 2,14
Closing price: 2,21
Volume of the period: 3,419,909,583
* Total volume for the period: 61,102,106,25
* Note: All volume values from 25 September to 15 October 2021 were summed.
- Money flow multiplier = [(2,21 - 2,14) - (2,24- 2,21)] / (2,24 - 2,14)
[(0,07) - (0,03)] / (0,1) .
Money flow multiplier = 0,4
- Volume of money flow = 0.4 x 3,419,909,58.
Volume of money flow = 1367963,83
- 21-period Chaikin money flows = 1367963,83 / 61,102,106,25.
21-period Chaikin money flows = 0.022

2. Demonstrate how to add the indicator to the chart on a platform other than the tradingview, highlighting how to modify the settings of the period (best setting). (screenshot required)

Step 1 - 2 - 3 – 4. The first thing to do is to enter the trading portal or platform (in my case I use HUOBI), go to the menu Spot trading, look for the pair you want to trade (in my case I chose ADA/USDT), and click on the tradingview option.
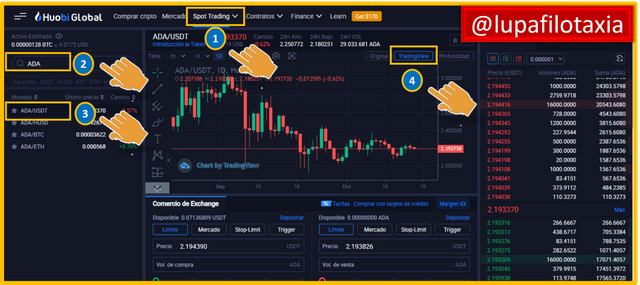
Step 5 – 6. Next, for convenience, ideally click on the full screen, then click on the Index icon and when the options are displayed, click on the Chaikin Money Flow indicator.
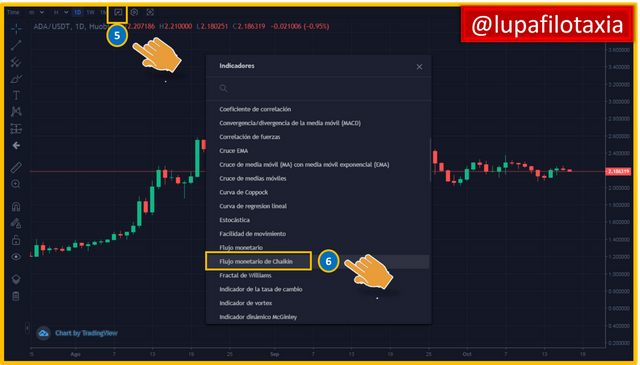
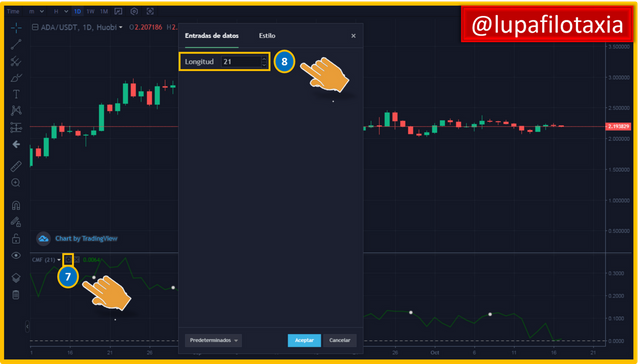
Step 7 – 8. After having attached the Chaikin Money Flow indicator, the next thing to do is to modify in the Data Input option the period configuration that best suits our trading strategy, in my case I chose to modify the automatic configuration of 20 by 21 periods, then I executed style changes.
Step 9 – 10. I then executed style changes, assigning green to the CMF indicator line, red to the zero (0) line, and finally proceeded to click accept.
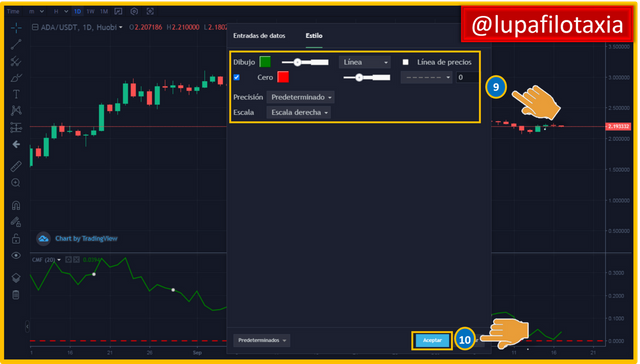
I modified the data entry option from 20 to 21 periods, because although any configuration can be used, I made the change to 21 periods as it generally generates less noise on the daily, weekly and monthly charts, and therefore helps us project a better interpretation of the price action and market trend.
However, in those cases where quick entries and exits are made following the scalping mode, i.e. when very short-term operations are executed, it is advisable to increase the period of the Chaikin Money Flow indicator to values greater than 21 periods, in order to study the previous behaviour of the trend with greater precision.

3. What is the indicator’s role in confirming the direction of trend and determining entry and exit points (buy/sell)؟ (screenshot required)

As mentioned above, Chaikin's Money Flow indicator measures the buying and selling pressure for a given calculation period, thus its technical functionality allows confirming the direction of the trend.
Consequently, when the Chaikin Money Flow indicator develops movements above zero (0) towards the positive zone it indicates that buying pressure exceeds selling pressure, and in the opposite case, when it generates movements below zero (0) towards the negative zone it serves as a guide to associate that selling pressure is greater than buying pressure.
▶ Exit point of sale
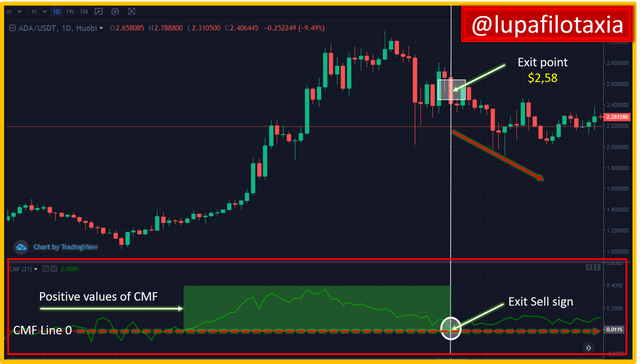
If in a given market we observe an uptrend, and then we observe that the positive values of the Chaikin Money Flow indicator start to decrease towards the zero (0) line and cross with negative values, it is a sign of weakness in the trend and an opportunity to sell.
Note the exit signal and sell point in the ADA/USDT pair above $2.58.
▶ Entry point for purchase
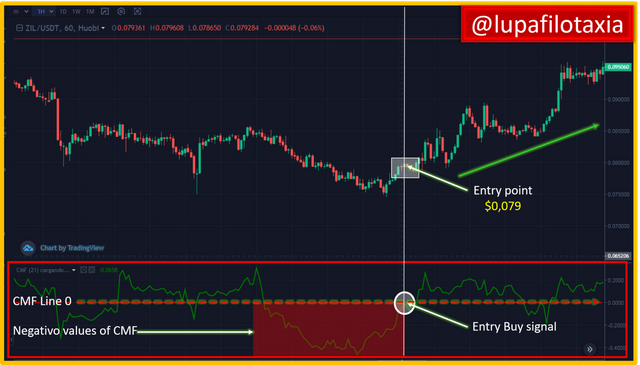
In the opposite case, if we observe a downward trend in a given market, and then we observe that the negative values of the Chaikin Money Flow indicator start to rise towards the zero (0) line and cross with positive values, this is a sign of weakness in the trend and a buying opportunity.
Note the entry signal and buy point on ZIL/USDT near $0.079.

4. Trade with a crossover signal between the CMF and wider lines such as +/- 0.1 or +/- 0.15 or it can also be +/- 0.2, identify the most important signals that can be extracted using several examples. (screenshot required)

▶ TREND BULLISH
TRX/USDT buy signal
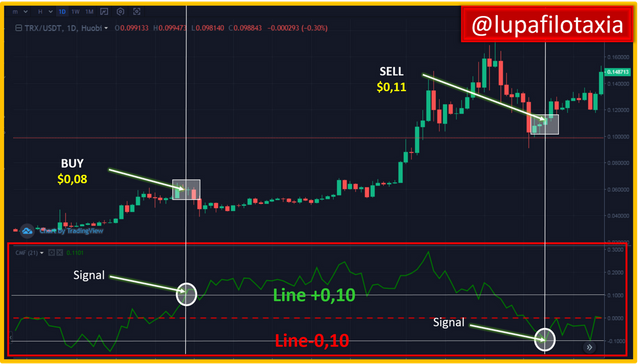
A simple way to visualize a crossover signal between the CMF in an uptrend is to check for a line crossing when the price action enters a correction zone, in my case I decided to locate a +/- 0.10 crossover signal on the TRX/USDT pair, on finding it I marked a buy order at $0.08 when the CMF line crossed the +0.1 line moving from below the -0.10 line, and I marked the exit of the trade at $0.11 when the CMF returned to the -0.10 point.
▶ TREND BEARISH
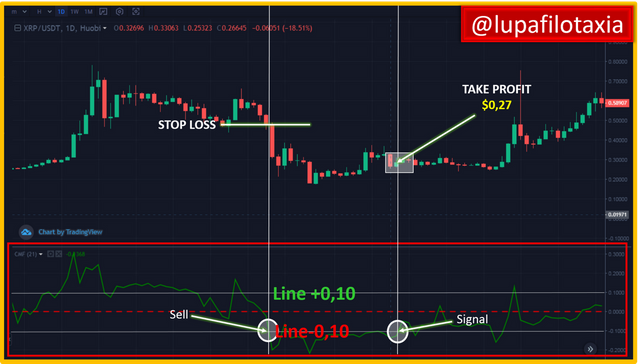
Sell signal on XRP/USDT
In the case of a downtrend, one of the ways to visualize a crossover signal between the CMF, is when the price action makes continuous cycles depreciates and returns to the +0.10 line, but in those cases where after returning to the +0.10 line it breaks strongly towards the zero (0) line and plummets to the -0, 10, behaviour that can be interpreted as a sell signal, in my case I found this signal in the XRP/USDT pair I placed a sell order with stop loss at 0.56 dollars with profit taking at 0.27 dollars before the next change of trend occurs.

5. How to trade with divergence between the CMF and the price line? Does this trading strategy produce false signals?(screenshot required)

As mentioned in previous #CryptoAcademy classes, divergences occur when the graphical readings of technical indicators do not follow the direction of the price action of a given financial instrument.
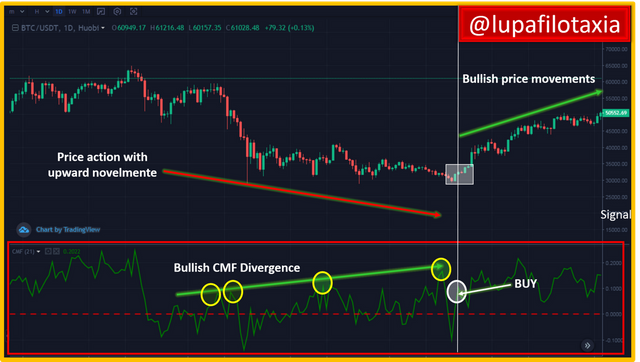
▶ Bullish divergence between the CMF and the BTC/USDT price line
The simplest way to visualise a bullish divergence between the CMF and the price line of any financial instrument is when the CMF indicator reveals a consecutive projection of bullish points above the zero (0) line, while the price action is in a downtrend, which can be interpreted as a weakness of the downtrend and the beginning of an uptrend.
In the following chart I plotted a bullish divergence between the CMF and the BTC/USDT price line.
▶ Bearish divergence between the CMF and the BTC/USDT price line
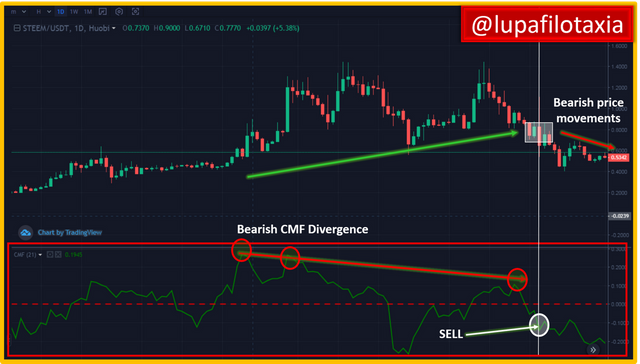
The most classic example of a bearish divergence between the CMF and the price line of any financial instrument is when the CMF indicator reveals a consecutive projection of bearish points, while the price action reaches a higher high, which can be interpreted as a weakness of the uptrend and the beginning of a downtrend.
In the chart below I plotted a bearish divergence between the CMF and the price line of the STEEM/USDT pair.
▶ False signals from the CMF indicator
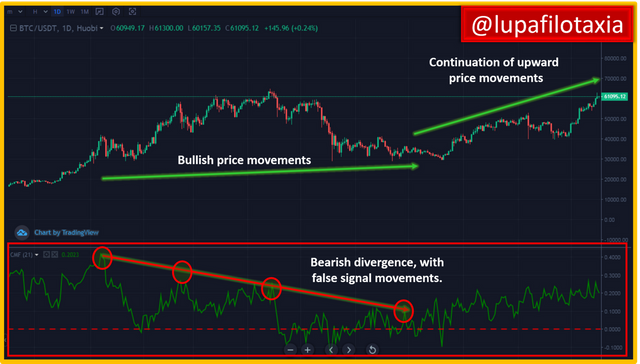
Like any other technical indicator, the Chaikin Money Flow indicator develops movements and often generates false signals, as it lacks other statistical variables of the market that can be analysed by adding other technical indicators to our trading strategy.
Next, I present in the pair BCT/USDT a false signal of the CMF indicator, note that the CMF indicator reveals a downtrend while the price action presents upward movements, note that thereafter the price action at no time was depreciated and on the contrary continues its upward movement, behavior that is subsequently accompanied by the CMF indicator being a clear example of false signal.

6. Conclusion:

The technical functionality of the Chaikin Money Flow indicator serves to reveal that if the price action closes near the high of the session with higher volume, the Chaikin Money Flow indicator will increase in value, while if the price action closes near the low of the session with higher volume, the Chaikin Money Flow indicator will decrease in value.
One of the most useful elements of the Chaikin Money Flow indicator is that in addition to projecting the strength or weakness of the price action of a financial instrument, it also provides guidance on possible trend reversals or breaks.
Among the fundamental signals provided by the CMF technical indicator is that if the indicator is above zero (0) it is interpreted as a bullish signal, while a reading below zero (0) is interpreted as a bearish signal.
The Chaikin Money Flow indicator produces false signals, so it should be used in conjunction with other indicators in order to reduce the risk of losses in our trading strategies.

SOURCES CONSULTED

➊ @kouba01 Crypto Academy Season 4 [ Advanced course ] week 6: Crypto Trading With Chaikin Money Flow Indicator. Link
➋ Tradingsim Chaikin Money Flow Indicator Review. Link

OBSERVATION:

The cover image has been designed by the author: @lupafilotaxia, incorporating a screenshot of the portal: Huobi.com


Hello @lupafilotaxia,
Thank you for participating in the 6th Week Crypto Course in its 4th season and for your efforts to complete the suggested tasks, you deserve a Total|8/10 rating, according to the following scale:
My review :
A good article in which you were able to answer most of the questions ably, and you have some notes that I made.
Chaikins suggests 21 days as the default setting. That corresponds approximately to a trading month. If the number of periods is larger, the indicator is less volatile and less prone to sideways movements. In a weekly or monthly chart, the number of periods should be reduced.
You did not go into depth in answering the third question.
Thanks again for your effort, and we look forward to reading your next work.
Sincerely,@kouba01
Downvoting a post can decrease pending rewards and make it less visible. Common reasons:
Submit