| UAoriginal |
|---|
Цикли оточують людину скрізь, починаючи від повсякденних справ, як-то прокинутись і робити якісь справи, відправитись на роботу, повернутись, лягти спати. Наступного дня дещо схожа картина розділена на певні проміжки діяльності. На фінансових ринках подібні тенденції теж є. Однак можна виділити два основних види: психологічні й об'єктивні. Перший вид більше належати до емоційного стану, котрий починаючись від моменту покупки за кращою ціною із наростаючим оптимізмом в міру зростання вартості активу. Досягаючи ейфорії на вершині ціни, яка може змінюватись протилежною мандрівкою при розвороті й зниження.
Цикли
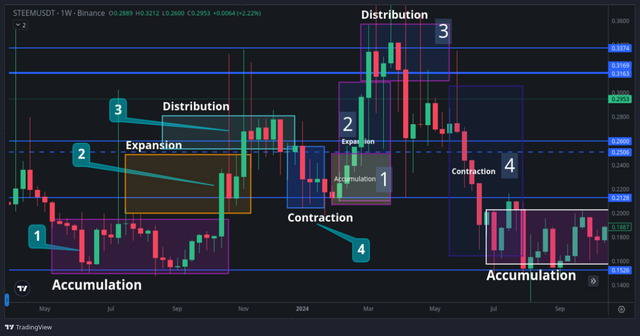
Об'єктивні цикли це цілком охопні явища і складаються із чотирьох фаз, а перша приходить на зміну четвертій, коли дана стадія досягнена. Отже, вони поділяються на:
1 Накопичення - в певному ціновому діапазоні трейдери поступово набирають позиції, наприклад, купують монети в області 0.15-0.19. Можуть і продавати, але обсягів стає більше, як ліквідності й капіталізації. Характерною ознакою може бути вузенький діапазон і відносно стабільна поведінка ціни, бо емоцій також іще не багато. Зазвичай може закладати основу довготривалого тренду.
2 Розширення - вже стає наслідком накопичення, коли до загального ажіотажу приєднується все більше учасників та обсягів торгів, тож активність ще більше зростає і рухає ціну - вона зростає (як розглядати для спот ринку криптовалют). Монета чи криптовалюта отримує значно більше уваги.
3 Розподіл - емоції киплять, ціна зростає і звичайно хочеться забрати свій шматочок пирога. Тож починається фіксація прибутку. Одні учасники продають, а інші охоплені запалом чи ще чимось, купують, але попиту стає багато й ціна пригальмовує. Тренд або стає на паузу для нового накопичення або переходить до наступного циклу.
4 Контракція (зниження) - під час проходження розподілу може стати ясно, що пропозиції забагато, адже хтось забрав профіт, а хтось купив на максимумах, але попиту вже мало. Отже, дійство супроводжується зниженням цін, волатильності й активності.
Якщо сила закладена не сильна, тобто зниження відбувається в рамках корекції по тренду, то буває так, що досвідчені учасники купують саме по кращим цінам після зниження, але це може бути й ризиковано, адже ніяких гарантій немає, що падіння не продовжиться.
Мультитаймфрей аналіз
Аналіз декількох різних часових періодів графіка ціни, дає багато підказок, бо, по-перше, старші довше формують сигнал і показують загальний напрямок, тому не завжди зрозуміло, що буде далі - продовження, флет або розворот. Тож поступово спускаючись до менших, можна побачити зачатки застережливих змін або підтвердження, що все добре й можна тримати монети далі.
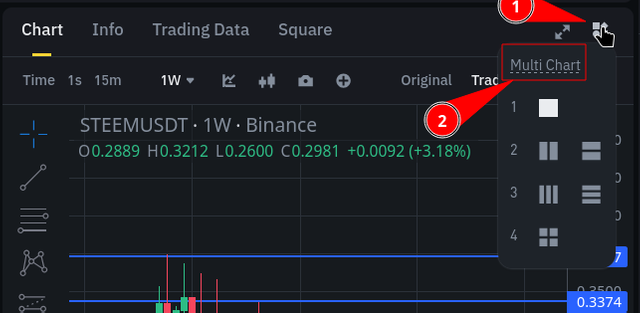
Приклад на веб терміналі Binance. Спочатку краще налаштувати графік, відповідно до стратегії або хоча б нанести потрібну розмітку, індикатори. Загалом те, що допомагає орієнтуватись й робити якісь аналітичні прогнози. Потім натиснути на піктограму "Мультичарт" і обрати 4 відразу, і всі будуть із потрібними параметрами, а потім проводити дослідження, бо кожен окремо налаштувати значно довше.

На одному зображенні у нас 4 часових періоди:
- W1 (загальна картина і сила руху) - має багаторічний боковий канал, де ціна відштовхнулась від дна, сформувавшись M основу. Подолала середину й прямує до верхнього опору, але виглядає це так ніби все добре і ніяких натяків;
- D1 (точність середньострокового тренду) - має виражений висхідний тренд і ніби легку корекцію на вершині, теж ніби все добре;
- H4 (швидші сигнали й настрої) - показує, що там ймовірна розворотна W, хоча вона бува, й ознакою продовження, залежно від ситуації;
- H1 (дає уявлення про перші ознаки змін) - ще точніший і залежно від ситуації, може підказувати що розвороти буде, або корекція затягнеться.
Поєднання циклів ринку із мультитаймфреймовим аналізом
Самі по собі не є самодостатніми, хоча й багато чого підказують, проте поєднання із мультитаймреймовим аналізом дає змогу краще розуміти рух ринку відносно глобальних циклів. А на менших часових проміжках знаходити чіткіші сигнали для входу чи утримання від торгівлі. Це як із хвилями Еліота. Коли одна велика на W1 може містити декілька менших на D1 чи інших.
Ситуація складається саме така.
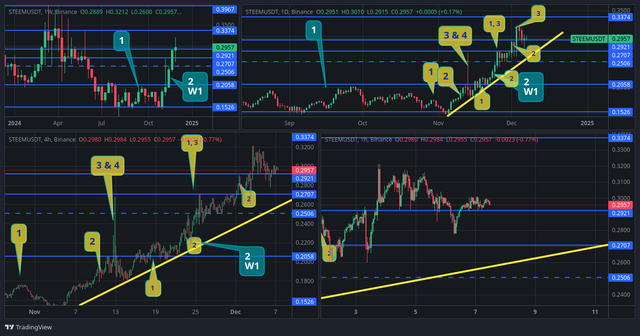
На W1 у нас перша та друга стадія циклу в чистому вигляді - накопичення відбулось і триває бичаче розширення із роздумами над третім.
D1 вже має значно більше й комбінує цикли, адже значно жвавіше проходять деякі стадії, інколи по дві за раз. Спочатку 1, потім 2 дав сильний імпульс до 0.27 із сильним відкатом тож це 3 та 4, а далі поступово висхідний тренд має накопичення та розширення, накопичення та перерозподіл і знову розширення і розподіл.
H4 вже дає цікавіші моменти, наприклад ділянка повторного накопичення після різкого падіння від суміщення циклів 3 & 4. Там у нас фігура "Чашка з ручкою", що дає натяк на продовження тренду і підказку на бичачий настрій із наступним переходом до другого циклу.
Другий момент, це вершина, тобто там де на D1 3 цикл й відбувається корекція. Н4 та Н1 показують ймовірне діставання висхідної лінії тренду десь на позначці 0.27.
Тож висновок такий, що доки на старших періодах, як W1 триває другий цикл і ніби все добре, то на молодших можуть з'являтись інші сигнали, що дає змогу швидше реагувати на зміну ситуації на ринку та реагувати на неї, в той час, коли старші ще не передвіщають змін.
Мінімізація ризиків на волатильному ринку
Продовжуючи попереднє питання, варто зазначити, що різі тайм фрейми мають різну величину сформованих сигналів, тобто на W1 пройдена відстань після настання сигналу може бути 300-1000 пунктів, в той час на молодших 100-300, як і час за який це відбудеться. Молодші ТФ значно швидше це роблять.
Отже, виходячи із цього, в першу чергу розподіл ризиків має це враховувати, щоб було правильне співвідношення стоп лосу до розміру торгової позиції та часового фрейму. І своєчасний моніторинг для супроводу і захисту позицій.
Важливий момент
Значно краще коли ринок спокійний і кожен цикл формується поступово без раптових імпульсів та ривків, котрі залишають великі ниточки від свічок.
Аналіз
Щодо аналізу, то багато залежить від додаткових інструментів чи самих методів. Це означає, що окрім циклів та декількох різних часових проміжків для більшої надійності сигналі, краще це поєднувати з іншими. Залежно від власних уподобань, доступності знань, ефективності та іншого. Це можуть бути Лінії Болінджера для кращого виявлення тренду та його розворотів чи призупинок у парі із фігурами M & W, що по суті буде вказувати на один із циклів. Різні MA, осцилятори і т.д. Чи об'єктивніші дані, як-то настрої:
- "Страху та жадібності" - щоб оцінити до чого більше схильний ринок;
- Сентимент - теж можна припасувати до циклів, оскільки деякі дані накопичуються і формують ясну картинку не відразу. Настроям у соц. мережах та інших даних що входять у сферу цього питання;
- Onchain - дана записані на блокчейні, можуть формувати масив даних із запізненням, хоча початкові тенденції до змін вже можна прослідкувати по активності криптогаманців, кількості транзакцій, сумам переказів та іншому, що добре доповнює цикли;
- Профіль Обсягів - дає змогу бачити виконані обсяги угод із прив'язкою до ціни та напрямком бай/селл. Це теж добре допомагає.
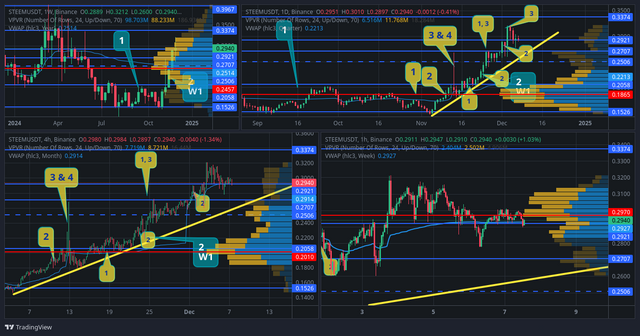
Приклад із доданим Volume Profile:
- W1 період в першому циклі 1, накопичує значно більше покупок, тобто пропозиції менше і ціна зростає (бо ще й крипторинок пожвавився), переходить до другого циклу 2, проходячи область 0.25-0.27 із меншим обсягом, але не відразу.
- D1 дійшовши до третього циклу розподілу, показує не так багато обсягу і слабину до 0.27, що може відправити ціну на тестування трендової підтримки, але сил трохи не вистачає.
- H4 - має ніби рівномірніший розподіл і ситуація залежить також від активності в реальному часі, що буде змінювати ситуація на чиюсь користь.
- H1 - вже показує, що утворилась вершина W, точніше схожа на неї, проте таки потрійна і показано як ціна від 0.32 зайшла під область найбільшого накопичення за грудень (останні 5-7 днів), що теж не однозначно й може підштовхувати тимчасових знижень ближче до 0.27. Отже, оптимально, якщо й робити додаткові покупки, то із тієї області, проте порівнюючи зі старшими таймфреймами та стадій циклів, це не найкраща ідеї й ризик значно виший.
В даному прикладі виходить, що найкращий і безпечніший варіант це як показано на W1, накопичення над сильною підтримкою каналу, дало сильну основу і на молодших ТФ підкріпило бичачою дивергенцією на розворот (в попередніх темах розглядалось). Тобто хороший і сильний сигнал. Ще один хороший був на H4, де між помітками циклів "3 & 4" та наступним "1", утворилась бичача фігура "Чашка із ручкою", котра опираючись на POC область Volume Profile відштовхнулась від неї, заразом і від похилої трендової на 0.2010 і ціна ще добре підросла.
Висновок
Як і в багатьох інших варіантах, значно підвищує шанси на вдалий вхід і отримання прибутку підкріплення та підтвердження додатковими варіантами. Найкраще підбирати декілька інструментів і прописувати це в торговій стратегії або брати вже готову, щоб було декілька основних пунктів - просто й ефективно. Бо багато складного, не завжди дає хороший результат, адже це довші перевірки на аналіз, в той час, коли ринок вже почне рух. Принаймні, з подібною думкою сходиться багато досвідчених трейдерів.
Стратегія "Цикли та мультитаймфрейм"
Часовий період: три-чотири таймфрейми від старшого до молодшого W1,D1,H4,H1 та можна підбирати під себе або дрібніші для скальпінгу всередині дня.
Інструменти аналізу:
- Мультитайфмрейми;
- Цикли ринку;
- Volume Profole;
- Базові лінії підтримки та опору;
- Фігури технічного аналізу.
Основний принцип стратегії
На старших ТФ визначається загальний курс відповідно до циклів, фільтрованих обсягів торгів Volume Profile, рівнів підтримки та опору і сигнали, якщо їх немає, то таким же чином переглядаються молодші ТФ. Після аналізу всіх обраних фреймів, узгоджується даними та сигнали з іншими, щоб визначити потенційні цілі та ризики.
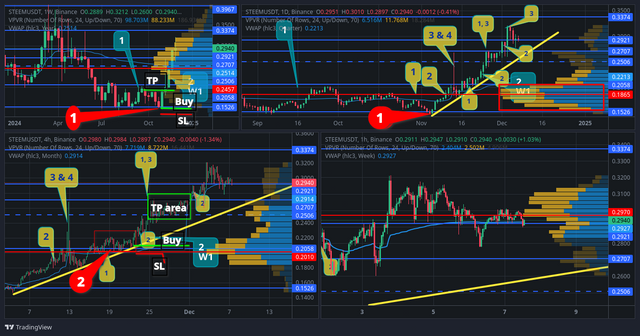
Приклад сигналів для покупки:
1) На W1 хороша підтримка, основа M із натяком на зростання та перший цикл 1 накопичення на нижній підтримці багаторічного каналу. Значно більше обсягів на покупку у Volume Profile. D1 підтримує, але ще не має трендової.
Вхід: 0.1526
Тейк Профіт: 0.24 біля верхнього опору піврічного каналу.
Стоп Лосс: десь на 0.12-0.13 під підтримкою і пропорція хороша.
Трейлінг Стоп: додатково можна встановити активаційну ціну, десь на 1/3 від шляху до тейкпрофіту із відсотком від 2.80 до 3.50%.
Вихід можливий по одному із встановлених параметрів технічно й автоматично або в ручному режимі при серйозних змінах, адже ця угода початкова.
1.1) Майже як і 1 варіант, але вже вище, коли ціна вийде перейде до другого циклу розширення пройшовши цінову область 0.25-0.2520, але там уже орієнтири менші лише 0.27+.
2) Як і перший варіант, виявлено накопичення на W1 і вже триває другий цикл, на D1 є трендова підтримка, тільки внутрішні цикли проходять швидше, тож після повного ланцюжка 1,2,3&4 настала нова стадія накопичення, котре добре видно на H4, яке відбувається після сформованою бичачої фігури "Чашка з ручкою", саме після ручки на трендовій ще трохи є накопичення і додаткова підтримка POC від Volume Profile, щоб були сили пробити попередній імпульс раптового зростання, котрий дуже швидко розпродали від 0.27. Що теж добре.
Вхід по Н4: 0.2060
Стоп Лосс: під трендовою, десь на 0.20-0.1950
Тейк Профіт: в області 0.24-0.27.
Трейлінг Стоп: з активаційною ціною на 0.2150, а відсоток трейлінгу десь 2.5%. і ліміт по 0.2250 (якщо на споті).
Вихід: за досягненням одного із заздалегідь встановлених значень, тобто автоматизовано або вручну при серйозних змінах, як-то пробій трендової та інші важливі показники.
"Про продаж"
Для продажу можуть слугувати протилежні сигнали, коли ціна рухається реверсивно переходячи від 3 до 4 циклу у стадію зниження під сильні області або цінові рівні підкріпленні великим наторгованим обсягом. По суті для спот торгівлі в класичному варіанті, слугують як сигнали для фіксації прибутку шляхом обміну STEEM на USDT.
Для ф'ючерсів ця стратегія в прямому застосуванні не підійде, бо там чомусь не показує профіль обсягу, хоча може це лише у конкретного провайдера надання послуг, тобто йому не передаються дані із біржі і потрібно який сторонній термінал застосовувати або просто моніторити ситуацію на споті із приблизним перенесенням цінових орієнтирів на ф'ючерс, там різниця в цінах не велика.
Коментар до стратегії
Якщо брати до уваги інші методи аналізу та матеріал, що розглядались на попередніх тижнях челенджу Crypto Academy, то можна виявити, що сигнали будуть кращі, якщо брати до уваги, наприклад дивергенцію, бо на D1 вона там саме присутня, на початку трендової лінії. Що давало значно кращий і вчасний сигнал для підтвердження покупки. Адже навіть M основа і бичаче поглинання на W1 ще не були достатньо затверджені й вступили б в силу десь по завершенні тижня, що по факту (в нашому випадку вже біля верхнього опору каналу після декількох сотень пунктів пройденого шляху). Тож поєднуючи декілька методів аналізу, цикли та мультитаймфреймовий огляд, можна краще визначити як початок, так і силу руху, щоб знайти найкращу точку входу або своєчасно вийти.
Використані матеріали та ресурси:
- Всі знімки екранів зроблені на Binance, постачальних послуг TraidingView.
- Головне зображення, це відредагований знімок екрана.
- Консультація та допомога ШІ.
- learn.bybit.com "What Do the Market Cycles in Crypto Tell You?"
| ENtranslated by AI |
|---|
Cycles surround people everywhere, starting from everyday tasks like waking up and doing some chores, going to work, coming back, and going to sleep. The next day, a somewhat similar pattern is divided into certain intervals of activity. Similar tendencies also exist in financial markets. However, two main types can be distinguished: psychological and objective. The first type is more related to the emotional state, which starts from the moment of buying at the best price with increasing optimism as the asset's value grows. Reaching euphoria at the price peak, which can change with the opposite journey during a reversal and decline.
Cycles
Objective cycles are comprehensive phenomena and consist of four phases, with the first phase replacing the fourth when that stage is reached. They are divided into:
1 Accumulation - within a certain price range, traders gradually build up positions, for example, buying coins in the 0.15-0.19 area. They may also sell, but the volumes become larger, as do liquidity and capitalization. A characteristic feature may be a narrow range and relatively stable price behavior, as emotions are not yet abundant. It can usually lay the foundation for a long-term trend.
2 Expansion - this becomes a consequence of accumulation, when more and more participants and trading volumes join the general excitement, so activity increases even more and drives the price up (as considered for the spot cryptocurrency market). The coin or cryptocurrency receives much more attention.
3 Distribution - emotions are boiling, prices are rising, and of course, everyone wants to take their piece of the pie. Thus, profit-taking begins. Some participants sell, while others, caught up in enthusiasm or something else, buy, but demand becomes abundant, and the price slows down. The trend either pauses for new accumulation or transitions to the next cycle.
4 Contraction (decline) - during the distribution phase, it may become clear that there is too much supply, as some have taken profits while others bought at the peaks, but demand is already low. Thus, the event is accompanied by a decrease in prices, volatility, and activity. If the underlying strength is not strong, meaning the decline occurs within the framework of a trend correction, it sometimes happens that experienced participants buy at better prices after the decline, but this can also be risky, as there are no guarantees that the fall will not continue.
Multi-timeframe Analysis
Analyzing several different time periods of the price chart provides many clues because, firstly, longer timeframes take longer to form signals and show the overall direction, so it is not always clear what will happen next - continuation, flat, or reversal. Gradually descending to smaller timeframes, one can see the beginnings of cautionary changes or confirmations that everything is fine and one can hold onto their coins further.

An example on the Binance web terminal. First, it is better to set up the chart according to the strategy or at least apply the necessary markings and indicators. In general, anything that helps to navigate and make some analytical forecasts. Then click on the "Multi-chart" icon and select 4 at once, and all will have the necessary parameters, and then conduct research, as setting each one up individually takes significantly longer.

In one image, we have 4 time periods:
- W1 (overall picture and strength of movement) - has a multi-year sideways channel where the price bounced off the bottom, forming an M base. It has overcome the midpoint and is heading towards the upper resistance, but it looks like everything is fine with no hints;
- D1 (accuracy of the medium-term trend) - has a pronounced upward trend and seemingly a slight correction at the top, also appears to be fine;
- H4 (faster signals and sentiments) - shows that there is a probable reversal W, although it can also be a sign of continuation, depending on the situation;
- H1 (provides insight into the first signs of changes) - even more precise and, depending on the situation, can suggest that there will be reversals or that the correction will be prolonged.
Combining Market Cycles with Multi-Timeframe Analysis
On their own, they are not self-sufficient, although they provide many clues; however, combining them with multi-timeframe analysis allows for a better understanding of market movement relative to global cycles. On smaller timeframes, it helps to find clearer signals for entry or to refrain from trading. It's like with Elliott waves. When one large wave on W1 can contain several smaller ones on D1 or others.
The situation is as follows.

On W1, we have the first and second stages of the cycle in pure form - accumulation has occurred, and a bullish expansion is ongoing with considerations for the third.
D1 already has significantly more and combines cycles, as some stages pass much more briskly, sometimes two at a time. First, 1, then 2 gave a strong impulse to 0.27 with a strong pullback, so this is 3 and 4, and then gradually the upward trend has accumulation and expansion, accumulation and redistribution, and again expansion and distribution. H4 already provides more interesting moments, for example, the area of re-accumulation after a sharp decline from the combination of cycles 3 & 4. There we have the "Cup and Handle" pattern, which hints at a continuation of the trend and suggests a bullish sentiment with the subsequent transition to the second cycle.
The second moment is the peak, where on D1 cycle 3 occurs and a correction takes place. H4 and H1 show the probable reaching of the ascending trend line somewhere around the 0.27 mark.
Thus, the conclusion is that as long as the second cycle continues on higher periods like W1 and everything seems fine, other signals may appear on lower timeframes, allowing for quicker reactions to changes in the market situation while the higher timeframes have not yet predicted changes.
Minimizing Risks in a Volatile Market
Continuing from the previous point, it is worth noting that different timeframes have varying magnitudes of formed signals, meaning that on W1 the distance traveled after a signal occurs can be 300-1000 points, while on lower timeframes it can be 100-300, as well as the time it takes for this to happen. Lower timeframes accomplish this much faster.
Therefore, based on this, the distribution of risks should primarily take this into account to ensure a proper ratio of stop loss to the size of the trading position and the timeframe. Timely monitoring is also essential for supporting and protecting positions.
Important Point
It is significantly better when the market is calm and each cycle forms gradually without sudden impulses and spikes that leave long wicks on the candles.
Analysis
Regarding analysis, much depends on additional tools or methods themselves. This means that besides cycles and several different time intervals for greater reliability of signals, it is better to combine this with others. Depending on personal preferences, availability of knowledge, effectiveness, and so on. These can be Bollinger Bands for better trend detection and its reversals or pauses in conjunction with M & W patterns, which essentially indicate one of the cycles. Various MAs, oscillators, etc. Or more objective data, such as sentiments:
- "Fear and Greed" - to assess what the market is more inclined towards;
- Sentiment - can also be aligned with cycles, as some data accumulates and forms a clear picture not immediately. This includes sentiments on social media and other data relevant to this issue;
- On-chain - data recorded on the blockchain can form a dataset with a delay, although initial trends towards changes can already be traced through the activity of crypto wallets, the number of transactions, transfer amounts, and other factors that complement the cycles well;
- Volume Profile - allows you to see executed trade volumes tied to price and the direction of buy/sell. This also helps significantly.

Example with added Volume Profile:
- The W1 period in the first cycle 1 accumulates significantly more purchases, meaning there is less supply and the price rises (especially as the crypto market has revived), transitioning to the second cycle 2, passing through the area of 0.25-0.27 with lower volume, but not immediately.
- D1, upon reaching the third cycle of distribution, shows not much volume and weakness at 0.27, which could send the price to test the trend support, but there is a bit of a lack of strength.
- H4 - has a seemingly more uniform distribution, and the situation also depends on real-time activity, which will change the situation in someone's favor.
- H1 - already shows that a W peak has formed, or rather resembles one, but it is still triple, and it is shown how the price from 0.32 has entered the area of the largest accumulation for December (the last 5-7 days), which is also ambiguous and may push for temporary declines closer to 0.27. Therefore, optimally, if additional purchases are to be made, it should be from that area; however, comparing with higher timeframes and stages of cycles, this is not the best idea, and the risk is significantly higher.
In this example, the best and safest option is as shown on W1, where accumulation above a strong support level of the channel provided a solid foundation, and on lower timeframes, it was reinforced by a bullish divergence at the reversal (discussed in previous topics). This indicates a good and strong signal. Another good signal was on H4, where between the cycle markers "3 & 4" and the subsequent "1," a bullish "Cup and Handle" pattern formed, which bounced off the POC area of the Volume Profile, as well as from the sloping trend line at 0.2010, and the price has risen well.
Conclusion
As in many other cases, having reinforcement and confirmation from additional options significantly increases the chances of a successful entry and profit. It is best to select several tools and incorporate them into a trading strategy or use a ready-made one to have several key points—simple and effective. Because a lot of complexity does not always yield good results, as it requires longer checks for analysis, while the market may already start moving. At least, many experienced traders agree with this perspective.
Strategy "Cycles and Multi-Timeframe"
Timeframe: three to four timeframes from higher to lower W1, D1, H4, H1, and you can adjust to smaller ones for intraday scalping.
Analysis tools:
- Multi-timeframes;
- Market cycles;
- Volume Profile;
- Basic support and resistance lines;
- Technical analysis patterns.
Main Principle of the Strategy
On higher timeframes, the overall trend is determined according to the cycles, filtered trading volumes from the Volume Profile, support and resistance levels, and signals. If there are no signals, the same approach is applied to review lower timeframes. After analyzing all selected frames, the data and signals are aligned with others to identify potential targets and risks.

Example of Buy Signals:
1) On W1, there is good support, an M base with a hint of growth, and the first cycle of accumulation at the lower support of the multi-year channel. There are significantly more buying volumes in the Volume Profile. D1 supports this but does not yet have a trend line.
Entry: 0.1526
Take Profit: 0.24 near the upper resistance of the semi-annual channel.
Stop Loss: somewhere around 0.12-0.13 below the support, providing a good risk-reward ratio.
Trailing Stop: additionally, an activation price can be set at about 1/3 of the way to the take profit with a percentage from 2.80% to 3.50%.
Exit can occur based on one of the established parameters either technically and automatically or manually in case of significant changes, as this trade is initial.
1.1) Almost like option 1, but higher, when the price moves into the second cycle of expansion after passing the price area of 0.25-0.2520, but there the targets are smaller, only 0.27+.
2) Similar to the first option, accumulation is detected on W1, and the second cycle is already underway. On D1, there is trend support, but the internal cycles are progressing faster, so after the complete chain of 1, 2, 3 & 4, a new accumulation stage has begun, which is clearly visible on H4. This occurs after the formation of a bullish "Cup and Handle" pattern, specifically after the handle, where there is still some accumulation on the trend line and additional POC support from the Volume Profile, providing the strength to break through the previous impulse of sudden growth that was quickly sold off from 0.27. This is also a positive sign.
Entry on H4: 0.2060
Stop Loss: below the trend line, around 0.20-0.1950
Take Profit: in the area of 0.24-0.27.
Trailing Stop: with an activation price at 0.2150, and the trailing percentage around 2.5%, with a limit at 0.2250 (if on spot).
Exit: upon reaching one of the pre-established values, either automatically or manually in case of significant changes, such as a breakout of the trend line and other important indicators.
"About Selling"
For selling, the opposite signals can serve when the price moves reversely transitioning from cycle 3 to 4 into a declining stage under strong areas or price levels supported by large traded volumes. Essentially, for spot trading in the classic sense, these serve as signals for profit-taking by exchanging STEEM for USDT.
For futures, this strategy is not directly applicable, as it does not show the volume profile for some reason, although this may only be the case with a specific service provider, meaning that data from the exchange is not transmitted to them, and it is necessary to use some third-party terminal or simply monitor the situation on the spot with approximate price level transfers to the futures, where the price difference is not significant.
Comment on the Strategy
Considering other analysis methods and materials discussed in previous weeks of the Crypto Academy challenge, it can be observed that signals will be better if, for example, divergence is taken into account, as it is present on D1 at the beginning of the trend line. This provided a significantly better and timely signal for confirming the purchase. Even the M base and bullish engulfing on W1 were not yet sufficiently confirmed and would come into effect somewhere by the end of the week, which in our case was already near the upper resistance of the channel after several hundred points of movement. Thus, by combining several analysis methods, cycles, and multi-timeframe reviews, one can better determine both the beginning and the strength of the movement to find the best entry point or exit in a timely manner.
Materials and Resources Used:
- All screenshots taken on Binance, provided by TradingView.
- The main image is an edited screenshot.
- Consultation and assistance from AI.
- learn.bybit.com "What Do the Market Cycles in Crypto Tell You?"
#ukraine #cryptoacademy-s21w6 #club5050 #crypto #steem #usdt
