| UAoriginal |
|---|
Штучний інтелект розроблений як аналог людського. Котрий є комплексним механізмом, а Машинне Навчання одним із компонентів. МН відповідає за навчання, аналіз, збір даних та багато. Хоча й може використовуватись як окремий модуль. Його навчальна база може робитись власноруч і займати від декількох мегабайтів до терабайтів даних. ШІ як цілісна структура з інтегрованим підрозділом МН, виконує значно більше задач.
Використання ШІ та МН має свої переваги, у порівнянні зі звичайною автоматизованою торгівлею чи торговими роботами, а саме:
- Робота із великим обсягом даних;
- Багатокомпонентна торгова стратегія, щоб краще реагувати на події;
- Швидкість обробки інформації та прийняття рішень;
- Автономність роботи без участі людини.
Недоліки:
- Складність налаштування - якщо збирати й вчити модель з нуля;
- Потреба у додаткових ресурсах обчислювальної потужності чи встановлення на сервері за додаткову плату;
- Якісні дані та їх безперебійне постачання, бо від їх якості й точності, залежить результат;
- Ніхто не застрахований від збоїв та всіх ризиків від використання ШІ, як в його роботі, так і в самій роботі коду через різні фактори й причини;
- Потреба в спеціалізованих знаннях - багато залежить від профільних знань, якщо не використовувати готові рішення.
Як це діє? Наприклад, метод торгівлі, котрий базується на відстежуванні торгових обсягів у реальному часі. Це такий де багато, багато цифр вхідних даних. Там великий обсяг інформації може циркулювати безперервним потоком. Людині треба постійно за цим слідкувати й чекати сигналу (настання умови). А якщо підрядити ШІ із навченою базою. Він буде моніторити самостійно і коли треба керувати угодами. Рішення значно легше. Вимагає менше людського часу. Це знижує напруження та перенасичення інформацією та загальну втому. Тільки треба це все організувати, а це не просто. Водночас проста алгоритмічна торгівля чи торгові роботи (ще до ШІ), послуговуються меншою кількістю даних. Найпростіші, це зміна ціни від попередньої, перетин MA та інші. Такі події де не велика кількість даних в реальному часі, впливала на торгову операцію. ШІ із МН дає гнучкішу модель автономного аналізу й торгівлі. Бер до уваги значно більше показників та інформації (залежно як реалізовано), щоб отримати прибуток і краще управляти ризиками.
Створення простої моделі прогнозування (Linux)
Насправді це широка тема і просто охопити все одним питанням, не вийде. Інформації багато, адже це різні деталі, нюанси та особливості. Щоб все зрозуміти правильно та налатувати й навчити модель потрібно достатньо знань. Якими не володію повною мірою. Тож це лише поверхневий приклад для ознайомлення із функціонування моделі, на яку без отриманого досвіду й навичок, навіть ризиковано покладатись, бо дані можуть бути інтерпретовані не правильно.
На Linux покрокове створення моделі прогнозування на основі scikit-learn виглядає наступним чином:
Потрібно щоб був встановлений python, бо наступна команда для нього, щоб завантажити й інсталювати додаткові бібліотеки й scikit-learn.
pip install pandas numpy scikit-learn matplotlib seaborn xgboostseaborn - це для візуалізації даних;
xgboost - покращена робота з даними і їх обчислення.Після введення команди завантажаться дані та модулі, приблизно 500 Mb.
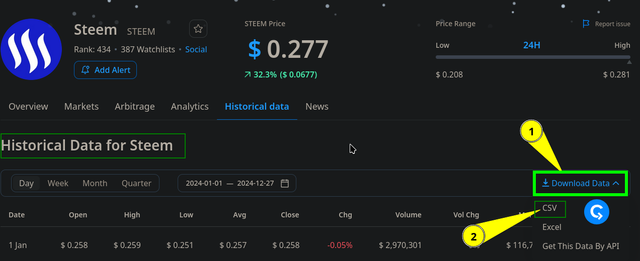
Підготовка вхідних даних. Можуть бути різні варіанти, як і пряме отримання в реальному часі. Проте для прикладу завантажується STEEM/USDT за рік від 01.01 по 27.12.2024 із періодом D1. Файл CSV (https://cryptorank.io/price/steem/historical-data), хоча там є пропозиція отримувати їх через API. Його потрібно помістити в окрему теку.
Створення скрипта
name_script.pyв теці розміщення файлу. Спеціальний код прописаний саме під формат завантаженого файлу та структури даних в ньому, а ім'я його теж було змінено на steem_usdt_data.csv (бо так було простіше в процесі багатьох спроб і перевірок коду).Робиться звичайний текстовий файл, туди вставляється код і все зберігається тільки прописується закінчення після крапки не
.txt, а.py(асоціативний ярличок файлу теж зміниться).
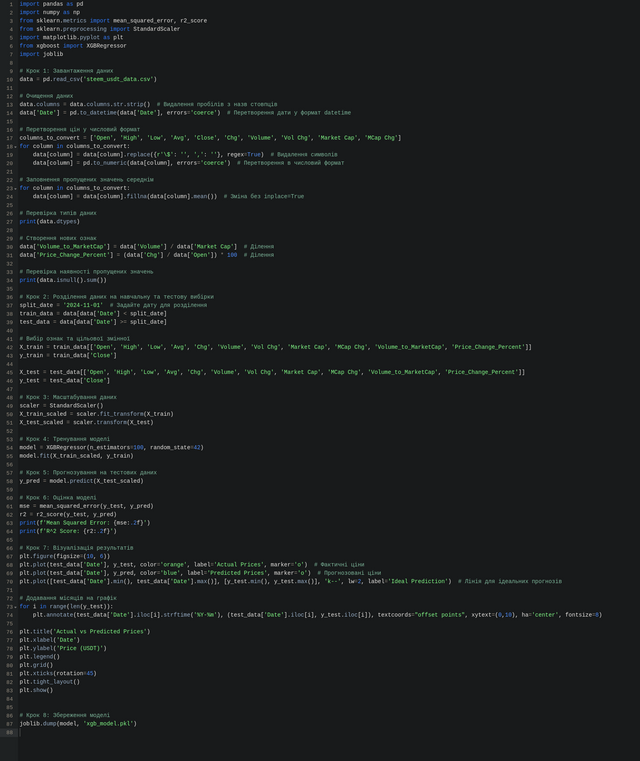
В скрипті вже передбачено очищення даних, щоб вони були правильно розподілені та відсортовані для розуміння їх машиною та правильною обробкою (наскільки це правильно зроблення поняття не маю, тому це приклад для ознайомлення і нічого більше, тобто не слід це сприймати як вдалий зразок для наслідування). Всі детальні кроки, там теж пояснено, що за чим і які дії та компоненти виконуються. Тож на зображенні коду все детально є, воно відкривається у повний розмір, а сам код буде розміщено у коментарях, як додаткові матеріали.Також детальне технічне пояснення від ШІ кожного кроку, щоб зрозуміліше.

Запуск скрипта в теці розміщення 1. Відкриття звідти терміналу 2. Введення команди 3:
python name_script.py
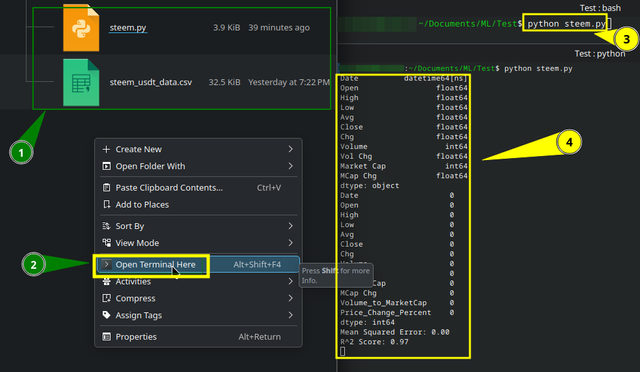
Побіжать цифри й буде виведено результат 4 і візуалізація.
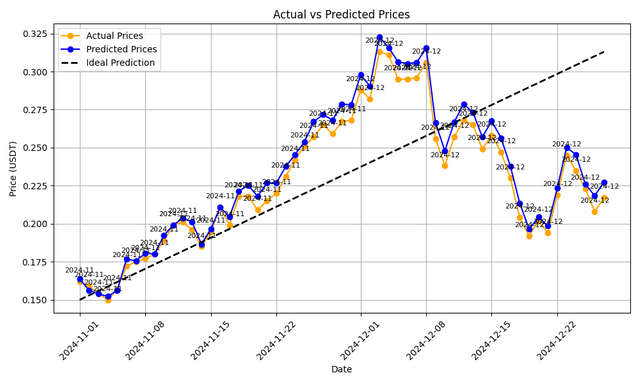
Інтерпретація результату.
Оскільки дані в процесі навчання було розділено на навчальні та тестові, то тестові прогнози відображено за менший період часу, а позначення мають наступне пояслення:- пунктирна лінія, це ідеальний прогноз зростання;
- сині кружечки, це фактичні дані;
- жовті кружечки, це прогноз моделі.
Показники:
- Mean Squared Error: 0.00 - вказують, що ці дані в реальних умовах постійного надходження даних майже ніколи не досягає нуля й може бути ознакою перенавчання чи використання тестових даних для навчання.
- R^2 Score: 0.97 - модель прогнозує та розуміє майже всі змінні та добре виконує їх обробку.
Автоматизований аналіз торгових настроїв (Linux)
Не далеко відходячи від попереднього питання, можна розкрити й наступне. Принцип той же, потрібно встановити необхідні бібліотеки, ШІ підкаже як для NLTK та VADER все встановити (можна просто скопіювати цей текст і запитати, як це все встановити, якщо потрібно й буде готова інструкція). Мати простий код, та створити скрип для пітона із розширенням .py, аналогічно як описано вище, у нього помістити код. Команда запуску:
python name_script.py
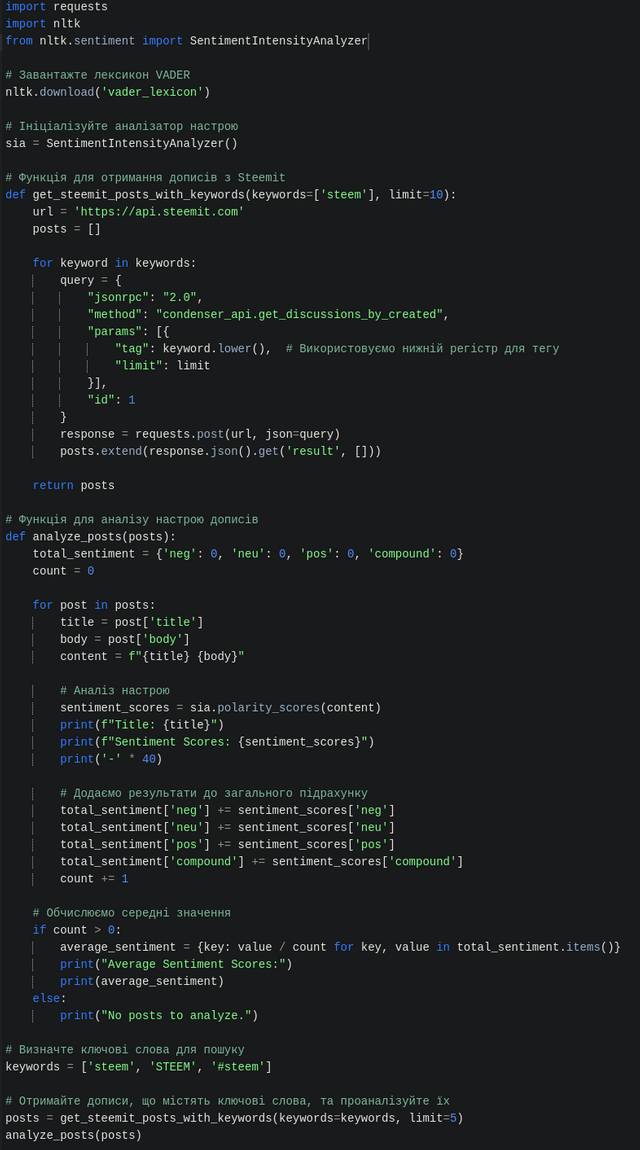
Код вже налаштовано для взяття даних із Steem через API та узагальнення результату, щоб була зрозуміла загальна думка.
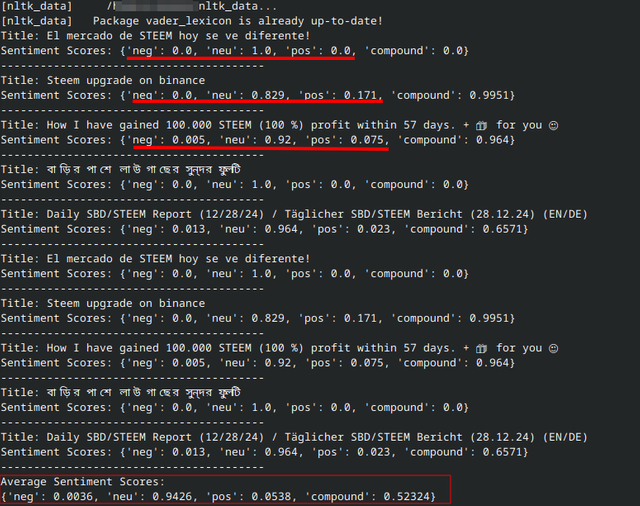
Як видно, виведення у терміналі, не дуже зручно, й не гарно, проте надає якусь зібрану інформацію де згадується STEEM.
Графічний вивід через браузер
Щоб було зручніше й красивіше можна використати Streamlit. Що дозволяє виводити картинку у браузері та взаємодіяти у зручному режимі, навіть вводити слова та шукати й за іншими ключами, не змінюючи код.
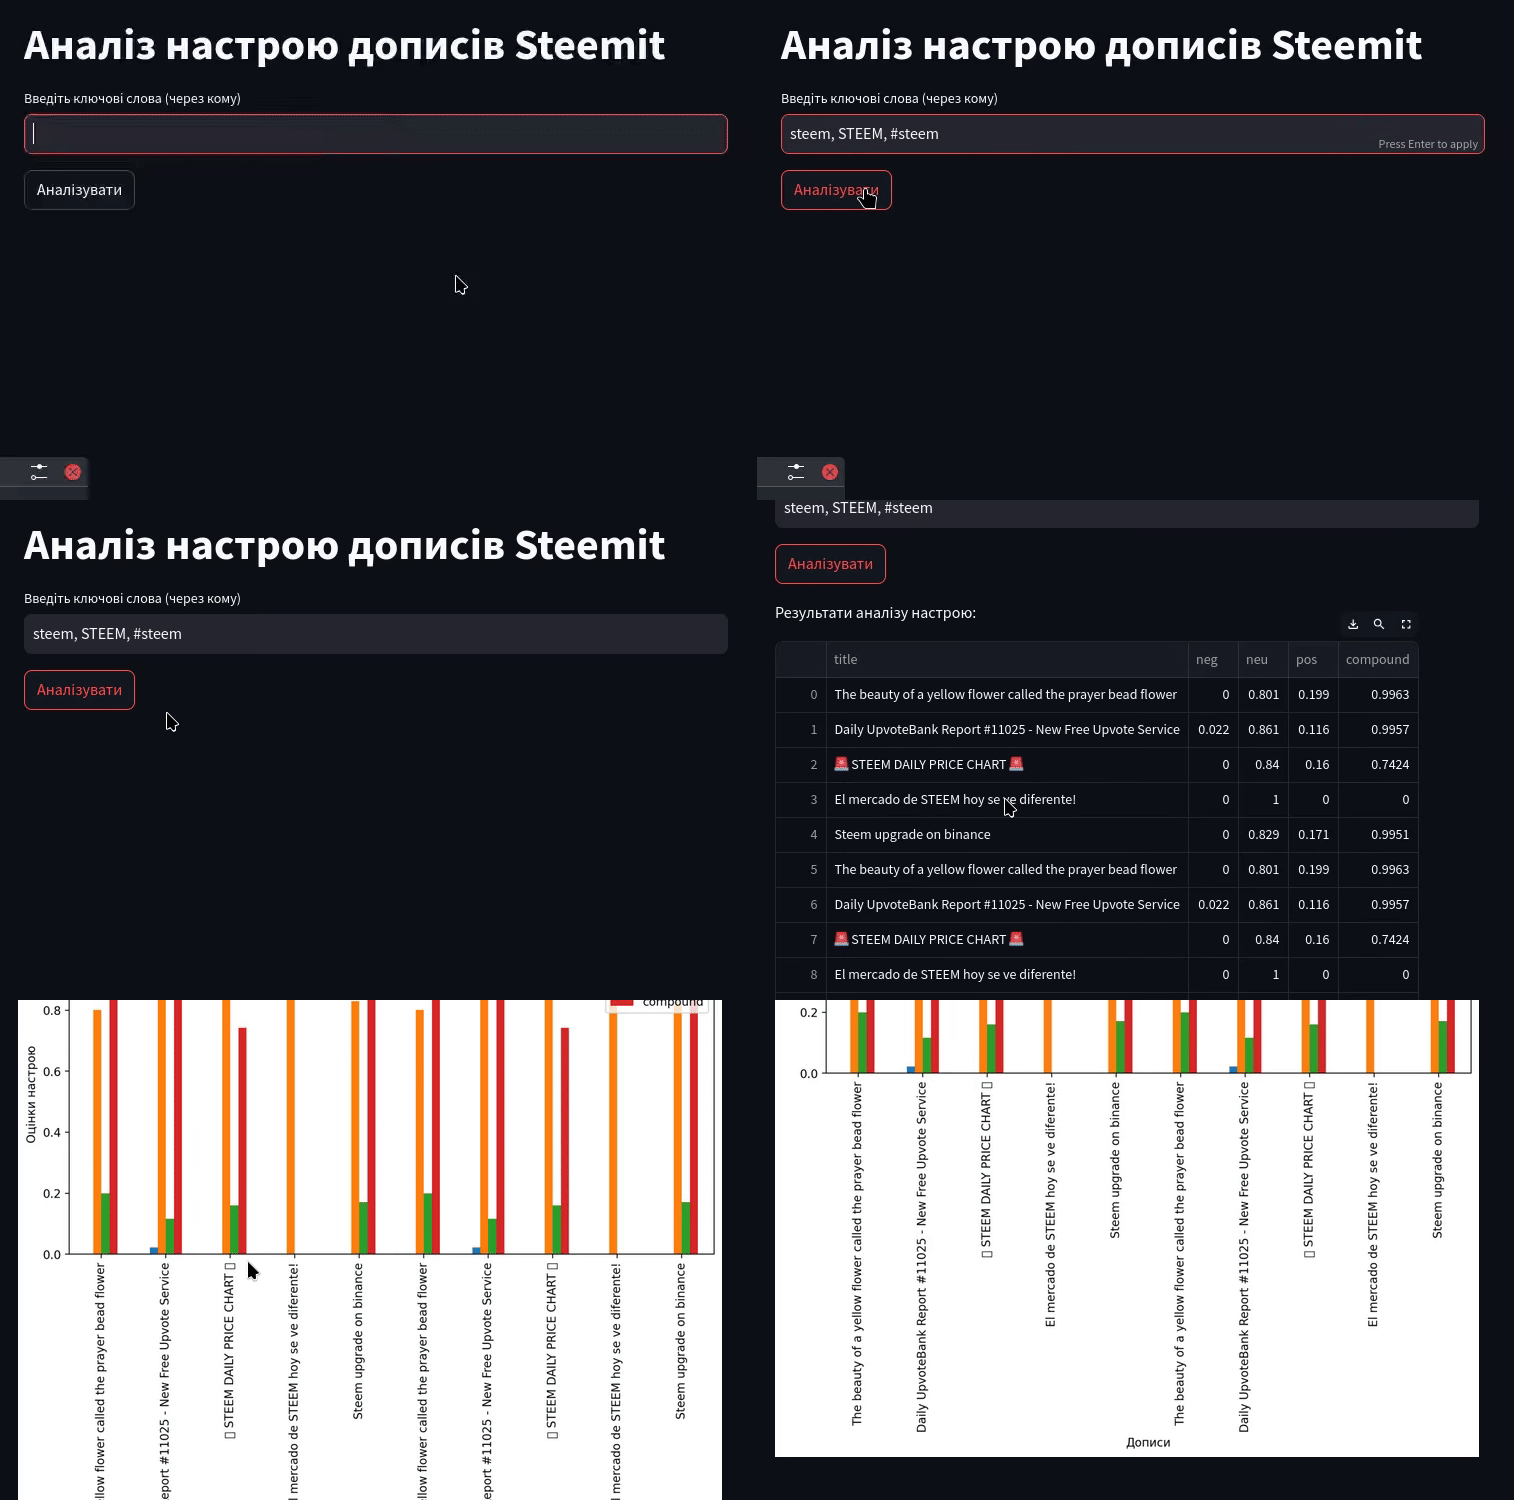
Тож після додавання ключів у поле пошуку, й підтвердження аналізу, виведе результат. Проте на steemit, не так вже й багато інформації про настрої, хоча механізм можна перенести на інші платформи, де більше активності, як-то Binance Square чи Coin Market Cap. Тільки там складніший механізм отримання даних.
Вплив настроїв на поведінку, та корегування стратегії для STEEM/USDT
Погравшись із кодом та всім іншим, видавало навіть такі результати, де показувало взятий текст із binance.com/en/square та аналізуючи присвоювало показник близький до 1.00, як на зображенні нижче. Й таких повідомлень із хештегом STEEM багатенько, що повідомляє про оптимізм покупців, ціна теж реагувала зростанням. Тобто це відбувається або до початку нового бичачого пожвавлення, або в процесі як оптимістичні настрої для росту монети.
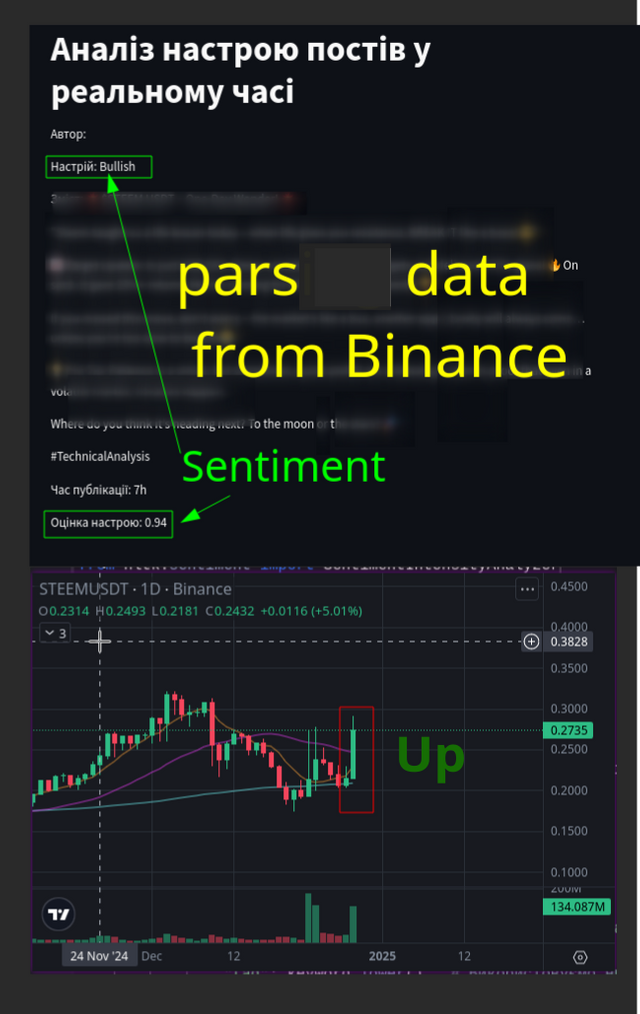
Тож буває вигідно придивитись до загальних настроїв, але не завжди. Однак, STEEM ставала дорожчою (доки допис робився від 0.26-27 сягнуло 0.38), на цьому фоні. Логічний висновок можна зробити й про зміну настрою на ведмежий, що тоді купляти на вершині буде не вигідно.
Автоматизована торгова стратегія на основі ШІ та машинного навчання
Просто продовжуючи попередні питання, можна прийти до одного із висновків, що Python дає можливість реалізувати автоматизовану систему. Тільки вона буде включати дещо більше скриптів, ніж було задіяно раніше у тексті, де було надано приклад Машинного Навчання та прогнозування.
З одного боку це просто. Треба створити структуру зі скриптів, де кожен буде відповідати за свої функції, тобто матиме прописаний код для виконання певних завдань.
Насправді тут просто не буде, бо це масштабний процес із застосування технічних знань і різних нюансів, котрі вимагають профільних знань, що не можна розкрити в одному дописі невеликого питання. Ними також потрібно володіти. Тому представлені проєкти лише образний шаблон, для розуміння, як приблизно це може бути реалізовано й функціонувати. Також це передбачає встановлення різних додаткових бібліотек, модулів, нейромереж, машинних систем і багато іншого. Що буде залежати від доступних потужностей та знань і можливостей, щоб це впровадити, тому це не про легкий шлях. По суті трейдинг ніколи ним і не був, особливо автоматизований. Є інші варіанти, які можуть бути простіші, але цей теж приклад. Також мають бути й готові рішення, але все має свою ціну.
Приблизна структура автоматизованої системи на Python
Ось список модулів та їх призначення:
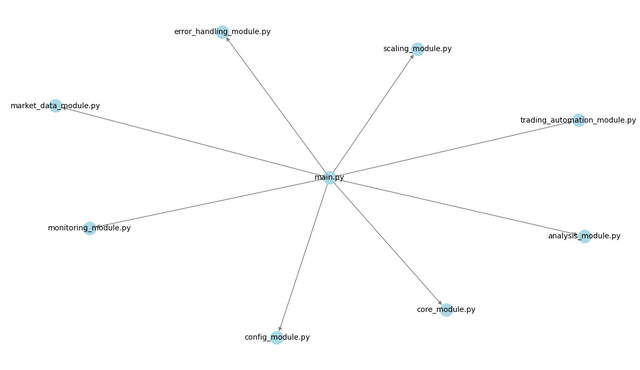
main.py- головний скрипт для управління та щоб інші добре взаємодіяли між собою;market_data_module.py- збір та обробка даних. Передбачає також підключення через API до біржі;analysis_module.py- різноманітний аналіз отриманих даних;trading_automation_module.py- займається всім що пов'язано із виконанням торгових процесів;monitoring_module.py- моніторинг системи та ринкових умов в реальному часі;config_module.py- зберігає різні налаштування;core_module.py- ядро, яке містить все необхідне для роботи системи;error_handling_module.py- робота із помилками, що все працювало стабільно;scaling_module.py- масштабування.
Це дає лише уявлення цілісної системи, адже роботи багато й потрібно прописати всі деталі та функції від взаємодії з іншими модулями, до цільового призначення кожного окремого. Наприклад, торговий модуль має містить різні команди управління торговими операціями й події при яких вони будуть застосовуватись, а також розраховувати тейк профіт, стоп лос та інші важливі аспекти. А це все чисто технічні знання з програмування та прописування взаємозалежностей, котрі треба мати або якось кооперуватись із ШІ, але це не гарантує найкращу роботу такої торгової машини.
Тож така система може бути розроблена під конкретний інструмент із меншою кількістю даних або більш потужною, але й буде вимагати додаткових ресурсів. Якщо розміру може бути не великий, то потрібно таки продуктивний процесор. А для автономної та швидшої роботи, тобто мінімальної затримки передачі команд на виконання, можна розмістити її на VPS сервері.
Якщо все правильно налаштувати й добре навчити модель розпізнавання й зробити все інше потрібне, то це може допомогти спростити багато нервів та ручної роботи.
Ризики та покращення надійності ШІ/МН у торгівлі
Трохи занурюючись у перші питання теми із машинного навчання, збору даних про настрої та десятків спроб виконання коду, а також на основі загальнодоступної інформації, можна виділити декілька ризиків, пов'язаних з роботою із ШІ чи МН. Це поверхнево, щоб мати якесь уявлення, бо поглиблено, там купа термінології, котру потрібно опановувати комплексно.
Деякий список:
- Точність коду - при самостійній збірці та навчанні моделі та інших діях програмування, потрібно знати що і як працює та ретельно перевіряти наявність помилок, бо навіть один пробіл не в тому місті може змінити результат або не дати працювати скрипту чи системі;
- Точність отриманих даних - які мають подаватись бути правильно зібрані, отримані й передані на обробку. А для машинного навчання ще й представлені належним чином, щоб модель їх добре розуміла й давала потрібний результат;
- Перенавчання - буває це по різному. Одна з ознак перенавчання, це коли прогнозовані дані повністю збігаються з актуальними (тобто навчальними) або просто база перенасичена інформацією й прогнозування, тобто подача хороших торгових сигналів буде не точною (на скільки це можливо в ринкових умовах). В мене, можливо виникало при навчанні моделі, тоді не було прогнозів або вони просто були в одній точці із фактичними даними. Для кращого результату, потрібно було розділити навчальні дані й тестові, щоб прогнози відрізнялись від історичних показників, проте це не усуває всі складнощі цього явища;
- Збої - можуть бути як через недопрацьованість системи, виконання коду чи ще чогось, де просто не було передбачено якусь ситуацію. Також постачання даних, тобто якщо воно було безперервним завдяки API, то розрив інтернет з'єднання може викликати якусь помилку або подача й не правильна інтерпретація даних чи можливо зміна в їхній структурі, а там багато нюансів щодо їх конвертації у мову машин. Наприклад, при спробах автоматизованого парсингу Binace Squre за тегом STEEM. Щоб збирати інформацію про настрої на ринку, виникав збій через динамічну зміну в полі class, скрипт припиняв бачити де та інформація знаходиться і просто зупинявся.
- Швидкість виконання - потреба у швидкості виконання залежить від стратегії та методу торгівлі й бува, долі мілісекунд дуже важливі. Покращити можна, як мінімум трьома. Перший, це ретельне доопрацювання коду й системи для найкращої оптимізації. Другий, обладнання до якого входять носії інформації, а також потужності заліза, як-то CPU, RAM та інші супутні компоненти. Третій, пропускна здатність інтернету та час відгуку на передачу та отримання інформації, що впливає як на отримання даних, так і виконання торгових команд. Щоб задовольнити другий аспект, краще розміщувати автоматизовану торгову систему на сервері якнайближче до серверів біржі, щоб була мінімальна затримка.
Підбивши підсумки, можна зазначити, що тим шляхом яким мене повело по стежці Python, де передбачено ручне створення коду та всі інші маніпуляції власними головою та силами, то простих рішень немає. Бо багато нюансів залежить саме від профільних знань, котрі дозволяють на стадії розробки та навчання моделі, усунути основні ризики та і ті, що виникнуть в процесі тестування. Хіба можна вплинути на швидкість обладнанням або розміщенням на хороших серверах поближче до біржових. Тож із точки програмування цього всього, потрібно підходити більш фундаментально, щоб мати хороший результат, вирішення багатьох завдань та збоїв вимагатиме знань, щоб десь код підправити чи поглянути що із ним не так, ну і володіння супутніми інструментами теж полегшить роботу.
Додаткові джерела:
- https://blog.colobridge.net/uk/2024/05/artificial-intelligence-and-machine-learning-ua/
- https://cryptorank.io/price/steem/historical-data
- Консультації із ШІ та його велика допомога із кодом та багато з чим, пов'язаним із темою допису.
| ENtranslated by AI |
|---|
Artificial intelligence is developed as an analogue to human intelligence. It is a complex mechanism, with Machine Learning being one of its components. ML is responsible for training, analysis, data collection, and much more. Although it can also be used as a separate module. Its training base can be created manually and can range from a few megabytes to terabytes of data. AI, as a holistic structure with an integrated ML division, performs significantly more tasks.
The use of AI and ML has its advantages compared to traditional automated trading or trading robots, namely:
- Working with large volumes of data;
- Multi-component trading strategy to better respond to events;
- Speed of information processing and decision-making;
- Autonomy of operation without human involvement.
Disadvantages:
- Complexity of setup - if building and training a model from scratch;
- Need for additional computational resources or installation on a server for an extra fee;
- Quality data and its uninterrupted supply, as the result depends on their quality and accuracy;
- No one is immune to failures and all risks associated with the use of AI, both in its operation and in the code itself due to various factors and reasons;
- Need for specialized knowledge - much depends on domain knowledge if not using ready-made solutions.
How does it work? For example, a trading method based on tracking trading volumes in real-time. This involves a lot, a lot of numerical input data. A large volume of information can circulate in a continuous flow. A person needs to constantly monitor this and wait for a signal (the condition to be met). But if you engage AI with a trained base, it will monitor independently and manage trades when necessary. The decision-making becomes significantly easier. It requires less human time. This reduces stress and information overload, as well as overall fatigue. It just needs to be organized, which is not simple. At the same time, simple algorithmic trading or trading robots (even before AI) rely on a smaller amount of data. The simplest methods involve changes in price from the previous one, crossing MA, and others. Such events, where there is not a large amount of real-time data, influenced the trading operation. AI with ML provides a more flexible model for autonomous analysis and trading. It takes into account significantly more indicators and information (depending on how it is implemented) to generate profit and better manage risks.
Creating a Simple Forecasting Model (Linux)
In fact, this is a broad topic, and it is not possible to cover everything with just one question. There is a lot of information, as there are various details, nuances, and features. To understand everything correctly and to set up and train the model, sufficient knowledge is required, which I do not fully possess. So this is just a superficial example for familiarization with the functioning of the model, which, without the acquired experience and skills, can be risky to rely on, as the data may be misinterpreted.
On Linux, the step-by-step creation of a forecasting model based on scikit-learn looks as follows:
You need to have Python installed, as the next command is for it, to download and install additional libraries and scikit-learn.
pip install pandas numpy scikit-learn matplotlib seaborn xgboostseabornis for data visualization;
xgboostimproves data handling and computation.After entering the command, the data and modules will be downloaded, approximately 500 MB.
Preparing the input data. There can be various options, including direct real-time acquisition. However, for this example, I will download STEEM/USDT data for a year from 01.01 to 27.12.2024 with a D1 period. The CSV file can be found at (https://cryptorank.io/price/steem/historical-data), although there is an option to obtain it via API. It needs to be placed in a separate folder.

Create a script
name_script.pyin the folder where the file is located. The special code is written specifically for the format of the downloaded file and the structure of the data within it, and its name was also changed tosteem_usdt_data.csv(as it was easier during the process of many attempts and code checks).A regular text file is created, where the code is inserted, and everything is saved with the extension changed from
.txtto.py(the file's associative label will also change).
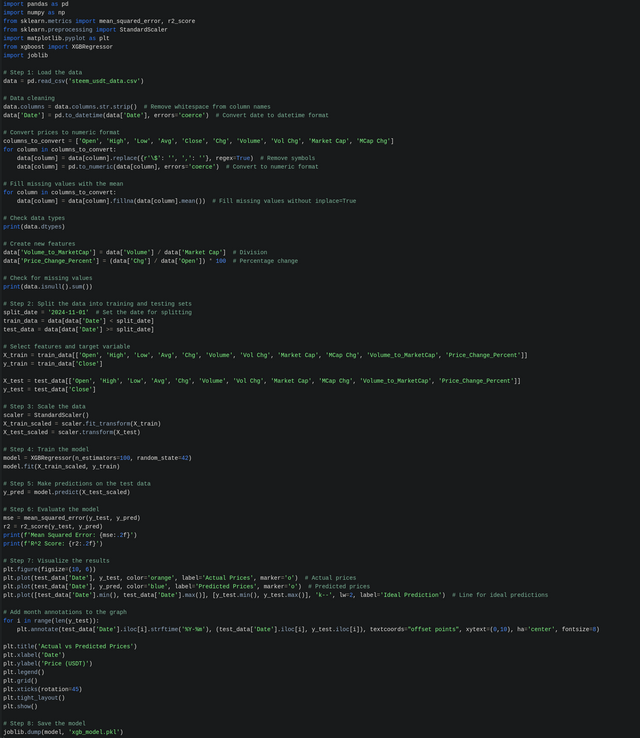
The script already includes data cleaning to ensure that the data is properly distributed and sorted for machine understanding and correct processing (as far as I know, this is done correctly, but this is just an example for familiarization and nothing more, so it should not be taken as a successful model to follow). All detailed steps are explained, including what actions and components are performed. Therefore, everything is detailed in the code image, which can be opened in full size, and the code itself will be provided in the comments as additional materials.
Also, a detailed technical explanation from AI for each step to make it clearer.

Running the script in the folder where it is located №1. Open the terminal from there №2. Enter the command №3:
python name_script.py

Numbers will start running, and the result will be displayed №4 along with the visualization.

Interpretation of the result.
Since the data during training was divided into training and testing sets, the test predictions are displayed over a shorter period of time, and the markings have the following explanations:- The dashed line represents the ideal growth forecast;
- Blue circles represent actual data;
- Yellow circles represent the model's forecast.
Metrics:
- Mean Squared Error: 0.00 - indicates that in real conditions of continuous data flow, this value almost never reaches zero and may be a sign of overfitting or the use of test data for training.
- R^2 Score: 0.97 - the model predicts and understands almost all variables and performs their processing well.
Automated Sentiment Analysis (Linux)
Not straying far from the previous topic, we can also explore the next one. The principle is the same; you need to install the necessary libraries. AI can guide you on how to install everything for NLTK and VADER (you can simply copy this text and ask how to install it, and a ready-made instruction will be provided). You need to have a simple code and create a Python script with the .py extension, similar to what was described above, and place the code in it. The command to run it is:
python name_script.py
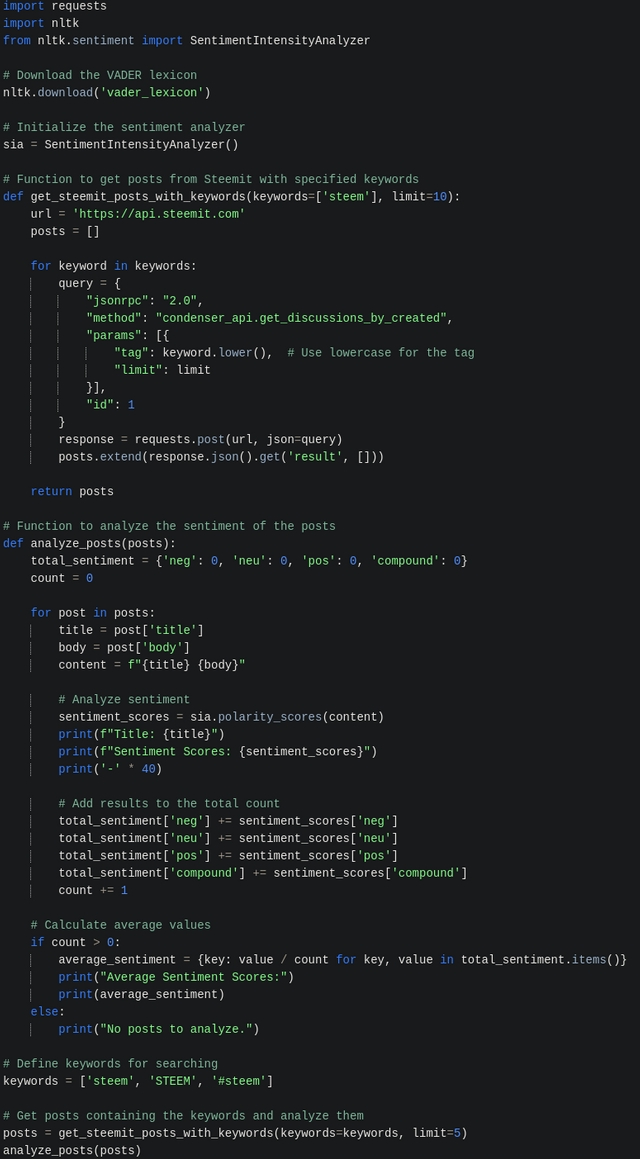
The code is already set up to fetch data from Steem via API and summarize the results to provide a general sentiment.

As seen, the output in the terminal is not very convenient and not aesthetically pleasing, but it provides some gathered information mentioning STEEM.
Graphical Output via Browser
To make it more convenient and visually appealing, you can use Streamlit. This allows you to display images in the browser and interact in a user-friendly mode, even entering words and searching by other keywords without changing the code.

So, after adding keywords in the search field and confirming the analysis, the result will be displayed. However, there is not much information about sentiments on Steemit, although the mechanism can be transferred to other platforms with more activity, such as Binance Square or Coin Market Cap. Just keep in mind that the data retrieval mechanism is more complex there.
The Impact of Sentiment on Behavior and Strategy Adjustment for STEEM/USDT
After playing around with the code and everything else, it produced results that showed text taken from binance.com/en/square, and upon analysis, assigned a score close to 1.00, as shown in the image below. There are many such messages with the hashtag STEEM, indicating buyer optimism, and the price also reacted with an increase. This suggests that this occurs either before the start of a new bullish rally or during it, as optimistic sentiments for the coin's growth.

Thus, it can be beneficial to pay attention to overall sentiments, but not always. However, STEEM became more expensive (while this post was being written, it rose from 0.26-27 to 0.38), against this backdrop. A logical conclusion can also be made about a shift in sentiment to bearish, indicating that buying at the peak would not be advantageous.
Automated Trading Strategy Based on AI and Machine Learning
Continuing from the previous topics, one can arrive at the conclusion that Python allows for the implementation of an automated system. However, it will involve somewhat more scripts than were used earlier in the text, where an example of Machine Learning and forecasting was provided.
On one hand, this is straightforward. You need to create a structure of scripts, where each will be responsible for its functions, meaning it will have written code to perform specific tasks.
In reality, it won't be that simple, as this is a large-scale process involving technical knowledge and various nuances that require specialized knowledge, which cannot be covered in a single post on a small topic. One must also possess these skills. Therefore, the presented projects are merely illustrative templates to understand how this could be implemented and function. This also implies the installation of various additional libraries, modules, neural networks, machine systems, and much more. The feasibility will depend on available resources, knowledge, and capabilities to implement it, so this is not about an easy path. Essentially, trading has never been easy, especially automated trading. There are other options that may be simpler, but this is also an example. There should also be ready-made solutions, but everything has its price.
Approximate Structure of an Automated System in Python
Here is a list of modules and their purposes:
main.py- the main script for management and ensuring that others interact well with each other;market_data_module.py- collection and processing of data. Also involves connecting via API to the exchange;analysis_module.py- various analysis of the obtained data;trading_automation_module.py- handles everything related to executing trading processes;monitoring_module.py- monitoring the system and market conditions in real-time;config_module.py- stores various settings;core_module.py- the core that contains everything necessary for the system to operate;error_handling_module.py- dealing with errors to ensure stable operation;scaling_module.py- scaling.
This provides only a glimpse of the holistic system, as there is much work to be done to detail all functions and interactions with other modules, as well as the specific purpose of each one. For example, the trading module must contain various commands for managing trading operations and the events under which they will be applied, as well as calculating take profit, stop loss, and other important aspects. All of this requires technical knowledge of programming and defining interdependencies, which one must have or somehow cooperate with AI, but this does not guarantee the best performance of such a trading machine.
Thus, such a system can be developed for a specific instrument with a smaller amount of data or a more powerful one, but it will also require additional resources. If the size may not be large, then a productive processor is still needed. For autonomous and faster operation, meaning minimal delay in command execution, it can be hosted on a VPS server.
If everything is set up correctly and the recognition model is well-trained, along with all other necessary components, it can help simplify a lot of stress and manual work.
Risks and Improvements in AI/ML Reliability in Trading
Diving a bit into the initial questions of the topic of machine learning, sentiment data collection, and dozens of attempts to execute code, as well as based on publicly available information, several risks associated with working with AI or ML can be identified. This is a surface-level overview to have some understanding, as a deeper dive involves a lot of terminology that needs to be comprehensively mastered.
Here is a brief list:
- Code Accuracy - when independently assembling and training a model and performing other programming tasks, it is essential to know what works and how, and to carefully check for errors, as even a single misplaced space can change the result or prevent the script or system from functioning;
- Data Accuracy - the data that needs to be submitted must be correctly collected, obtained, and transmitted for processing. For machine learning, it must also be presented appropriately so that the model understands it well and provides the desired result;
- Overfitting - this can occur in various ways. One sign of overfitting is when the predicted data completely matches the actual (i.e., training) data, or simply when the database is saturated with information and predictions, meaning that providing good trading signals will be inaccurate (as much as possible under market conditions). I may have encountered this while training the model, where there were no predictions, or they were simply at the same point as the actual data. For better results, it was necessary to separate training and testing data so that predictions differed from historical indicators, but this does not eliminate all the complexities of this phenomenon;
- Failures - can occur due to system underdevelopment, code execution issues, or other unforeseen situations. Data supply, meaning if it was continuous through an API, a break in the internet connection can cause some error, or incorrect data interpretation, or possibly changes in their structure, which involves many nuances regarding their conversion into machine language. For example, during attempts to automate parsing of Binance Square by the tag STEEM. To collect sentiment information about the market, a failure occurred due to dynamic changes in the class field, causing the script to stop seeing where that information was located and simply halt.
- Execution Speed - the need for execution speed depends on the trading strategy and method, and sometimes milliseconds are crucial. Improvement can be achieved in at least three ways. First, thorough refinement of the code and system for optimal performance. Second, the hardware, which includes storage devices, as well as the power of components like CPU, RAM, and other auxiliary parts. Third, the internet bandwidth and response time for data transmission and reception, which affects both data acquisition and the execution of trading commands. To satisfy the second aspect, it is better to host the automated trading system on a server as close as possible to the exchange servers to minimize latency.
In summary, I can note that the path I have taken along the Python trail, which involves manual code creation and all other manipulations using my own intellect and efforts, does not offer simple solutions. Many nuances depend on specialized knowledge that allows one to eliminate the main risks during the development and training of the model, as well as those that may arise during testing. One can only influence speed through hardware or by hosting on good servers closer to the exchanges. Thus, from a programming perspective, a more fundamental approach is needed to achieve good results; solving many tasks and failures will require knowledge to adjust the code or identify issues, and proficiency with auxiliary tools will also ease the work.
Additional sources:
- https://blog.colobridge.net/uk/2024/05/artificial-intelligence-and-machine-learning-ua/
- https://cryptorank.io/price/steem/historical-data
- Consultations with AI and its significant assistance with code and many aspects related to the topic of the post.
#ukraine #cryptoacademy-s22w2 #steemexclusive #club5050 #ai #ml #crypto #trading #cryptoacademy #steem
