
| UAoriginal |
|---|
Ончейн аналіз
Один із видів фундаментального аналізу є ончейн (onchain). Він так називається, оскільки всі події в мережі блокчейн записуються та є відкритими для вільного перегляду. Тобто весь масив можна переглянути безоплатно. Однак це не завжди дозволяє швидко обробляти великі масиви інформації, тому є різні сервіси, щоб автоматизовано збирати та візуалізувати її. Однак не скрізь є інформація про всі монети, або за таку послугу потрібно додатково заплатити і немає гарантій, що там щось задовольняюче потребу. Адже в першу вони розраховані на найпопулярніші криптомонети із великою капіталізацією, активністю та залученістю користувачів. Тож приклади й пояснення будуть на їх основі, а STEEM буде згадуватись та ілюструватись де це можливо й доступно.
Оскільки Bitcoin є лідером у світі криптовалют, а інші стабільні монети часто слідують за ним у глобальному напрямку, то в деяких випадках можна підходити до аналізу деяких монет і через загальні події, котрі впливають на екосистему та поведінку Bitcoin.
Основний набір даних для аналізу на блокчейні
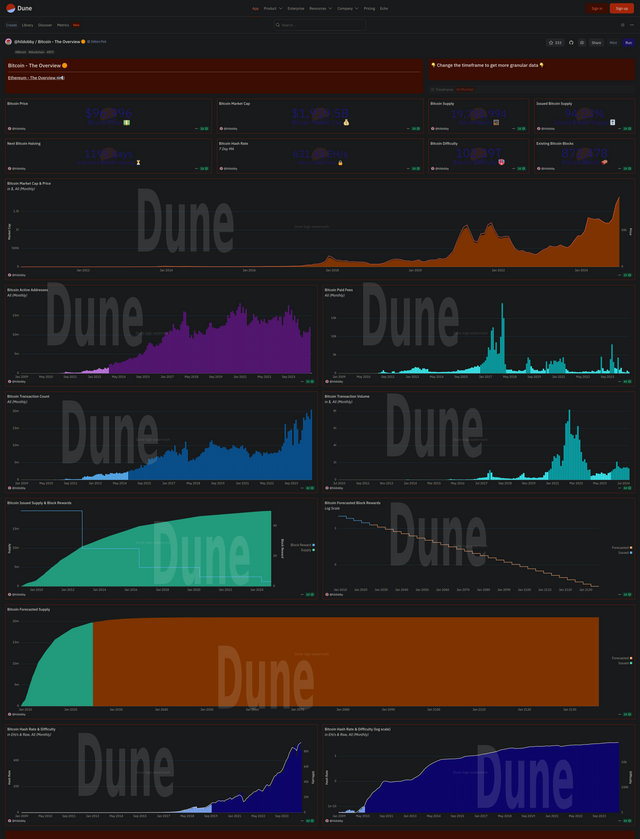
Активність криптоадрес або реальних криптогаманців
Зазвичай зі зростанням активності підвищується ціна активу. Як показано на зображенні у Bitcoin це відбувалось пропорційно. Коли у вересні 2023 року, активність, до цього наростаюча, досягла піка і почався новий бичачий забіг. Ймовірно це були могли бути покупки монети й виведення її на холодні гаманці.

Dune
Однак не завжди активність така важлива, як кількість та вартісний обсяг монет,
, котрі можуть проходити й за окремі великі транзакції, притаманні гравцям, котрих називають "Кити", котрі можуть суттєво впливати на ринок. Тому їх моніторинг додатково важливий. Тобто коли монети купуються на біржі й відправляються в сховище, то ціна теж має зростати, але й не швидко, а навпаки - заведення на біржу з метою продажу, може знизити ціну.
Однак загальну масу активності також розбивають на окремі показники транзакцій, як-то їх:
- Кількість;
- Обсяг вартості у валюті;
- Комісія за операцію.
Наприклад сервіс Dune окрім окремого представлення цих трьох показників, має ще їхнє вираження в індексі.

Коли він досягав показника 85-88 ціна падала і цього разу теж дійшов туди, але ситуація вже трохи інша, хоча це може бути ознакою корекційного зниження.
Трошки даних по STEEM
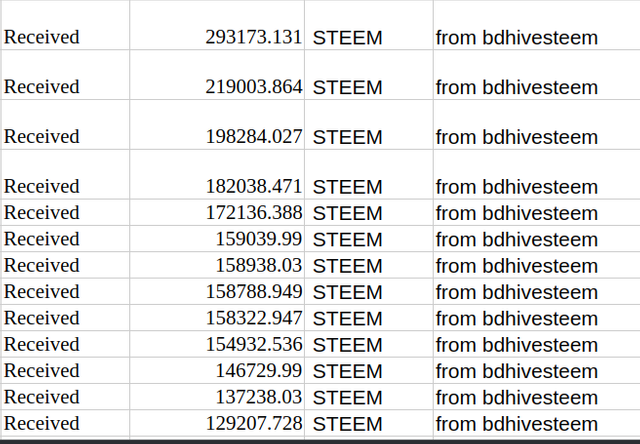
На https://steemdb.io не всю глибину показує (точніше треба перейти у вкладку транзакції), ніби 90 останніх днів має показувати, але маємо приклад.
Найбільше STEEM монет має на рахунку обліковий запис криптобіржі Binance, а із приватних гаманців, монети заводяться на саму біржу через bdhivesteem акаунт, який перенаправляє отримані ресурси на основний гаманець Binance (це видно по вихідним переказам). Отже, показано які суми на нього поступають, а це значить що йде відтік і активність зростає й обсяги теж. Було б добре якийсь хороший графік на основі цього, але такого або нема у вільному доступі, або на платних платформах.
Загалом для STEEM потрібно докласти значно більше зусиль, щоб отримати такі дані. Проте дані транзакцій можна скопіювати і вставити у таблицю, розділити де потрібно дані в окремі комірки, а потім відсортувати та зробити якийсь графік, щоб було розуміння. Один із недоліків, це потрібно робити періодично, щоб мати актуальні дані або й частіше.
Технічна реалізація отримання даних
Окрім сервісів, є також чат-боти у месенджері, котрі надсилають повідомлення із потрібними даними, залежно від налаштувань. Чи то сума транзакцій "Китів", чи щось інше, але теж дозволить бути в курсі подій, але знову ж таки, мабуть, це не для всіх токенів.
Індикатори
Спеціальних індикаторів на криптобіржах ніби немає, але можна власноручно щось зробити, розбираючись в програмування Pine Script на платформі TraidingView чи інших. На TraidingView зустрічався саморобний індикатор для Bitcoin підв'язаний до Glassnode (мабуть). Тож є різні шляхи, не завжди легкі.
Індикатори настроїв: "Страху та жадоби" та "Соціальних медіа"
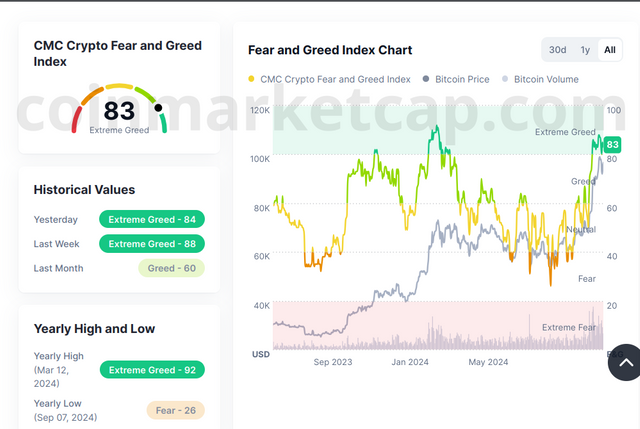
Страх та жадоба, як індикатор мають значення, від страху (перепроданість) 0 до 100 жадібності, тобто коли забагато накуплено й можлива корекція. Це можна інтерпретувати як показники холодності та перегрітості ринку. Коли сягає найвищих вершин, то може означати, що ринок перекуплений і можлива корекція або розворот.
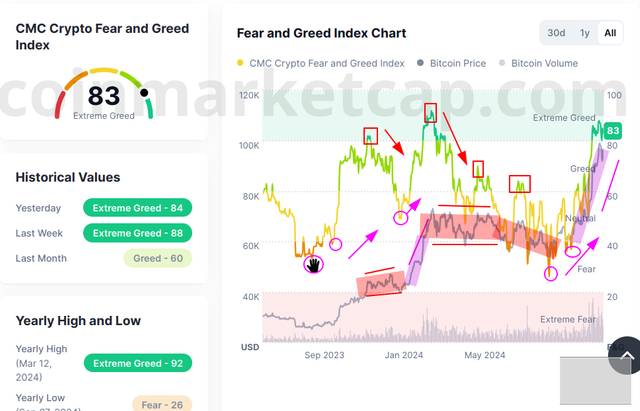
Як бачимо, 12 березня 2024 року, було досягнуто 92 жадібності і BTC від 68000+ USDT діставав до 50000+, що доволі величенький канал.
Настрої у соціальних медіа - не зовсім надійний показних, а сама сила прагнень йти в тому чи іншому напрямку може залежати від популярності та інших складових.
Для STEEM не так вже багато й даних, якщо брати до уваги соціальну активність, то активність там слабенька й число підписників, в порівнянні із TRON, не дуже то й велика, до того ж не має стійкої тенденції до зростання. На Redit, у профільній групі ніякої активності. Що означає про низький інтерес до монети. Хоча в пікові моменти глобальних бичачих настроїв, монета має збільшений обсяг торгів.
На одній із платформ, sentiment, здається, був навіть показних активностей користувачів у месенджері (мабуть, групі або згадування) та у X (Twitter). Однак то для платної версії й не відомо точно наскільки це достовірна інформація.
До подібних даних можна віднести саму активність та згадуваність активу в соц.мережах. Також настрої голосування та наявність підписників.
На coinmarketcap.com є також і соціальне комьюніті із певною кількістю учасників STEEM. Настрій переважно бичачий, проте опитування базується лише на 370 голосах, що не так вже й багато, однак ціна протягом якогось часу підвищувалась, але не від того, адже є сильний політичний фундамент для того.
Інша справа, коли настрої на соціальних платформах підігріваються новинами, щодо монети, якщо це гра чи ще щось, то можуть бути якісь зміни та впровадження. Тож деякі деталі краще відслідковувати ретельніше.
На що ще можна звернути увагу?
Ще є показник альт-сезону, тобто коли альтернативні монети зростають у капіталізації та можуть загальним числом перевищувати Bitcoin. Тобто, як іще один пункт покращення настроїв щодо монети, але також зростання буде залежати від додаткових факторів самих проєктів монет, тобто того що вони із себе представляють, їх цінність та багато іншого, що вплине на силу росту ціни. Бо для якоїсь монети це обмежиться сотнею другою пунктів, а інші можуть вирости на десятки доларів. Проте у відсотковому значенні профіт може варіюватись.
Що дає поєднання ончейн аналізу та настроїв?
"Одна голова добре, а дві краще", так із поєднанням, бо доповнення іншими показниками дає більше підтвердження та впевненості, що певний рух ціни може відбутись.

Наприклад падає активність адрес і обсягів транзакцій еквівалентних певній валюті, а настрої страху та жадібності показують, що досягнуто пікових 92 (12 березня 2024). Що натякає на корекція і біткоїн не зростає а гуляє на боковому ринку, адеж назріває корекція або розворот. STEEM відповідно дотримується подібної поведінки.
Коли ситуація протилежна, тобто активність зростати, а рівень жадібності десь близько 35, то ситуація краща для биків, адже може назрівати сильний забіг.

Нюанси очейн аналізу та настроїв
Дані блокчейну хоч і відображають стан транзакцій, але це може бути й маніпуляцією, наприклад штучне створення активності якимись схемами чи активностями. Тобто трейдери беруть участь в акціях чи ще якихось івентах, збільшуючи цим окрім активності й обсяг торгів, це ніби має заохотити інших та показати кращу капіталізацію активу, але може бути штучно роздутим. Тому треба перевіряти чи не проводяться різні заходи за участю цих монет, що тимчасово можуть збільшити статичні показники.
Настрої "Страху та жадібності" трохи відстають від динаміки ринку.
Опитування в соціальних медіа можуть бути доступними навіть без реєстрації, тобто один голос на 24 години для однієї ip адреси. Тож їх легко можна накрутити й це вельми маніпулятивна складова. Це один приклад, на Binance є комьюніті, але точно не зрозуміло (мені особисто) чи саме об'єднано STEEM монетою. Там понад 170 тис. підписок, але в опитування взяло менш як 10 і ніякої гарантії, що ця думка підкріплена чимось вагомим. Проте в подібних місцях пишуть про напрямок, але краще думати своєю головою, бо для цього достатньо подивитись який відсоток трейдерів від загальної маси, насправді отримує регулярний прибуток.й
На що краще звернути увагу?
Оскільки не всі дані можуть цілком надавати розуміння цілісної картини ринку, також рекомендовано звертати увагу на якісні сервіси для її збору та відстежування.
Також варто брати до уваги фундаментальні політичні рішення. Наприклад, коли у США державні регулюючи органи почали процес введення законодавчої бази для деяких криптоактивів, в першу чергу Bitcoin, монета добре втратила у ціні. Тоді не було ясно, ентузіазму було не багато й інвестори зайнялись іншими активами. В той час коли позитивні новини довкола цієї теми рухали ціну вгору. Прийняття ETF на біткоїн дало новий поштовх для биків, а додаткове дихання відкрили обіцянки Дональда Трампа та його перемога на виборах. Тож активність також була пов'язана із цими подіями.
Тому для кращого розуміння краще брати до уваги важливі фундаментальні фактори, проводити технічний аналіз, регулярно моніторити та вивчати історичні дані із наслідковими зв'язками щодо них. Тобто використовувати різні дані для підтвердження сигналів. Це дозволить впевненіше володіти ситуацією відповідно до стилю торгівлі й ставити реальні цілі.
Підсумок ончейн аналізу та настроїв
Ончейн дані це реальна інформація, котра дає зрозуміти ситуація на ринку і початок активності, коли мають бути цінові рухи. Це подібно до того, як дивитись на небо й бачити насування темних хмар, які можуть бути передвісниками дощу, або їх відсутність, що говорить про хорошу погоду. На основі цього людина вносить корективи в свої дії: одягнути плащ, взяти парасольку, залишитись вдома чи піди на прогулянку або інші варіанти, що допомагають краще зробити задуману справу. Так само ончейн дані та настрої дають можливість по відносно об'єктивних ознаках підготуватись до зміни фінансової погоди для криптовалюти.
Стратегія
Під STEEM подібного роду стратегію важче адаптувати, але це буде залежати від доступності даних на платних платформах (що не перевірялось) в повному обсязі. Або піде значно більше часу на ручний моніторинг ситуації на блокчейні.
Інструменти аналізу:
- onchain дані (в тому числі для Bitcoin);
- Настрої "Жадібності та страху" та в соціальних медіа (за наявністю, але не завжди вони будуть).
Buy
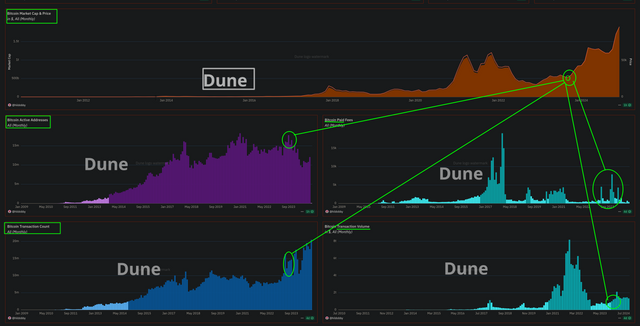
Зростає активність криптогаманців Bitcoin, разом із обсягом переказів та кількістю транзакцій на вересень 2023.
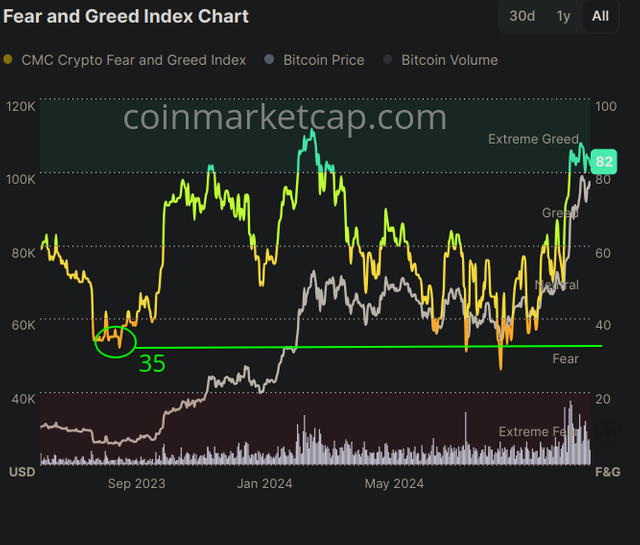
Індекс страху та жадоби знаходиться поблизу позначки 35, що теж добре для покупок.
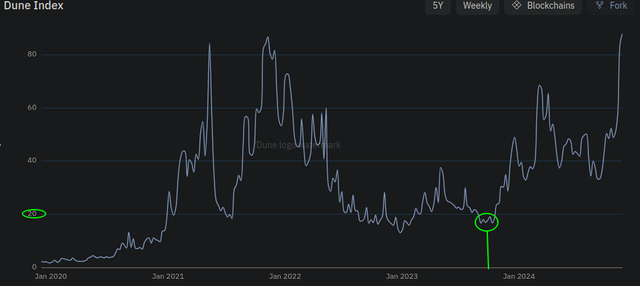
Duna індекс нижче 20, що теж ніби добре перед початком активності.
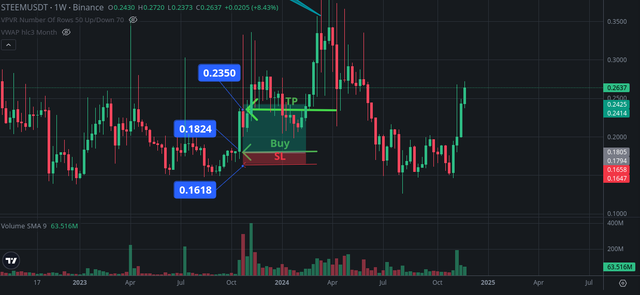
На графіку STEEMUSDT період W1 утворюється подвійне дно W. (бо для прикладу дані ончейн у мене відсутні).
Вхід:
Buy:0.1824
SL:0.1618
TP:0.2350
Ризик: мінімум 1/2 у співвідношення SL/TP
Вихід:
- За TP;
- За SL;
- Трейлінг Стоп;
- При заведенні на біржу для продажу великої кількості монет, що може знизити ціну великою кількістю пропозиції;
- Інші важливі фундаментальні та технічні зміни, що впливають на вартість монети.
Sell (як приклад із даними STEEM)
Обсяг монет котрі виходять із приватних гаманців на акаунт Binance криптобіржі binance-hot2 за відносно останні 24 години, значно перевищують загальну кількість за останні 5 днів. Що ймовірно буде використано для продажу активів і ціна впаде.
Індекс жадібності високий 82 (був більший), але не критичний. Зросли обсяги торгів про Volemt Profile. Проте активність гаманців та кількість транзакція Bitcoin зростають, тож це не на довго.

Проте на спот можна скинути монети, а на ф'ючерсі зіграти на зниження.
Інформація у даному дописі розміщена для ознайомлення і не гарантує прибутку чи ще чогось, адже торгівля має свої ризики та нюванси на які потрібно зважати.
Використані джерела та ресурси:
     https://www.ccn.com/education/understanding-on-chain-analysis-a-comprehensive-guide/
     https://www.coingecko.com/learn/on-chain-analysis
     https://www.blockchain.com/explorer/search?search=STEEM
     https://coincodecap.com/on-chain-analysis
     https://charts.coinmetrics.io/crypto-data/
     https://medium.com/coinmonks/a-beginners-guide-to-on-chain-analysis-1f2689efd9aa
     https://cryptology.school/blog/shho-take-oncein-analiz-i-iak-iogo-vikoristovuvati
     https://teletype.in/@onchainschoolpro/onchain_guide
     https://academy.binance.com/uk/glossary/on-chain
     https://academy.binance.com/uk/articles/a-guide-to-cryptocurrency-fundamental-analysis
     https://coinmarketcap.com/currencies/steem/
     https://dune.com/blockchains/bitcoin
     https://messari.io/project/steem
     https://messari.io/project/steem/charts/social
     https://coinmarketcap.com/uk/charts/fear-and-greed-index/
     https://coinmarketcap.com/charts/fear-and-greed-index/
     https://dune.com/metrics
     https://steemdb.io/@binance-hot2
Знімки екрана зроблені на Coinmarketcap, Binance, Dune, Messari, steemwallet, steemdb.
Деякі консультації із ШІ, в тому числі створення структурного шаблону допису.
Цілий файл із текстом допису перекладено за допомогою
www.onlinedoctranslator.comГоловне зображення згенеровано SDXL 1.0 та відредаговано.
| ENtranslated |
|---|
Online analysis
One of the types of fundamental analysis is onchain. It is called so because all events in the blockchain network are recorded and open for free viewing. That is, the entire array can be viewed free of charge. However, this does not always allow us to quickly process large amounts of information, so there are various services to automatically collect and visualize it. However, information about all coins is not available everywhere, or you need to pay extra for such a service, and there are no guarantees that there is something that meets your needs. After all, they are primarily designed for the most popular crypto-coins with large capitalization, activity and user involvement. So examples and explanations will be based on them, and STEEM will be mentioned and illustrated where possible and available.
Since Bitcoin is the leader in the world of cryptocurrencies, and other stablecoins often follow it in a global direction, in some cases it is possible to approach the analysis of some coins and through general events that affect the ecosystem and behavior of Bitcoin.
Core data set for blockchain analysis

Activity of crypto addresses or real crypto wallets
Usually, with the increase in activity, the price of the asset increases. As shown in the image in Bitcoin, this happened proportionally. When in September 2023, the activity, which had been increasing until then, reached its peak and a new bull run began. Probably, it could be the purchase of a coin and withdrawal of it to cold wallets.

Dune
However, activity is not always as important as the number and value of coins,
, which can also pass for individual large transactions belonging to players called "Whales", which can significantly influence the market. Therefore, their monitoring is additionally important. That is, when coins are bought on the stock exchange and sent to the storage, the price should also increase, but not quickly, but on the contrary - putting them on the stock exchange for the purpose of sale can lower the price.
However, the total mass of activity is also broken down into separate transaction indicators, like these:
- Quantity;
- Amount of value in currency;
- Commission for the operation.
For example, the Dune service, in addition to a separate representation of these three indicators, also has their expression in the index.

When it reached the indicator of 85-88, the price fell and this time it also reached there, but the situation is already a little different, although this may be a sign of a corrective decline.
A little data on STEEM
https://steemdb.io does not show the full depth (more precisely, you need to go to the transaction tab), as if it should show the last 90 days, but we have an example.
The Binance crypto exchange account has the most STEEM coins on its account, and from private wallets, coins are transferred to the exchange itself through the bdhivesteem account, which redirects the received resources to the main Binance wallet (this can be seen from the outgoing transfers). So, it is shown what amounts are coming to it, which means that there is an outflow and activity is increasing, and volumes are also increasing. Some good chart based on this would be nice, but it is either not available freely or on paid platforms.
In general, STEEM requires a lot more effort to get this kind of data. However, the transaction data can be copied and pasted into a table, separated where necessary into separate cells, and then sorted and made some kind of graph to make it easier to understand. One of the disadvantages is that it needs to be done periodically to have up-to-date data or more often.
Technical implementation of data acquisition
In addition to services, there are also chatbots in the messenger that send messages with the necessary data, depending on the settings. Whether it is the amount of transactions of "Whales" or something else, but it will also allow you to be aware of events, but again, apparently, this is not for all tokens.
Indicators
It seems that there are no special indicators on crypto exchanges, but you can do something yourself by understanding Pine Script programming on the TraidingView platform or others. On TraidingView there was a homemade indicator for Bitcoin connected to Glassnode (apparently). So there are different ways, not always easy.
Mood Indicators: "Fear and Lust" and "Social Media"

Fear and greed as an indicator have values from fear (oversold) 0 to 100 greed, that is, when too much is bought and a correction is possible. This can be interpreted as indicators of coldness and overheating of the market. When it reaches the highest peaks, it may mean that the market is overbought and a correction or reversal is possible.

As you can see, on March 12, 2024, 92 greed was reached and BTC from 68000+ USDT reached 50000+, which is quite a huge channel.
Sentiments in social media are not completely reliable indicators, and the very strength of the desire to go in one direction or another may depend on popularity and other components.
There is not so much data for STEEM, if we take into account social activity, then the activity there is weak and the number of subscribers, compared to TRON, is not very large, moreover, it does not have a stable growth trend. On Reddit, there is no activity in the profile group. Which means low interest in the coin. Although at the peak of global bullish sentiment, the coin has increased trading volume.
On one of the platforms, sentiment, there seems to have even been some ostentatious user activity on Messenger (probably a group or mention) and X (Twitter). However, for the paid version, it is not known exactly how reliable this information is.
Such data can include the very activity and mentionability of the asset in social networks. Also voting mood and presence of followers.
Coinmarketcap.com also has a social community with a certain number of STEEM members. Sentiment is mostly bullish, but the poll is based on only 370 votes, which is not that much, but the price has been rising for some time, but not by much, because there is a strong political foundation for it.
It's another thing when the sentiment on social platforms is fueled by news, about a coin, if it's a game or something else, there might be some changes and implementations. So some details are better to follow more carefully.
What else can you pay attention to?
There is also an alt-season indicator, that is, when altcoins grow in capitalization and can outnumber Bitcoin in total. That is, as another point of improvement in sentiment about the coin, but also the growth will depend on additional factors of the coin projects themselves, that is, what they represent, their value and many other things, which will affect the strength of the price growth. Because for some coin it will be limited to one hundred and two points, while others can grow by tens of dollars. However, the percentage profit may vary.
What does the combination of on-chain analysis and sentiment give?
"One head is good, but two is better", so with the combination, because the addition of other indicators gives more confirmation and confidence that a certain movement of the price can take place.

For example, the activity of addresses and the volume of transactions equivalent to a certain currency is falling, and the sentiments of fear and greed show that the peak of 92 (March 12, 2024) has been reached. Which hints at a correction and Bitcoin does not grow but walks on the side market, and a correction or a reversal is brewing. STEEM accordingly follows a similar behavior.
When the situation is the opposite, i.e. activity increases, and the level of greed is somewhere around 35, then the situation is better for bulls, because a strong run may be brewing.

Nuances of eye analysis and moods
Although blockchain data reflects the state of transactions, it can also be manipulated, for example, artificially creating activity by some schemes or activities. That is, traders take part in promotions or other events, increasing not only activity but also the volume of trades. Therefore, it is necessary to check whether various activities involving these coins are not being carried out, which may temporarily increase the static indicators.
Fear and Greed sentiment is lagging slightly behind market dynamics.
Polls on social media can be available even without registration, i.e. one vote per 24 hours for one IP address. So they can be easily wound and this is a very manipulative component. This is one example, there is a community on Binance, but it is not clear (to me personally) whether STEEM is actually a coin. There are more than 170 thousand subscriptions, but less than 10 took part in the survey and there is no guarantee that this opinion is supported by something significant. However, in similar places they write about the direction, but it is better to think with your head, because for this it is enough to see what percentage of traders from the total mass actually receives a regular profit.
What is better to pay attention to?
Since not all data can fully provide an understanding of the complete picture of the market, it is also recommended to pay attention to quality services for its collection and tracking.
Fundamental political decisions should also be taken into account. For example, when in the USA the state regulatory bodies started the process of introducing a legal framework for some crypto-assets, primarily Bitcoin, the coin lost a lot in price. At that time, it was not clear, there was not much enthusiasm and investors took up other assets. At the time when positive news around this topic moved the price up. The adoption of Bitcoin ETFs has given new impetus to the bulls, and Donald Trump's promises and his election victory have provided additional breathing space. So activism was also associated with these events.
Therefore, for a better understanding, it is better to take into account important fundamental factors, conduct technical analysis, regularly monitor and study historical data with consequential connections to them. That is, use different data to confirm signals. This will allow you to more confidently own the situation according to your trading style and set realistic goals.
Summary of online analysis and sentiment
On-chain data is real information that gives an understanding of the market situation and the beginning of activity, when there should be price movements. It's like looking up at the sky and seeing dark clouds looming, which can be harbingers of rain, or the absence of them, which indicates good weather. Based on this, a person makes adjustments to his actions: put on a raincoat, take an umbrella, stay at home or go for a walk or other options that help to better do the planned work. In the same way, on-chain data and sentiments provide an opportunity to prepare for a change in the financial climate for cryptocurrency on relatively objective grounds.
Strategy
Under STEEM, this kind of strategy is more difficult to adapt, but it will depend on the availability of data on paid platforms (which has not been tested) in full. Or it will take much more time to manually monitor the situation on the blockchain.
Analysis tools:
- onchain data (including for Bitcoin);
- Greed and Fear moods and on social media (if available, but not always).
Buy
Bitcoin wallet activity is increasing, along with the volume of transfers and the number of transactions for September 2023.

The Fear and Lust Index is near the 35 mark, which is also good for shopping.

Duna index is below 20, which also seems to be good before the start of activity.

On the chart of STEEMUSDT period W1, a double bottom of W. is formed (because I don't have onchain data for an example).
Exit:
Buy:0.1824
SL:0.1618
TP:0.2350
Risk: minimum 1/2 in SL/TP ratio
Entrance:
- By TP;
- For SL;
- Trailing Stop;
- When listed on the exchange for the sale of a large number of coins, which can reduce the price with a large number of offers;
- Other important fundamental and technical changes affecting the value of the coin.
Sell (as an example with STEEM data)
The volume of coins leaving private wallets to the Binance account of the binance-hot2 crypto exchange over the last 24 hours significantly exceeds the total amount over the last 5 days. Which will likely be used to sell assets and the price will fall.

The greed index is high at 82 (was higher), but not critical. Volumes of trading on Volemt Profile have increased. However, the activity of wallets and the number of Bitcoin transactions are increasing, so it is not for long.

However, you can drop coins on the spot, and play for a decrease on the futures.
The information in this post is for reference and does not guarantee profit or anything else, because trading has its own risks and nuances that need to be taken into account.
Used sources and resources:
     https://www.ccn.com/education/understanding-on-chain-analysis-a-comprehensive-guide/
     https://www.coingecko.com/learn/on-chain-analysis
     https://www.blockchain.com/explorer/search?search=STEEM
     https://coincodecap.com/on-chain-analysis
     https://charts.coinmetrics.io/crypto-data/
     https://medium.com/coinmonks/a-beginners-guide-to-on-chain-analysis-1f2689efd9aa
     https://cryptology.school/blog/shho-take-oncein-analiz-i-iak-iogo-vikoristovuvati
     https://teletype.in/@onchainschoolpro/onchain_guide
     https://academy.binance.com/uk/glossary/on-chain
     https://academy.binance.com/uk/articles/a-guide-to-cryptocurrency-fundamental-analysis
     https://coinmarketcap.com/currencies/steem/
     https://dune.com/blockchains/bitcoin
     https://messari.io/project/steem
     https://messari.io/project/steem/charts/social
     https://coinmarketcap.com/uk/charts/fear-and-greed-index/
     https://coinmarketcap.com/charts/fear-and-greed-index/
     https://dune.com/metrics
     https://steemdb.io/@binance-hot2
     https://steemitwallet.com
Screenshots taken on Coinmarketcap, Binance, Dune, Messari, steemwallet, steemdb.
Some AI consulting, including creating a structured post template.
The entire file with the text of the post was translated using
www.onlinedoctranslator.comMain image generated by SDXL 1.0 and edited.
#ukraine #cryptoacademy-s21w5 #s21w5 #club5050 #steem #onchain #crypto #bitcoin #usdt


