| EN translated by Deepl ~95% and AI ~5% |
|---|

TF - time frame
Question 1: Explain market fractals
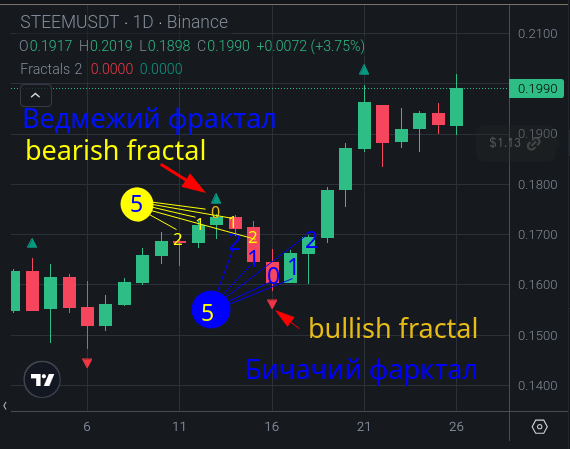
What is a fractal? A fractal is one of the indicators developed by Bill Williams and is part of his group of indicators of complex technical analysis described in the book Trading Chaos. To put it simply, it is not that important in itself, as it only improves the visual perception of the highs and lows formed on the chart. Especially without proper experience or a trained eye, and small marks in such places make it much easier to identify them. In the classic version, a prerequisite for its formation is the presence of two Japanese candlesticks (or bars) on both sides, so that each is higher or lower than the previous one. If we conditionally mark the central candle of the five with the number 0 with the lowest low as the starting point, then the lows marked with 1 should be higher than 0, and 2 should be higher than 1. This will be a bullish fractal, which means that buyers should analyze the situation more closely for the possibility of buying.
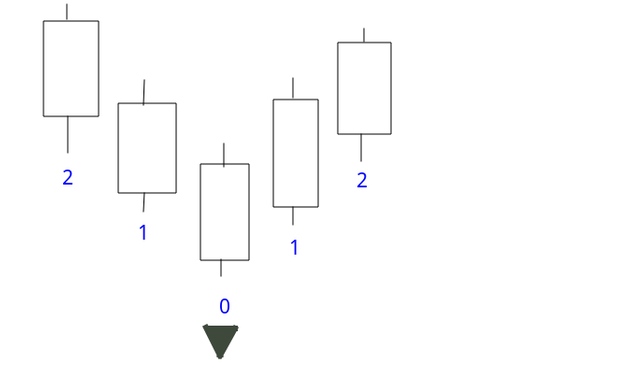
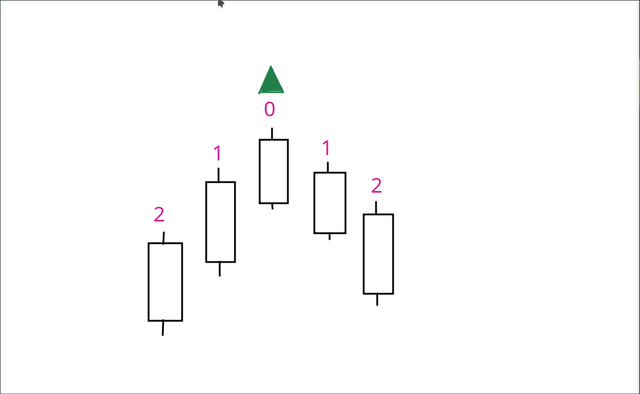
The bear fractal has an inverted principle, where the 0 point of the maximum should be the highest, and the maximums 1 and 2 should be located below the previous ones.
An example on the STEEM/USDT chart
The bearish fractal is so called because it is displayed at the top, i.e. the probable period when you can sell, making a profit from the previously purchased asset, either on the spot (selling the existing product) or from a downward bet in other types of trading. Bullish is formed at a low when the downside potential is weakening and there are prospects for buying. Taken together, each of them has a classic five-candlestick pattern.
A few nuances

The analysis algorithm takes into account only closed candlesticks, i.e. those that have already formed, and not those in the active phase of trading. This means that there will be some delay. It also does not always include a standard model, and the next fractal may be marked near the previous one, or on a single candlestick, which may indicate market uncertainty when the market is flat. In fact, it is part of a group of indicators that specialize in trends and reversals:
- Alligator
- Fractals
- Awesome Oscillator
- Market Facilitation Index
- Acceleration/Deceleration zone
- Gator Oscillator histogram
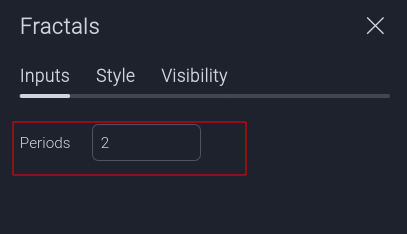
Nowadays, fractals can take into account more complex price patterns and be calculated on more than 5 candlesticks. For this purpose, the “Periods” item has been added to the settings.
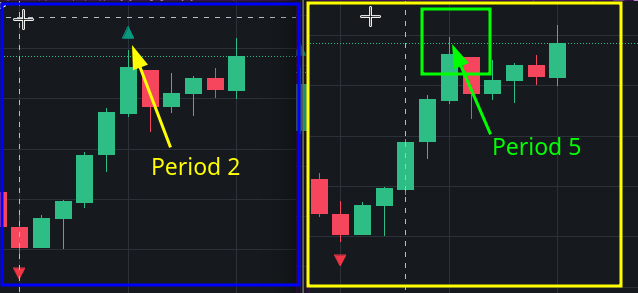
The value of 2 is our 5 candles, which means 2 on the left and 2 on the right. If you set 5, then it will already be 11 candles, and the fractal will not be formed. In the first case, it would be a very weak signal, and with a period of 5, there would be no signal, which clearly shows the risks of using the indicator without auxiliary filters.
Question 2: Combining fractals with other indicators
First of all, it is worth noting that this indicator was created to be used in a group with others, so it is recommended to read the book mentioned earlier. Therefore, in combination, it significantly improves the trend forecasting model.
An interesting point is that RSI, Moving Avarage, and Alligator are based on moving averages, but take into account different data, or have several of them at once with different periods, as with the alligator
Example.
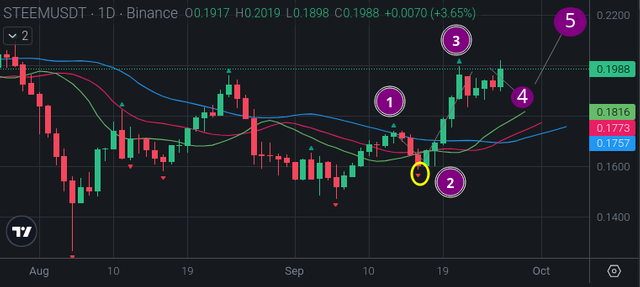
The classic model. A descending alligator indicates a decline. At point 1, a fractal is formed and a correction for the beginning of the third wave begins. At point 2, there is a bullish fractal, more hints of the third wave, and the Alligator is “covering its mouth”, which should open later (usually it is late, but it depends on the settings). Taken together, this is a much more positive signal for a trend continuation (within a certain timeframe), provided we are not aware of any next-day candles above 0.1780 USDT per STEEM coin. Then the third wave is completed, the correction does not quite meet the conditions to go to the fifth wave because there is no necessary bullish fractal in the area of point 4. Nevertheless, the Alligator does open its mouth, and the candles form the Pennant technical analysis pattern, which is also favorable for growth to 0.22, which is also normal. However, the best option would be if the bullish fractal formed somewhere around 0.1816 near the green alligator line.
Question 3: Using fractals on different time intervals
Fractals can be used on different time intervals, but depending on their size, the signal strength and distance traveled in points will be different.
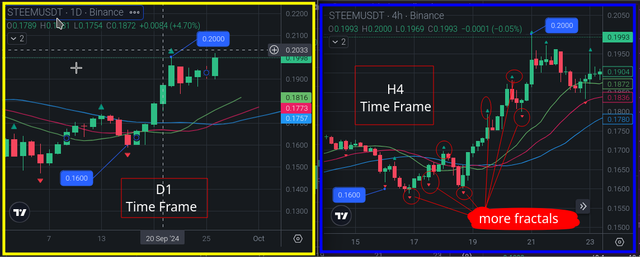
For example, the screenshot on the left shows the D1 period, where there are about 400 points between the formed fractals, each of them has its own value, and they were formed for about ten days. On H4 (right), this period contains much more fractals, but the distance between them in points is much smaller, somewhere between 50 and higher, but it is also faster. The periods H1, M30, M15-5-1 will give even more fractals and shorter distances, and the signals are weaker. Therefore, the smaller the TF, the shorter the distance, but it can give additional signals for scalping when trading intraday or looking for additional confirmations for older TFs. It is usually selected according to the trading strategy and trading style.
If we add to this the previous question, a younger TF can better suggest and understand market behavior. For example, earlier on D1, it was not entirely clear and the Alligator was lagging behind. The H4 TF has additional fractals to better understand the mood of traders. This can be especially seen in the bullish fractal in the alligator's narrowing area, which wakes up earlier, allowing you to act a little earlier or not (no guarantees, but increases the chances).
Question 4: Develop a trading strategy based on fractals
According to AI tips, there are about 10-20 basic strategies using fractals, and various modifications have been developed on their basis, which in total is up to 70 types, but this is not the limit. Therefore, it is quite difficult to develop something new and not to affect the already known ones, and there are no guarantees that it will be profitable.
The strategy can be called “Blogger” to minimize the risks of your own investments. For example, when you publish content on the STEEM blockchain on Steemit.com (and other platforms) while in the #5050 club, you receive coins, accumulate them, and estimate when they can be sold at the best price. Or, being in the 100 club, predict the optimal period for unlocking your coins for speculation. It can also be used for regular trading, why not, but there are no guarantees.
Strategy
Time periods D1 and H4.
Analysis tools:
- Elliot Waves;
- Fractals indicator (standard period 2);
- Alligator indicator (standard settings).
Conditions for entry are bullish
On TF D1, the general direction of the Elliot waves is determined, as shown in the sample. The best time to enter is on the third (higher probability) and fifth (lower probability) waves when the structure is formed. The entries are confirmed by the formation of a fractal, additionally consistent with the alligator on TF H4.
Read more
Step 1.
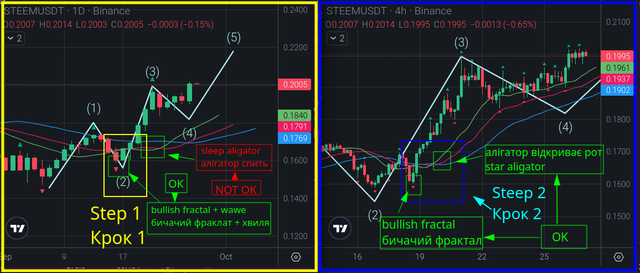
The best conditions were formed after the correctional wave 2, a bullish fractal was formed, the alligator is narrowed, the mouth is closed.
Step 2
Let's look at H4. A bullish fractal is formed in the narrowing of the alligator, and then the alligator opens its mouth, i.e. to continue the uptrend in the direction of the third wave. This would be a good signal.
Take Profit and Stop Loss
Stop Loss is set under the fractal on D1, i.e. at the end of the correction of the second wave, or close to this point.
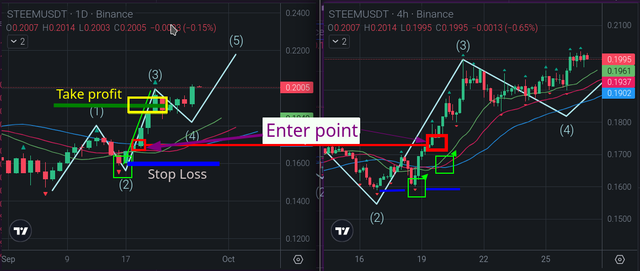
Take Profit is set based on the length of the first wave minus 10-20 percent and the entry point. For example, the length is 300 pips, and 60 pips have already been subtracted from the entry point, then 220-20%, to make it more reliable about 175 pips.
When you reach 60-70-80% of the set goal, it is better to move the Stop Loss above the entry point if it is a purchase, as in the images, for a positive value and deposit protection. And, of course, be guided by the market situation.
Commentary
The fourth correctional wave on the pattern did not form as expected, and the fractal did not form, which means that the structure was broken and it is better to exit the position if it has not been done before, and not to open new ones, as the process of forming a new signal may be delayed.
Bearish entry conditions
The conditions are similar to bullish ones, but in a downtrend, i.e. bearish fractals are taken into account, the waves will go down, like an alligator, opening (expanding) from top to bottom. What will be a signal to sell on the spot is to buy coins cheaper and sell them again when the price rises and refrain from buying coins when the market is falling.
Question 5: Analyze the current market trend of Steem using fractals
This question is better suited to the weekly and daily time periods, which I moved from the third question to the last one to take a more global view and avoid repetition.
Analysis.
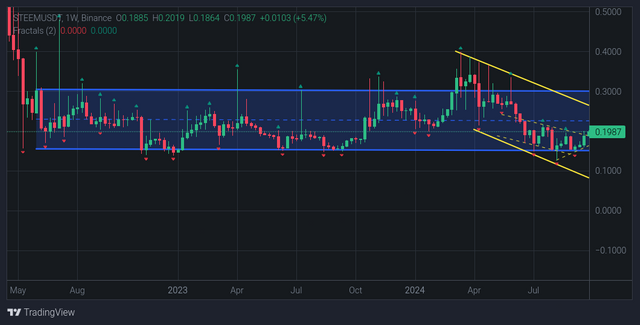
First, the W1 period. Since May 2022, the STEEM coin has been mostly in flat, which is clearly visible both in the channel construction and in the available fractals, because bearish fractals show that the price often wants to go down and has been brought down frequently and sharply, while bullish fractals show more pronounced and stable support at one level, especially in 2023. Therefore, there was no pronounced trend during this time, but in 2024, with a surge in activity in the cryptocurrency sector, there was a slightly larger increase, which was countered by a small downward trend within the channel. Bearish fractals (highs) are declining, as are bullish fractals (lows).
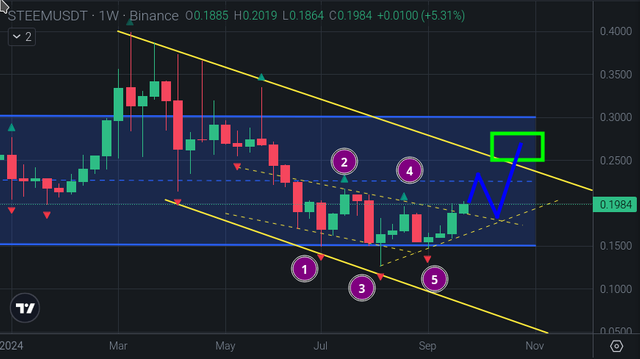
The last five fractals show a change in the situation, if in 2023 there was just a double bottom on the lower support of the channel, now there is an attempt to change the trend, because the last five fractals indicate this. The fifth bullish one didn't update the low, but went above the previous one and is now headed for the update of the sixth bearish one, which is about to form. Moving averages will not be very effective in this regard.
Therefore, the overall fractal cycle, within the framework of the flat from May 2022, is currently trying to change the more affected bearish cycle from March 2024 to a bullish one. The prospect of such movements is to reach the price range of 0.25-0.30 USDT per STEEM coin.
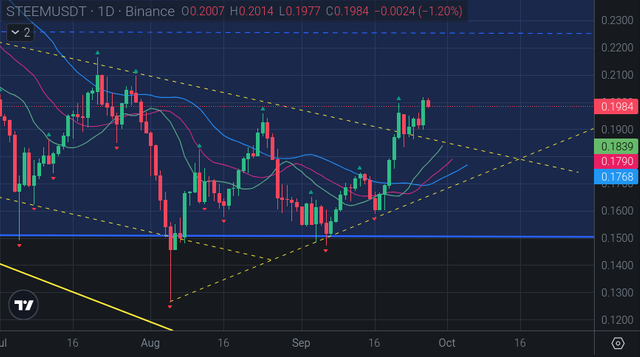
Period D1. A bit more can reveal a shorter-term picture and reinforce W1, as younger fractals gradually indicate an upward direction and rely on the support of a new trend line that is trying to turn the situation in favor of the bulls. The Alligator also opens up, adding strength, but there is no fractal confirmation of harmonious development, as the bullish one did not form properly, so it may take more time to create the conditions for further growth, which in general may have benchmarks for reaching the upper resistance of the yellow W1 channel, which is around 0.24 USDT per STEEM. This is about the middle of the global flat channel. Later, if the new support (yellow dotted line) holds, then there are prospects of reaching 0.30 USDT and above per STEEM.
Sources and resources used:
1) All screenshots of the STEEM/USDT trading pair charts were made >>>
2) General information about fractals https://www.investopedia.com/articles/trading/06/fractals.asp
3) Consultation and assistance from the AI.
4) The main image of the post was generated by SDXL 1.0 and edited
| UA original language |
|---|

ТФ - тайм фрейм (часовий період)
Питання 1: Поясніть ринкові фрактали
Що таке фрактал? Фрактал один із розроблених Біллом Вільямсом (Bill Williams), входить до групи його індикаторів комплексного технічного аналізу, що описано в книзі "Торговий хаос". Якщо говорити просто, то він не такий і важливий сам по собі, бо лише покращує візуальне сприйняття максимумів та мінімумів, сформованих на графіку. Особливо без належного досвіду чи тренованого ока, а маленькі позначки в таких місцях, значно полегшують їх виявлення. Для його формування, в класичному варіанті, потрібною умовою є наявність з обох боків двох японських свічок (чи барів), щоб кожна була вище або нижче за попередню. Якщо умовно позначити центральну свічку із п'ятірки цифрою 0 із найнижчим мінімумом, як відправну точку, то мінімуми позначені 1 мають бути вище за 0, відповідно 2 вище за 1. Це буде бичачий фрактал, тобто повідомляє покупцям, що треба пильніше проаналізувати ситуація на можливість покупки.

Ведмежий фрактал має перевернутий принцип, коли 0 точка максимуму має бути найвищою, а максимуми 1 та 2 розміщуватись нижче попередніх.

Приклад на графіку STEEM/USDT
Ведмежий фрактал так називається, бо відображається на вершині, тобто настання ймовірного періоду, коли можна продати, отримавши прибуток від раніше купленого активу, як на споті (продаж наявного товару), чи від ставки на зниження при інших типах торгівлі. Бичачий формується на мінімумі, коли потенціал зниження слабшає і є перспективи для покупки. В сукупності кожна із них, має класичну модель із п'яти свічок.
Декілька нюансів

Алгоритм аналізу бере до уваги лише закриті свічки, тобто ті що вже сформувались, а не в активній фазі торгівлі. Значить буде деяке запізнення. Також не завжди включає стандартну модель, і наступний фрактал може бути позначено біля попереднього, або одній свічці, що може вказувати на невизначеність ринку, коли флет. Адже по суті, він входить до групи індикаторів, котрі б спеціалізуються на трендах та розворотах:
- Алігатор (Alligator)
- Фрактали (Fractals)
- Чудовий осцилятор (Awesome Oscillator)
- Індекс полегшення ринку (Market Facilitation Index)
- Зона прискорення/уповільнення (Acceleration/Deceleration)
- Гістограма алігатора (Gator Oscillator)

На сьогодні, фрактали можуть брати до уваги складніші цінові моделі й розраховуватись не на 5 свічках, а на більшій кількості. Для цього додано в налаштуваннях пункт "Періоди".

Значення 2, це наші 5 свічок, що має на увазі 2 зліва та 2 з права. Якщо встановити 5, то це вже буде 11 свічок, і фрактал не буде сформовано. В першому випадку, це був би дуже слабкий сигнал, а при періоді 5 відсутній, що наочно показує ризики використання індикатора без допоміжних фільтрів.
Питання 2: Поєднання фракталів з іншими індикаторами
В першу чергу варто зазначити, що він був створений саме для використання в групі із іншими, тож рекомендовано почитати згадану раніше книгу. Тому в поєднання, значно поліпшує модель прогнозування трендів.
Цікавий момент, що RSI, Moving Avarege та Алігатор побудовані на ковзаючих середніх, але беруть до уваги різні дані, або мають декілька штук відразу з різними періодами, як з алігатором.
Приклад

Класична модель. Алігатор знижується вказує на зниження. В точці 1 формується фрактал та початок корекція для початку третьої хвилі. В точці 2 бичачий фрактал, більше натяків на третю хвилю та Алігатор "прикриває пащу", яка згодом має відкритись (зазвичай він запізнюється, але це залежить від налаштувань). В сукупності, це значно позитивніший сигнал для продовження тренду (в певних часових рамках), за умови, що ми не знаємо про свічки наступних днів вище 0.1780 USDT за одну монету STEEM. Потім третя хвиля завершується, корекція не зовсім відповідає умовам, щоб піти на п'яту хвилю, бо немає потрібного бичачого фракталу в області точки 4. Проте Алігатор таки відкриває пащу, а свічки формують фігуру технічного аналізу "Вимпел", теж сприятливу для зростання до 0.22, що теж нормально. Проте найкращий варіант, якби бичачий фрактал сформувався десь на 0.1816 поблизу зеленої лінії алігатора.
Питання 3: Використання фракталів на різних часових інтервалах
Фрактали можна використовувати на різних часових інтервалах, але залежності від їхньої величини сила сигналу та пройдена відстань в пунктах буде різною.

Наприклад, на скриншоті показано зліва період D1, де між сформованими фракталами близько 400 пунктів, кожен із них має свою вартість, також вони утворювались десь днів десять. На H4 (праворуч), в цьому проміжку міститься значно більше фракталів, але відстань між ними в пунктах, значно менша, десь від 50 й вище, але й проходиться вона швидше. Періоди H1, M30, М15-5-1 даватимуть ще більше фракталі та коротші відстані, а сигнали слабші. Тож чим менший ТФ, тим менша відстань, але це може давати додаткові сигнали для скальпінгу, коли торгівля проходить всередині дня чи пошуку додаткових підтверджень для старших ТФ. Зазвичай підбирається під торгову стратегію та стиль торгівлі.
Якщо додати до цього попереднє питання, то молодший Тф може краще підказати й зрозуміти поведінку ринку. Приклад, раніше на D1 було не зовсім зрозуміла та Алігатор відставав. ТФ Н4 має додаткові фрактали для кращого розуміння настрою трейдерів. Особливо це можна помітити по бичачому фракталу в області звуження алігатора, котрий прокидається раніше, що дає змогу трохи діяти раніше або ні (ніяких гарантій, але підвищує шанси).
Питання 4: Розробіть торгову стратегію на основі фракталів
Якщо вірити підказкам ШІ, то є десь 10-20 базових стратегій із використанням фракталів, а на їх основі розроблені різні модифікації, що сукупно до 70 видів, але це не межа. Тож розробити щось своє та не зачепити вже відоме, досить складно і ніяких гарантій, що це буде прибутково.
Стратегію можна назвати "Блогерською", щоб мінімізувати ризики власних вкладень. Наприклад, коли ви публікуєте контент на блокчейні STEEM на платформах Steemit.com (та інших) перебуваючи в клубі #5050, отримуєте монети, накопичуєте, та оцінюєте коли їх можна продати за найвигіднішою ціною. Чи перебуваючи в клубі 100, спрогнозувати оптимальний період, для розблокування своїх монет для спекуляцій. Для звичайного трейдингу, теж може підійти, чому б ні, але теж ніяких гарантій.
Стратегія
Часові періоди D1 та H4.
Інструменти аналізу:
- Хвилі Еліота;
- Індикатор Фрактали (стандартний період 2);
- Індикатор Алігатор (стандартні налаштування).
Умови для входу бичачі
На ТФ D1 визначається загальний напрямок розгортання хвиль Еліота, як представлено на зразку. Найкраще це захід третю (більша ймовірність) та п'яту (менша ймовірність), коли структура сформована. Входи підтверджуються формуванням фракталу, додатково узгоджуються алігатором на ТФ Н4.
Детальніше.
Крок 1
Найкращі умови сформовано після корекційної хвилі 2, утворено бичачий фрактал, алігатор звужений, паща закрита. (цього не достатньо)

Крок 2
Дивимось на H4. У звуженні на звуження алігатора, утворено бичачий фрактал, а потім алігатор відриває рота, тобто для продовження висхідного тренду в напрямку третьої хвилі. Це буде хорошим сигналом.
Take Profit and Stop Loss
Stop Loss виставляється під фракталом на D1, тобто під місцем завершення корекції другої хвилі, або близько до цієї точки.

Take Profit встановлюється орієнтуючись на довжину першої хвилі мінус 10-20 відсотків, та точки входу. Наприклад, довжина 300 пунктів, а з точки входу вже віднято 60, тоді 220-20%, щоб надійніше десь 175.
При досягненні 60-70-80% від посталеної цілі, Stop Loss краще переміщати вище точки входу, якщо це покупка, як на зображеннях, для позитивного значення та захисту депозиту. І звичайно орієнтуватись на ситуацію на ринку.
Коментар
Четверта корекційна хвиля на зразку, не сформувалась як треба, а фрактал не утворився, тобто структура була порушена й це значить, що з позиції краще виходити, якщо цього не було зроблено раніше, а нові не відкривати, бо процес формування нового сигналу може затягнутись.
Умови для входу ведмежі
Умови аналогічно бичачим, тільки обернено за низхідним трендом, тобто до уваги беруться ведмежі фрактали, хвилі будуть іти вниз, як і алігатор, відкриватиметься (розширюватиметься) згори до низу. Що на споті буде хіба сигналом для продажу, щоб потім взяти монети дешевше й знову продати, коли ціна зросте та утримуватись від покупок монет коли ринок падає.
Питання 5: Проаналізуйте поточний ринковий тренд Steem за допомогою фракталів
В це питання краще підходять часові періоди тижневий та денний, які мною перенесені із третього питання на останнє, щоб розглянути картину більш глобально й не було повторів.
Аналіз

Спершу період W1. З травня 2022 року, монета STEEM переважно перебуває у флеті, це добре видно, як побудовою каналу, так і наявними фракталами, адже ведмежі показують, що ціну часто хочуть знизити й збивали її часто й різко, в той час, коли бичачі фрактали показують більш виражену й стабільну підтримку на одному рівні, особливо в 2023 році.Тож ціна переважно відбивалась від верху до низу й так повторювалось декілька разів. Тож за цей час виражений тренд відсутній, але вже у 2024 зі сплеском активності в секторі криптовалют, було дещо більше зростання на противагу котрому утворився невеликий низхідний тренд в рамках каналу. Ведмежі фрактали (максимуми), знижується, так само як бичачі (мінімуми).

Останні п'ять фракталів показують зміну ситуації, якщо в 2023 була просто утворилось подвійне дно, на нижній підтримці каналу, то зараз там, спроба зміни тренду, адже останні п'ять фракталів на це вказують. П'ятий бичачий, не оновив мінімум, а став вище попередього і взятий напрямок на оновлення шостого ведмежого, котрий має сформуватись. Ковзаючі середні в цьому плані будуть не дуже ефективні.

Тож загальний фрактальний цикл, в рамках флету з травня 2022, на сьогоднішній день, пробує змінти більши вражений ведмежий цикл від березня 2024, на бичачий. Перспективою таких рухів є досягнення цінового діапазону 0.25-0.30 USDT за монету STEEM.
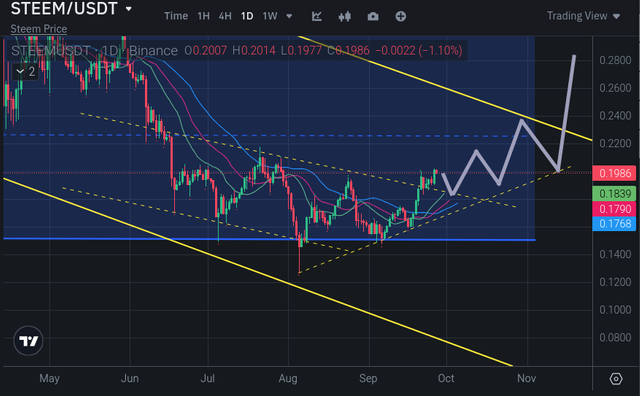
Період D1. Трішки більше може розкрити короткотривалішу картину й підкріпити W1, бо молодші фрактали, поступово вказують на висхідний напрямок та опираються на підтримку нової трендової, котра пробує переломити ситуацію, взявши її в свої руки на користь биків. Алігатор теж розкривається додаючи сили, але фрактально немає підтвердження гармонічного розвитку, бо бичачий не свормувався як слід, тому може знадобитись більше часу на створення умов подальшого зростання, що загалом може мати орієнтири для досяхнення верхно опору жовтого каналу W1, це десь 0.24 USDT за STEEM. Це десь середина глобального флетового канала. Згодом, якщо витримає нова підтримка (жовта пунктирна лінія), тоді є перспективи вийти до 0.30 USDT й вище за монету STEEM.
Джерела та використані ресурси:
1) Всі знімки екнарів графіків торгової пари STEEM/USDT зроблені >>>
2) Загальна інформація про фрактали https://www.investopedia.com/articles/trading/06/fractals.asp
3) Консультація та допомога із боку ШІ.
4) Головне зображення допису згенеровано SDXL 1.0 та відредаговано
#cryptoacademy-s20w3 #s20w3 #trading #crypto #steem #strategy #club5050 #fractals
I really appreciate the clear breakdown of both bullish and bearish fractals and how they work in conjunction with the Alligator and Elliott Waves. The detailed analysis of Steem using fractals especially focusing on long-term trends is very insightful. Its impressive how you connected fractals to real market movements and their potential signals. Great work! Wishing you the best of luck in the contest!
Downvoting a post can decrease pending rewards and make it less visible. Common reasons:
Submit
Який ти розумний свєт моїх очей!!!
Downvoting a post can decrease pending rewards and make it less visible. Common reasons:
Submit
Thank you very much for participating my dear friend contest. Very nicely presented but I want to tell you that the Bevish Faculty and Bullish Faculty charts taken from Source very correct and very well presented.
Downvoting a post can decrease pending rewards and make it less visible. Common reasons:
Submit
Hi @luxalok nice to see you here!
You have done good job while translating your language. By the way your way of explaining the terms is quite good.
You have explained all the terms and the phases of the fractals with the help of the charts. Each chart is showing your understanding of the fractals.
Integration of other technical indicators with fractals help us to confirm the next move of the market. And in this way we can take an entry or exit our entry.
Downvoting a post can decrease pending rewards and make it less visible. Common reasons:
Submit