
Authored by @madridbg, via Power Point 2010, using public domain images. Gerd Altmann
Greetings and welcome dear readers to this exciting world of blockchain and markets associated with trading and technical analysis in general. This time we will be addressing what pertaining to the use of the CHAIKIN money flow indicator as a requirement of the assignment socialized by Professor @Kouba in week 6 of season 4 of #SteemitCryptoAcademy.
On that note, let's get down to practice.

CONCEPTUAL AND PRACTICAL APPROACH TO THE CHAIKIN CASH FLOW INDICATOR

In this section of the subject, we will describe in a conceptual and practical way each of the postulates requested by the Professor, which will allow to fully understand the use of the CHAIKIN indicator.
1. In your own words, give a simplified explanation of the CMF indicator with an example of how to calculate its value.

Before answering the question "What is it?", it is necessary to determine that there are important elements that must be taken into account in order to perform an adequate technical analysis, among which are the seasonality, the direction and strength of the market, as well as the important trading zones or market capitalization volume in a specific period of time.
In this sense, and focusing our attention on trading volumes, we can explain that they are the areas where investors either bullish or bearish, leave a large number of purchases or sales, according to the level of interest they have on the asset.
Based on the above, the Chaikin cash flow indicator, in an oscillating type indicator used in technical analysis as it allows to measure the buying or selling pressure exerted by investors for specific periods of time, so that this pressure is usually measured by the volume of cash flow, this being understood as an indicator that is based on the accumulation and distribution of an asset according to the price action.
In such a way it is necessary to understand that the cash flow, gives us signals of the amount of asset that is traded in a specific period of time, according to the interest of investors whether bullish or bearish. The creation of the indicator is attributed to Marc Chaikin, it is based on the levels of market strength, which tend to be accompanied by the price, hence the fundamental of the indicator is to predict the behavior and price action of an asset.
On how it works:
The operation if you will is simple and as I mentioned, part of the level of interest of investors on an asset, consequently, it is expected that a large volume or cash flow give us signals of the great interest that investors have on the asset, on the other hand, if this trading volume decreases, it throws us information of the disinterest of investors on the asset in question.
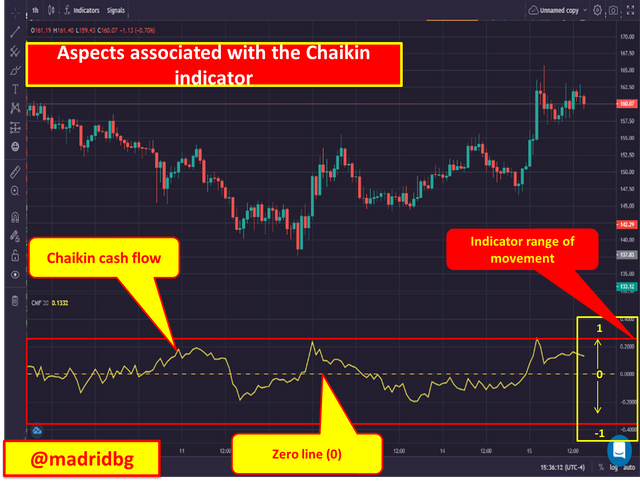
Operationally, traders detect market weaknesses as a price following action, in this sense, we should consider the following aspects:
1. As a result of volume increases, the price usually closes in the lower half of the daily range, which generates a symmetrical process.
2. In either bullish or bearish market strength, prices usually close above the upper half of their daily range, which is usually visualized by increasing volumes and positive values within the indicator.
3. In markets with bullish or bearish weakness, prices usually close below the lower half of the daily range, which is usually displayed with increasing volume manifestations, however, the indicator values are negative.
Another aspect that we must take into account is that the indicator oscillates above or below the zero line (0) in surrounding values ranging from 1 to -1 and depending on the location of this we can speculate with bullish or bearish movement according to the price action.
Therefore, those movements in positive zones from 0 to 1, are an indication of buying pressure, on the other hand, negative values from 0 to -1 indicate selling pressure. In addition to the above, it is necessary to understand and identify false signals, they are attributed to those movements where the Chaikin money flow is close to zero, so that the movements are usually only moderately positive or negative and at this point we say that they are false signals and we will go deeper in the following sections.
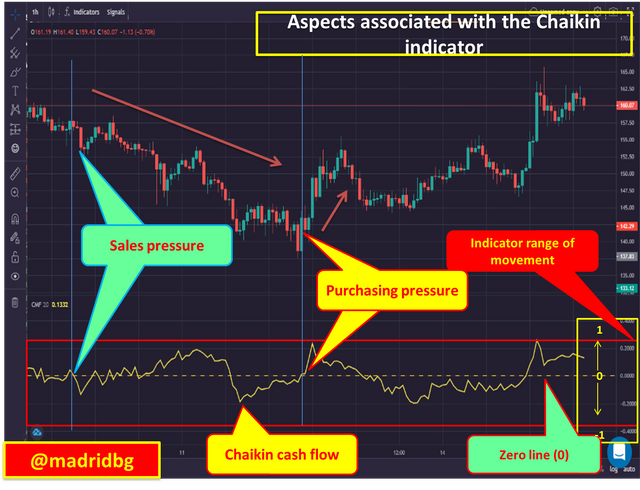
On how it is calculated:
As we have mentioned throughout this writing, the indicator is based on an average that is established between the accumulation and distribution volume for both bearish and bullish trends, over a given period of time.
Mathematically we can represent the process through the formulas shown in the following image where we will explain in detail the statistical and mathematical data of the indicator.

Now, there is a mathematical alternative to determine the Chaikin indicator based on a periodicity of 20 and 21 respectively, so to understand the above, let's look at the image below.
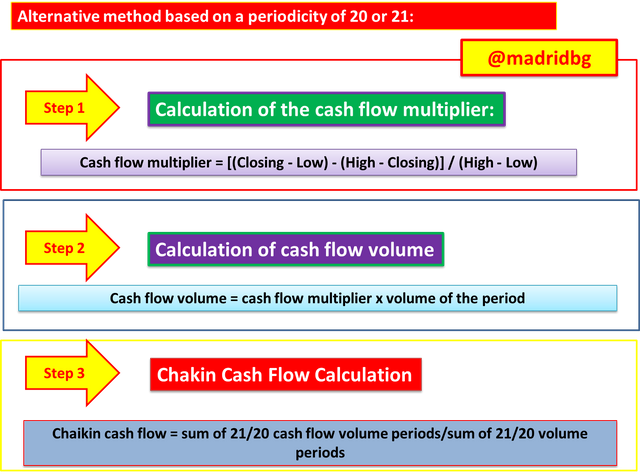
Mathematical operation to determine the cash flow indicator Chaikin:
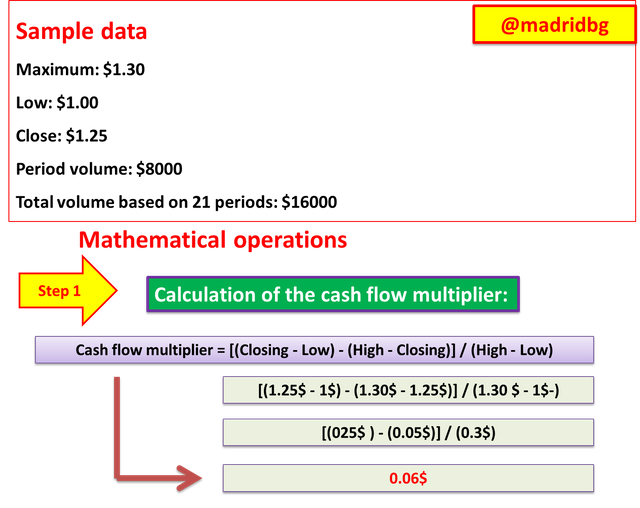
In order to make the process more understandable, we will make a demonstrative calculation, which will allow us to guide the reader in this regard, for this, we will not rely on the alternative equation described above.
In this sense, we must determine certain sequential criteria that allow us to arrive at the Chaikin cash flow, among these stand out:
1. Calculation of the cash flow multiplier:
2. Cash flow volume calculation:
3. Chakin cash flow calculation
Where each of the processes follows a mathematical line that we will describe in detail in the following images and as observed for the practical example, the level of the Chaikin cash flow for the sample values is $0.03 which allows us to infer that the asset is close to neutrality and that it is moderately positive, a value that we can contrast with the sequence of images below.
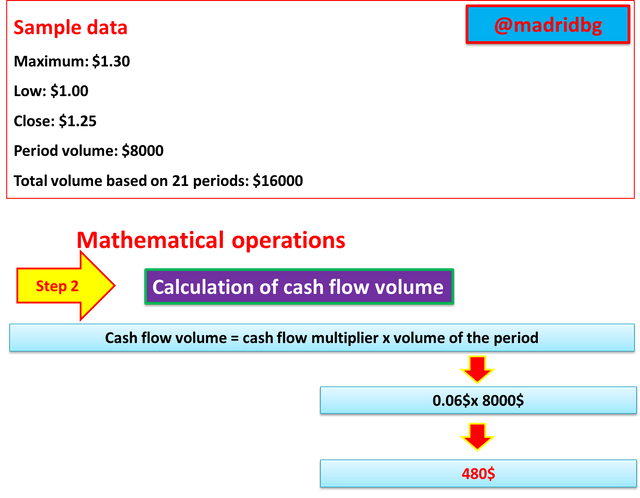
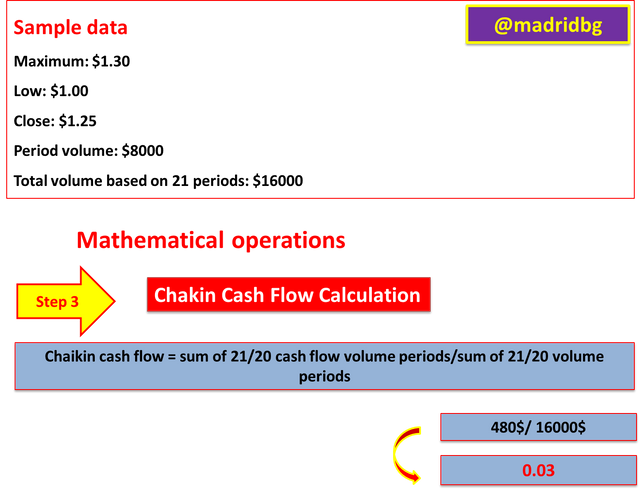
2. Demonstrate how to add the indicator to the chart on a non-tradingview platform, highlighting how to modify the period settings (best configuration).

To answer this section of the topic we will not rely on the bitsgap platform, so we will explain the sequence of steps to add and configure this indicator.
Step 1: go to the bitsgap website (https://app.bitsgap.com/trading) and look for the trading section, then select the asset pair you want to analyze.
Step 2: We go to the FX function and in the search tab we write Chaikin money flow, selecting the option provided by the platform.
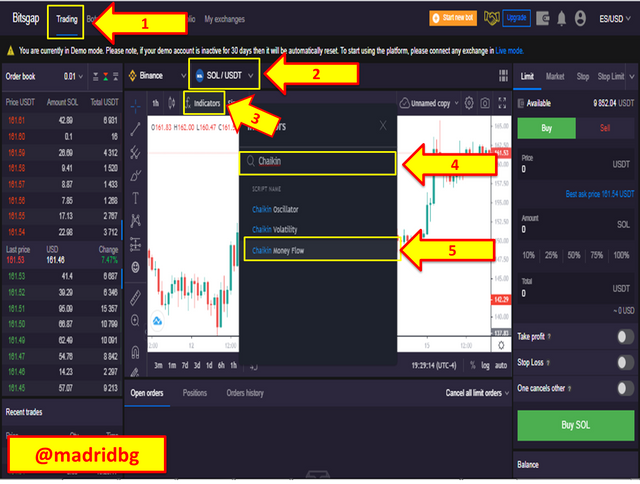
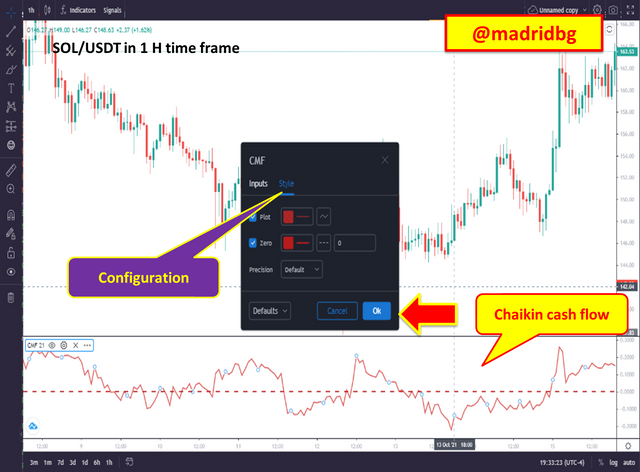
Step 3: Once the indicator is attached to the chart, we can configure the data input, such as the style of the indicator, for this particular we will change, the data input from 20 periods that comes by default to 21 periods and we will improve the appearance of the indicator so that it makes greater contrast with the background used for analysis.
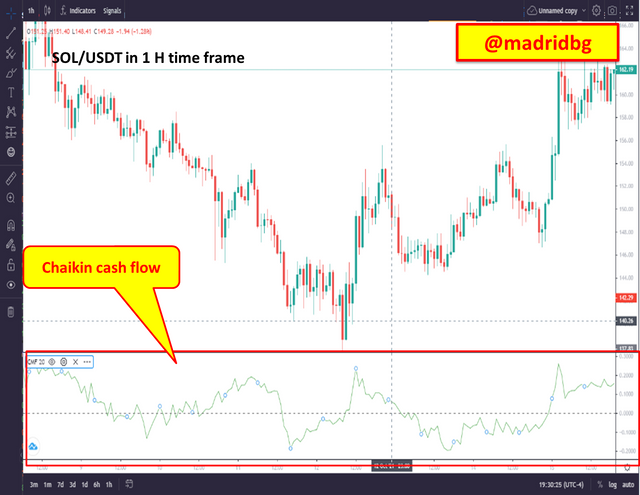
Let's see how to configure the indicator, for this we go to the configuration section as shown in the image, in the first instance we will go to the data entry, by default this in 20 periods, which we will change to 21 periods for reasons of the development of the explanation, once configured, the data entry we give accept.
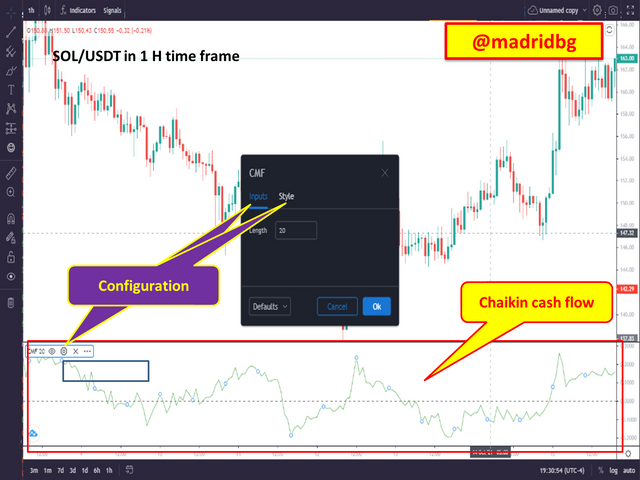
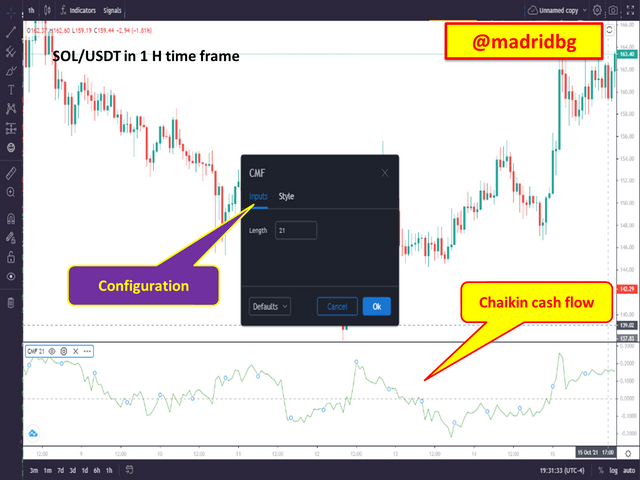
For the aesthetic configurations, we will go to the style tab, at this point we can change the color of the graph line, as well as the zero line, where we can modify the opacity of these and the color associated with them, in addition to the style of presentation either as a line, histograms, area, among others.
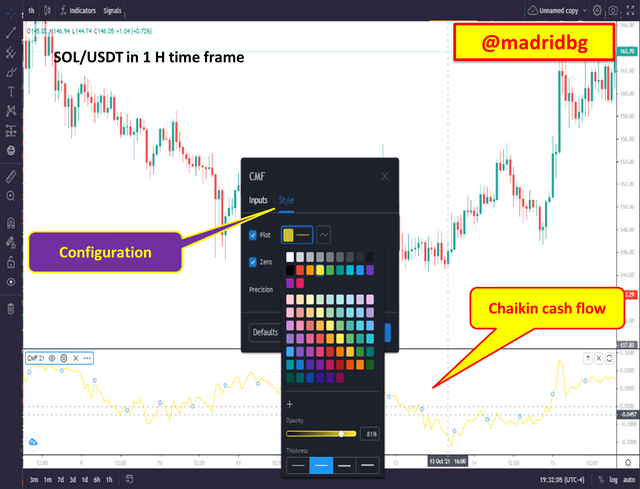
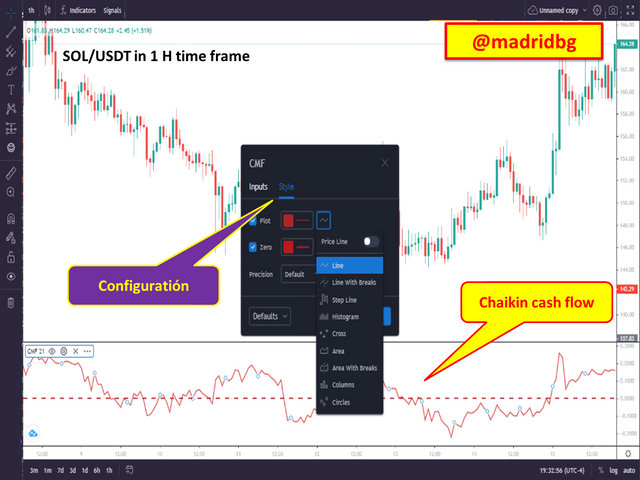
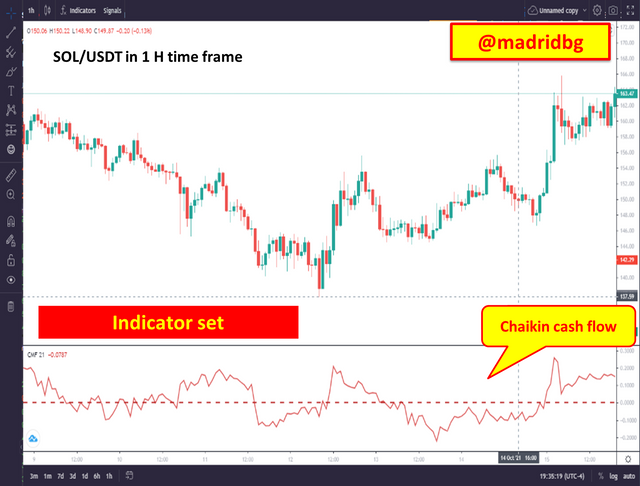
As we can see at the chart level, we have already configured the indicator according to our strategy and trading style, we only need to perform the analysis in conjunction with the behavior of this.
About the best configurations:
As with other indicators we have studied in this type of course, the recommended settings should be based on the type of trading style we perform, i.e., based on low or high seasonality.
In particular, it is expected that the configuration proposed by the author of the indicator is the best, in this particular 21 periods, but we all know that the market is changing, so the configuration that gives us greater effectiveness will be the one that best suits our work in the market.
What we must be clear about, is that the more periods the slower the indicator and the number of signals is reduced and in some cases is presented late, on the other hand, if we reduce the number of periods, the indicator will not throw a greater number of signals, which sometimes will make us doubt. So the ideal at this point, is to go testing different configurations, until you get the one that best suits our style.
We must also take into account that the most used configurations are those associated with 20 and 21 periods, for those traders who manage intraday timeframes from 4 hours to daily timeframes.
3. What is the role of the indicator in confirming trend direction and determining entry and exit (buy/sell) points?.

As we have been mentioning throughout the writing, the Chaikin money flow, allows us to measure the degree of interest held on an asset, as a function of the buying and selling pressure on the asset over a given period of time.
Based on the above, it is a matter of understanding that the surrounding values greater than zero, are considered bullish accumulation momentum and values less than zero are bearish distribution momentum, in other words, positive values indicate buying pressure, while negative values indicate selling pressure.
Consequently, it is to be expected that buy or sell orders, are set above the zero line for bullish scenario setting stop loss levels below the previous low and take profit in 1:1 risk reward ratio. In case of the bearish scenario, the orders should be below the zero line and the stop loss a little above the previous high, likewise the take profit should respond to the 1:1 risk/reward ratio.
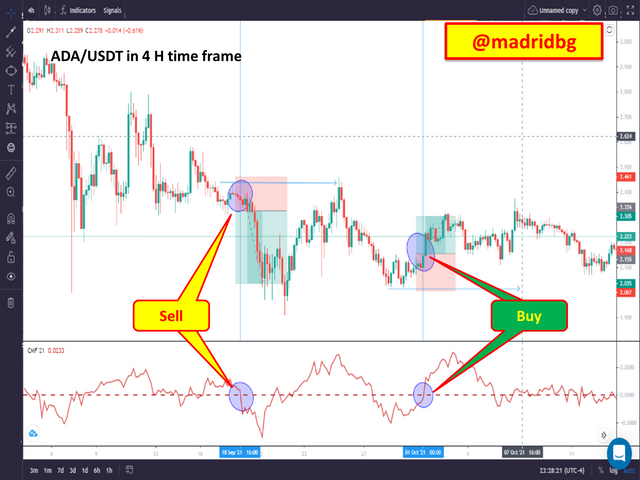
Minimizing risks according to the Chaikin cash flow indicator:
Based on the above, we can set our buy and sell orders, establishing wider trading zones, which allow us to filter the negative signals in a certain way. To do this we must, delimit the bullish buy zones from 0 to 0.15 and when the indicator line crosses this threshold speculate the price upwards, establishing stop loss zones a little below the zero line or previous low, in a 1:1 risk/reward ratio.
With respect to the bearish exchange zones, we can establish them with values ranging from 0 to -0.15 and at the moment of generating the crossing of the line speculate the price downwards, likewise establishing stop loss zones above the zero line or previous high and the take profit in a 1:1 risk/reward ratio. In this particular, due to the low volatility of the studied asset we have delimited the bullish confirmation line at 0.10 and the bearish confirmation line at -0.10.
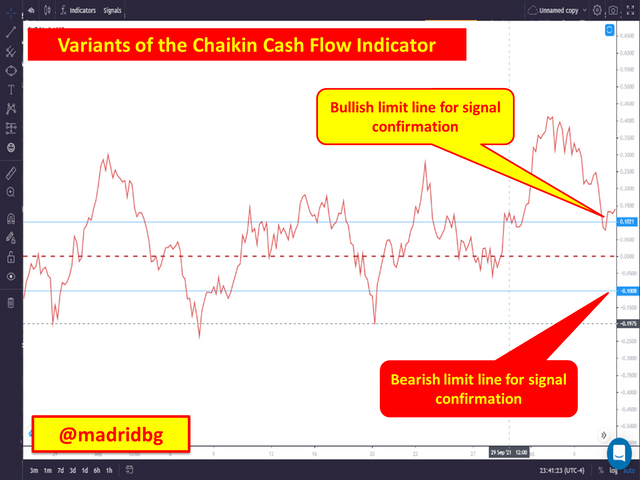
Under this scenario, we somehow establish a certain level of confidence in the trades, since if we enter just as the indicator crosses the zero line either bullish or bearish, we are prone to get caught more easily in the face of reversals in price action.
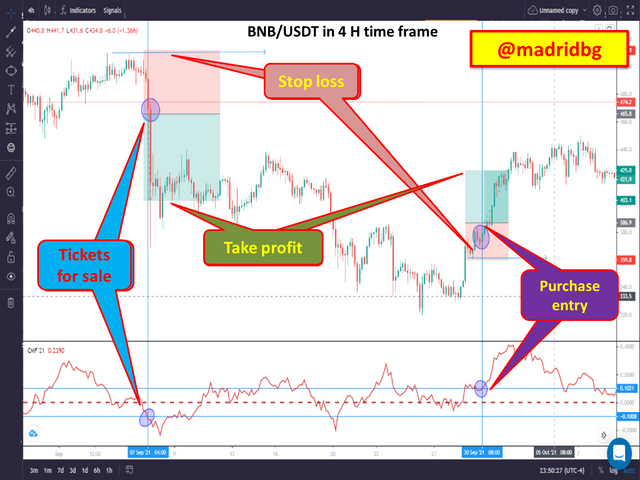
As we can see in the previous image the confirmations based on the Chaikin Money Flow indicator and the confirmation lines, allow in a certain way more reliable entry according to the crossing of the indicator line and those previously assigned by us as trader.
4. Operate with a crossover signal between the CMF and wider lines such as +/- 0.1 or +/- 0.15 or it can also be +/- 0.2, identify the most important signals that can be extracted using several examples.

In a certain way in the previous section we already addressed this issue, in this sense, it is necessary to remember that we will delimit the crossing lines at 0.15 for the bullish scenario and -0.15 for the bearish scenario, as a mechanism that allows us faster entries and with greater capitalization, since our percentages in stop loss, would not be so high.
Transaction 1: signal crossing between the CMF and the zone lines of higher amplitude, action in buy.
For the development of this operation we will use the SOL/USDT asset in 1 hour timeframe, where we will identify possible buy and sell signals, stop loss and take profit zones, as well as the false signals given by the indicator.
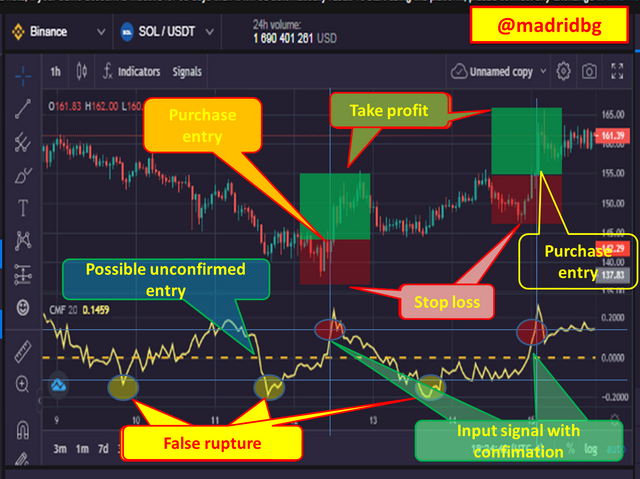
If we analyze the following image, we can realize the diversity of signals that throws the indicator, at this point the alternative lines allow us to filter the signals and in a certain way to enter through confirmations that provide us greater security in this regard and as you can notice we have established two signals of entries in purchase based on the crossing of the amplitude lines and the indicator and the CMF line.
Transaction 2: signal crossover between the CMF and the higher amplitude zone lines, selling action.
For this operation, we will rely on the chart for the BNB/USDT pair in 4-hour timeframe, and as we can see we have set the bullish levels at 0.10 on the breadth lines and for in bearish scenario at -0.10, so that the entries will be configured according to the crossing of the indicator line and the breadth lines.
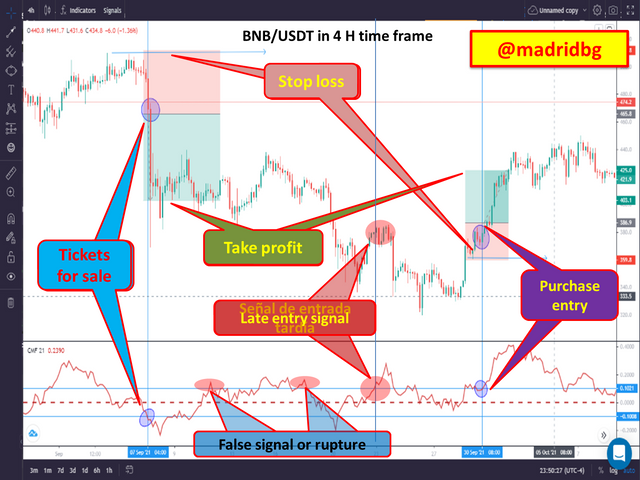
In this sense, we can observe in the graph that we have delimited effective crosses that allowed us to enter in purchase and sale for the studied asset, in the same way we can observe that the indicator provides us with false entries that we must learn to filter in order to be profitable in the market.
5. How to trade with divergence between the CMF and the price line? Does this trading strategy produce false signals?.

As we have mentioned in the analysis of other indicators, divergences are contradictions that occur between the price action and the behavior of the indicator in question, in such a way that bullish divergences are manifested as the price assumes a fall, while the indicator shows a rise. The opposite case occurs in bearish divergences, as the price will apparently continue to rise, while the indicator manifests us a fall.
In one scenario or the other, this type of patterns must be respected since the indicator has somehow anticipated the price and the chances that the divergences are fulfilled increase as shown in the images below:
Bullish divergence scenario:
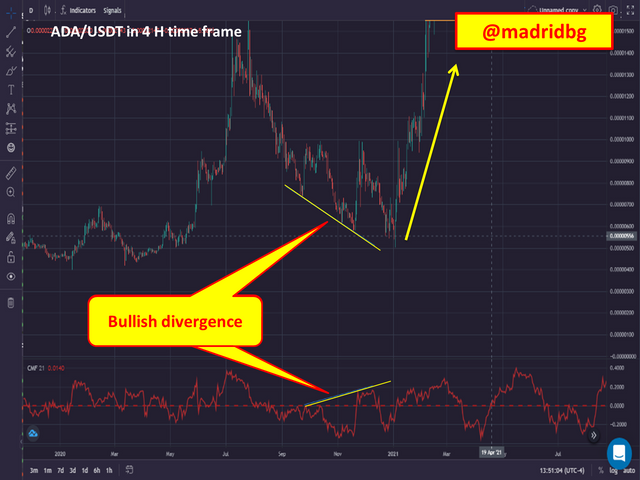
As we can see, the price of the ADA/USDT pair in 4 hours timeframe is falling, however, the indicator shows a rise, generating a divergence between the two, and as we can see the price ends up correcting and doing what the indicator says.
For traders these are patterns that we must respect and take advantage of the strong movements that form after these, so that profitability is achieved in the market.
Bearish divergence scenario:
As we explained above, this contradiction shows that the price will go up, while the indicator shows a higher probability that the price will end up falling. According to the image the bearish divergence has formed and the price ends up falling following the behavior of the indicator for the BTC/USDT pair in 4 hours timeframe.
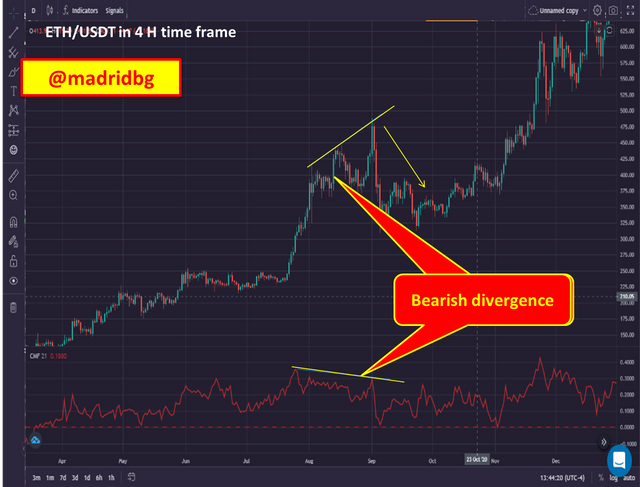
Does this trading strategy produce false signals?:
To answer this question, it is necessary to remember that no technical analysis is 100% absolute and true, since they are speculations that we make over time. In this sense, we cannot assume the divergence pattern as absolute, since like many indicators it can give false signals.
The important thing is to understand the scenarios that are formed in the price action and according to the practice and our experience in the market, to address in the best way the patterns that are formed between the indicator and the price of the asset under study.
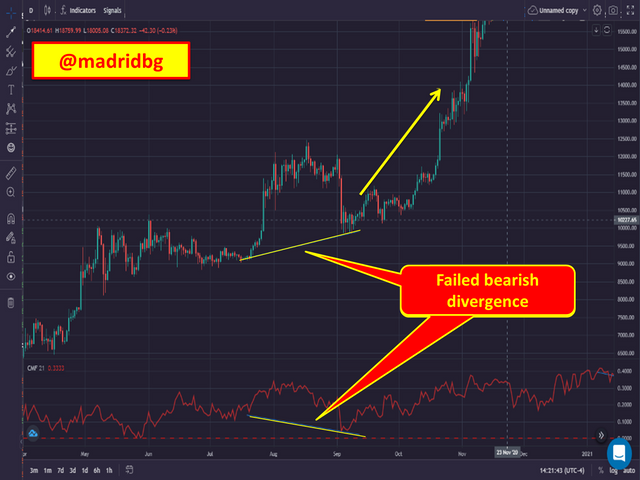
In the previous image, we can see the bearish divergence formed, so it is expected that the price ends up falling, however, the price action did not meet the established by the divergence and the price ended up rising, as you will see this has been a real example of the failure of the divergence pattern.

FINAL CONSIDERATIONS

As mentioned throughout this writing, the Chaikin cash flow indicator allows us to determine the degree of interest held on an asset in a given period of time, thus, it is presented as a great alternative that allows us to speculate according to the price action.
Its versatility allows us to determine that it has measured that the line moves above the zero line the movement is assumed bullish, on the contrary, if the indicator line moves below the zero line it is assumed bearish.
For its part, one of the ways to filter false signals is by confirmation lines that we can place above 0.10 for bullish movement and below -0.10 for bearish confirmation and the crossing of the indicator line and the previously established lines allow general usable confirmations in the price action.
In such a way, that this indicator should not be assumed alone, on the contrary it is a good alternative that allows to give strength to the trading strategy that we already have. At this point, I extend my thanks to Professor @Kouba and the #SteemitCryptoAcademy team for the valuable training they provide us every week.
OF INTEREST


Hello @madridbg,
Thank you for participating in the 6th Week Crypto Course in its 4th season and for your efforts to complete the suggested tasks, you deserve a Total|9.5/10 rating, according to the following scale:
My review :
Work with excellent content, because you take every question seriously, allowing you to get answers that are accurate, in-depth in its analysis and clear in its methodology. Here are some notes:
Good explanation of the CMF indicator with all its features and method of calculating it. You have given an obvious example but it is not correct since you have to provide the results of 20 previous periods to get the result of period 21. It was possible to add your opinion of the result obtained.
Most of your answers were successful, with just what is required. Only the last question could have been expanded further in its first part.
Thanks again for your effort, and we look forward to reading your next work.
Sincerely,@kouba01
Downvoting a post can decrease pending rewards and make it less visible. Common reasons:
Submit
Greetings Professor @kouba01 as always have been very assertive your observations, grateful with the valuation and we will continue learning through your teachings. Success in your work.
Downvoting a post can decrease pending rewards and make it less visible. Common reasons:
Submit