Authored by @madridbg, via Power Point 2010. Bernardo Madrid
Greetings and welcome dear readers of this prestigious platform, serve this installment as an opening to the activity assigned by Professor @kouba01, associated with trading with the rate of change indicator (ROC) and driven from the spaces of # SteemitCryptoAcademy.
In this regard, let's go to the body of the paper.

CONCEPTUAL AND PRACTICAL APPROACH TO TRADING WITH EXCHANGE RATE INDICATOR (ROC)

As has been a constant in my publications, this section is dedicated to the conceptual and practical explanation of each of the approaches suggested by the Docent, among which the following stand out:
1. In your own words, give an explanation of the ROC indicator with an example of how to calculate its value and comment on the result obtained.

Throughout our training with Professor @kouba01, we have learned that the price of an asset moves in a wave-like fashion, therefore, it is to be expected that there are ups and downs in the price action of an asset product of the degree of interest of bearish or bullish investors, in such a way it is normal to observe percentage variations in the price of the asset.
Based on the above, the ROC indicator is oriented to the early detection of the percentage variations of the price of an asset in certain periods of time. Operationally, it is considered as a technical indicator of oscillator type, which allows us to determine the momentum or percentage change in the price action of an asset from a previous period to a later one. Under this concept it is presented as a useful instrument that allows us to determine trend changes according to the evaluation of the percentage changes in the prices of an asset, as well as the strength of the trend, possible reversals and the continuation of lateralization scenarios.
About your graphic presentation:
In later sections we will be able to discuss in depth the operation of the indicator, however, as a prelude we can establish that at the graph level we can observe that the ROC is represented by a line that moves above or below the 0 line, where movements above the zero line are indicative of bullish movements, therefore the ROC values will be positive. On the other hand, if the ROC line moves below the zero line, the scenario points to bearish movements, generating negative values in the indicator.
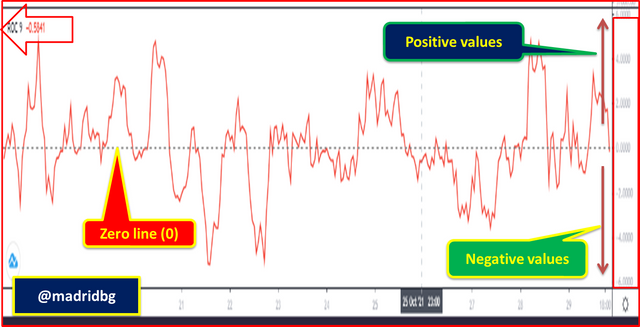
Based on the above, the indicator allows us to establish overbought and oversold zones of the asset, taking as a reference point actions in the price that have exceeded the equilibrium zones in the market, we can also determine the trend continuation zones, as well as those where clear reversal scenarios are observed, identifiable with this indicator.
On how it is calculated:
As we can see in the title of this section, we will address the mathematical equations behind the ROC indicator, which will allow us to understand in depth how it works and the advantages we can obtain when speculating in the market.
In this sense, I have decided to prepare a sequence of images, which will allow us to develop this section and that we can follow below.
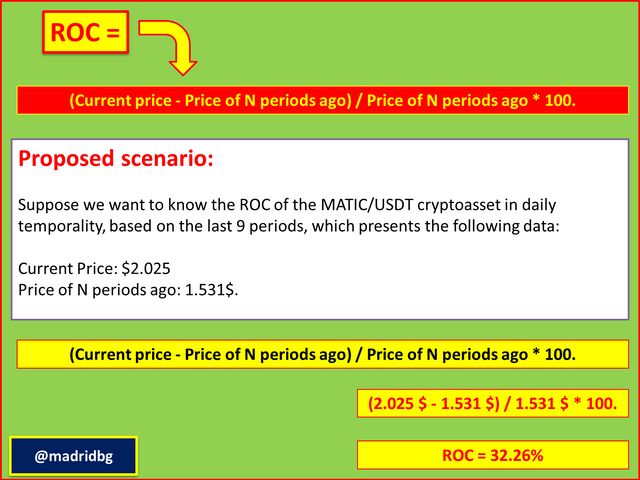
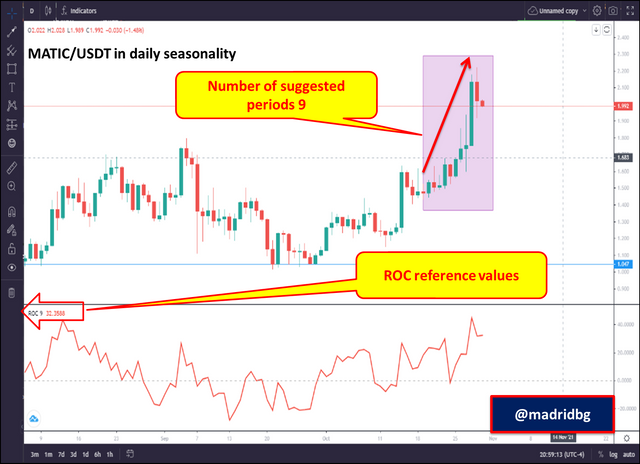
As we can see in the images above, we have mathematically determined the ROC values for a total of nine periods in daily temporality of the MATIC/USDT pair yielding values of 32.26% which is indicative of the considerable percentage increase that has presented the asset in question, so that those who decided to invest in it have been able to generate substantial percentage gains, an aspect that we can confirm with the behavior of the asset price in the graph presented above.
2. Demonstrate how to add the indicator to the chart on a non-tradingview platform, highlighting how to modify the period settings (best configuration).

As has been constant in my publications, associated with technical analysis, the behavior of the asset and their respective analysis are executed through the bitsgap platform, as it allows us to add a variety of financial instruments with a user-friendly interface. In this sense, let's go to the sequence of steps to include the ROC indicator in the chart.
Step 1: go to the bitsgap website ( https://app.bitsgap.com/trading ) and look for the trading section, then select the asset pair you want to analyze.
Step 2: We go to the FX function and in the search tab we type ROC, selecting the option provided by the platform.
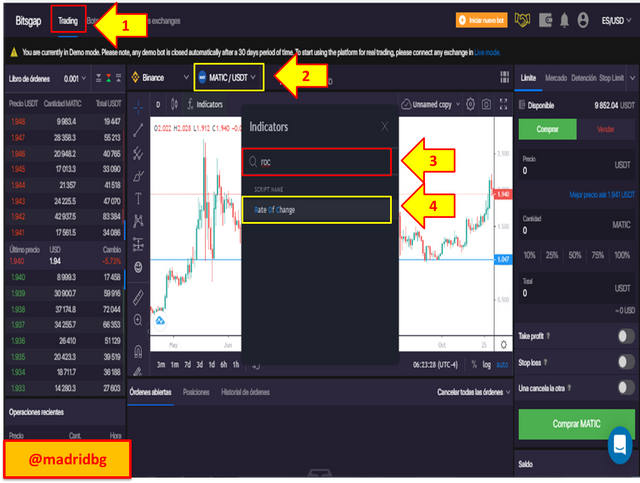
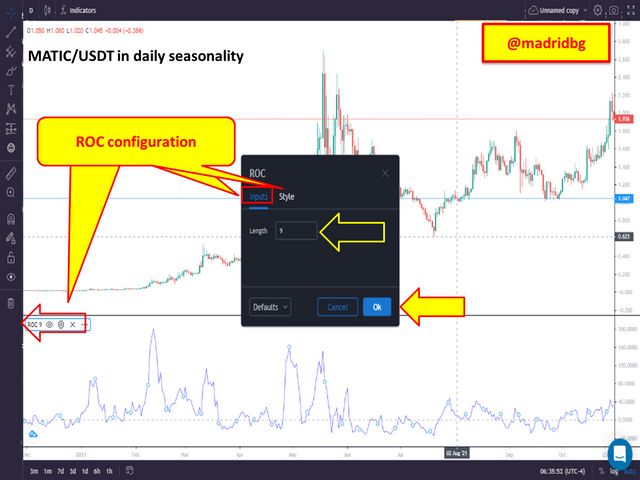
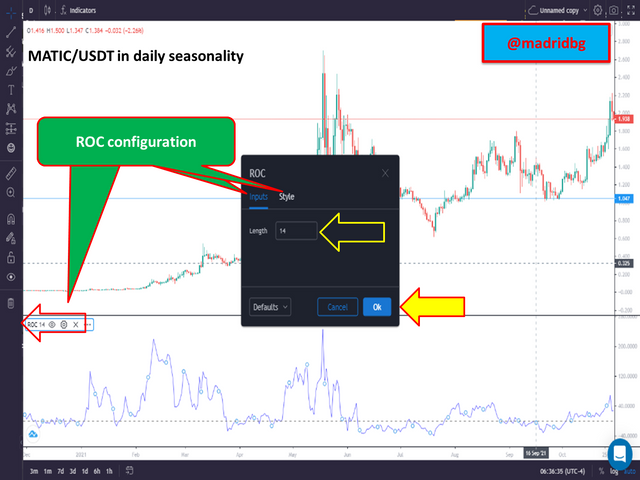
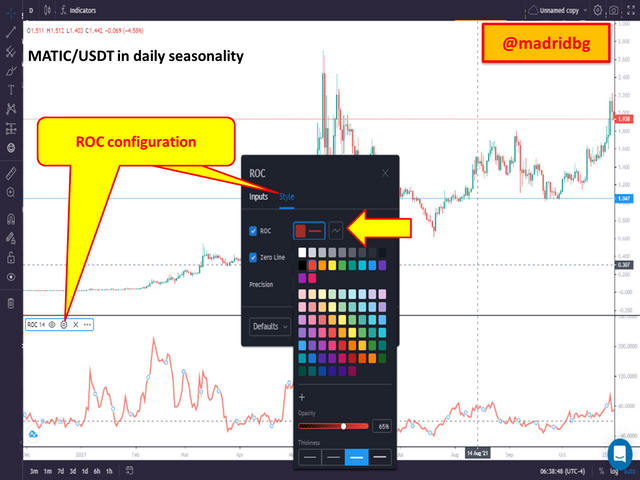
Step 3: once the indicator is added to the chart, we can configure the data input, as well as the style of the indicator, for this particular one we will change the default data input from 9 to 14 periods since it is a value that allows the indicator to follow the price with a certain degree of balance, because if the periods are very low, many false signals are generated and if they are very high, the indicator tends to throw many late signals.
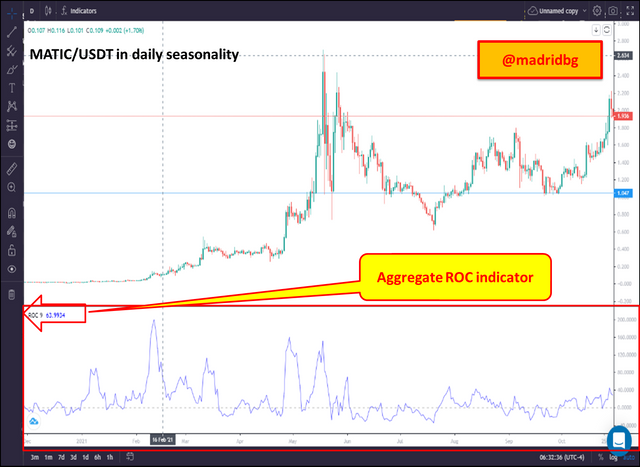
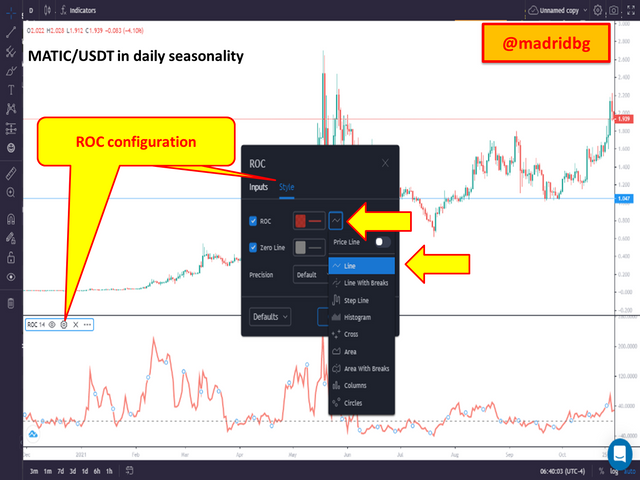
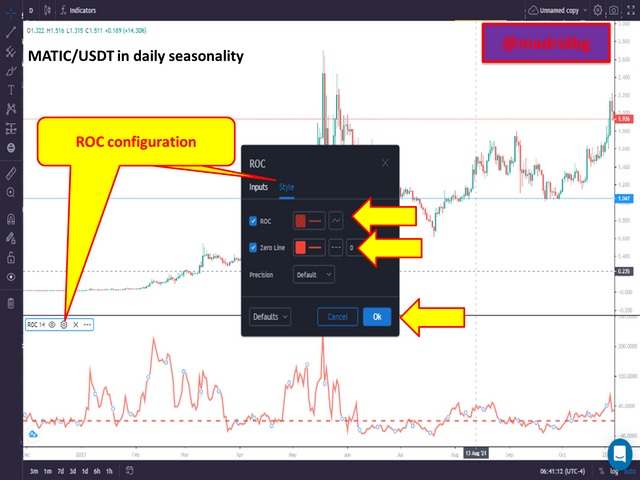
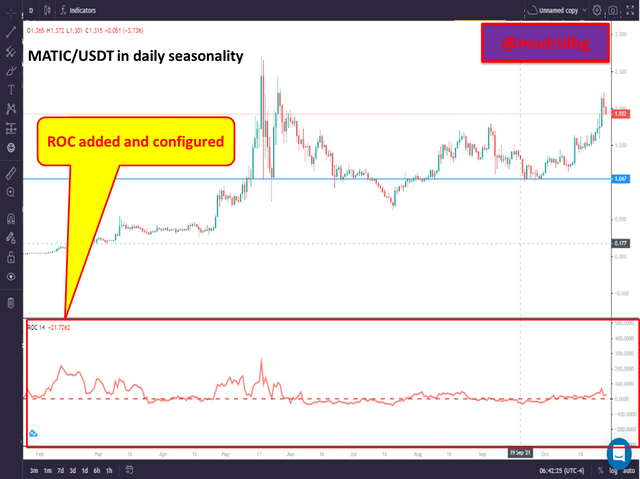
At this point, let's follow up on the configuration of the indicator, for this, we must go to the configuration section as shown in the image, in the first instance we will go to the data entry, by default it is in 9 periods, which we will change to 14 periods for reasons of the development of the explanation, once configured, the data entry we have chosen is accepted.
For the aesthetic configurations we will go to the style tab, at this point we can change the color of the graph line, as well as the zero line, where we can modify the opacity of these and the color associated with them, in addition to the presentation style either as line, histograms, area, among others.
About the best configuration associated with the ROC indicator:
This approach usually produces discrepancy between analysts, from my point of view technical analysis, the best configuration, depends on the strategy of each trader, ie, is his trading style and in the effectiveness of the strategy that has managed to develop depending on the group of indicators that has decided to choose.
In this sense, it is expected that the default configuration is the best configuration, however, knowing how changing the market is, this is not always true, so we return to the fact of setting configurations according to our trading style.
In such a way, we must be clear, that the chosen configurations follow specific behaviors, where they stand out, the more periods the slower is the indicator and the number of signals is reduced and in some cases is presented late, on the other hand, if we reduce the number of periods, the indicator will throw us a greater number of signals, which sometimes will make us doubt the possible entries in purchase or sale and we must learn to filter them.
3. What is the trend confirmation strategy of the ROC indicator and what are the signals that detect a trend change?.

As mentioned in the previous sections in the ROC indicator, it shows percentage changes in the price action, at this point, its movements are developed according to the zero line. In this sense, strong impulses on this line are an indication of bullish movements resulting from the pressure that bullish investors are generating on the market, so that the market trend will be upward.
On the other hand, when the percentage levels, when they are in negative values, i.e. below zero, are indicative of the pressure exerted by bearish investors, at this point the market will enter a downtrend.
Based on the above, we can establish that the crossings of the zero line, either bullish or bearish are those that delimit the direction and trend of the asset according to the ROC indicator, so that the stronger the progression of the percentage values of the ROC the greater the bearish or bullish momentum respectively.
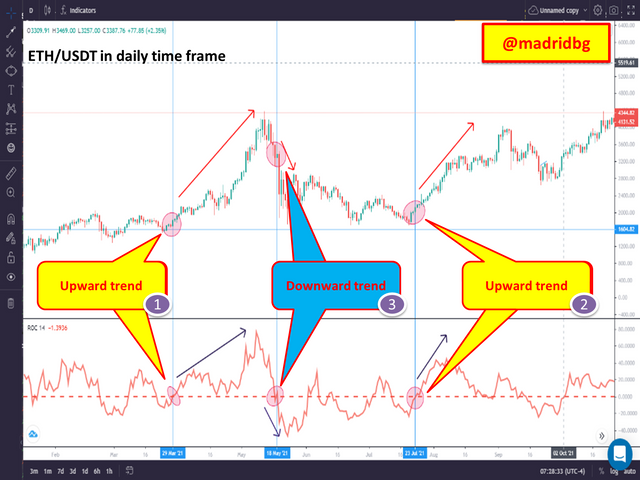
If we analyze the chart above, we can see how the ROC line for patterns 1 and 3 move above the zero line, which is indicative of the bullish momentum generated, now, as a trader we must look for signs of confirmation of trend change and at this point it is presented when the indicator touches the zero line from the bottom up and breaks it with force and as you will see the uptrend in the ETH/USDT pair in temporality would not be long in coming (see patterns 1 and 3).
On the other hand, when the percentage levels slow down or decline, we can look for reversal signals that occurs as the ROC line crosses from up to down the zero point of the indicator, this is an indication of the reversal of the trend from bullish to bearish (see pattern 2). In both scenarios, we must wait for the price to confirm the indicator's movements before deciding to speculate on the price of an asset.
Therefore, it will be the crossovers from up to down (bearish) or vice versa (bullish), which will allow us to observe the trends in the price of an asset and speculate based on these, other indicators that we can use as a reference to changes in trends, are the overbought or oversold areas generated in the price of an asset, however, these aspects will be described later in this paper.
4. What is the role of the indicator in determining buy and sell decisions and identifying overbought and oversold signals?.

In the previous section we described that the central line or zero line of the indicator, is the reference point to establish the trend and therefore the entries in buying and selling in a cryptographic asset. At this point, we must take into account the following aspects:
1. When the indicator moves around the zero line, it is an indication of investors' indecision about the asset, therefore, it is necessary to wait for direction and strength that allows us to establish the trend to speculate on the price action of an asset.
2. For buy entries, it is necessary to observe a crossing of the ROC line from bottom to top above the zero line, so that the stronger the crossing or breakout, the greater the upward momentum generated, an aspect that we can analyze by the increase in the percentage levels of the ROC and the price of the asset under study and therefore a deceleration in the previous or previous trend.
3. For sell entries, it is necessary to establish the crossing, of the ROC over the zero line, but at this point it will be from up to down and the stronger the impulse to break the zero line the greater the downward movement observed. These aspects we will be able to analyze as the percentage levels of the price will decline according to the pressure of bearish investors, again it is necessary, to expect a deceleration in the previous trend through price action.
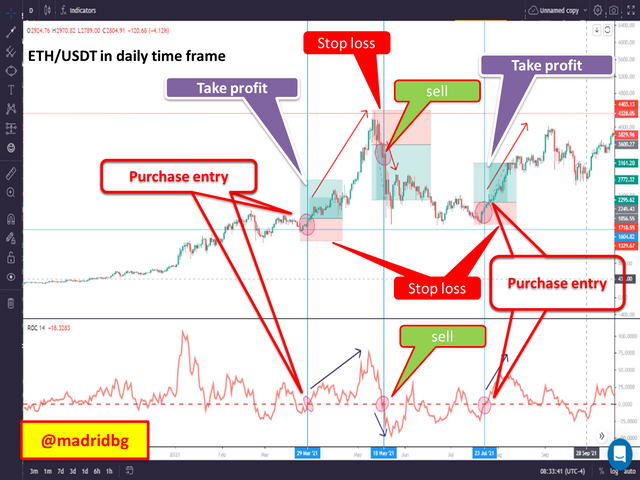
As we can see in the chart above, we have delimited buy and sell zones according to the ROC indicator, setting take profit and stop loss zones that respond to the 1:1 risk/reward ratio. The important thing at this point is that the reader understands that the entries occur after the crossing of the ROC and the zero line that makes up the indicator.
About overbought and oversold signals:
To establish overbought and oversold signals based on the ROC indicator, we must establish boundary lines that allow us to determine the ups and downs we are willing to speculate on the asset in question.
In this particular these lines are usually placed between 3 and 4% above and below the zero line. In this particular we have set the top and bottom line at 4% as seen in the chart below:
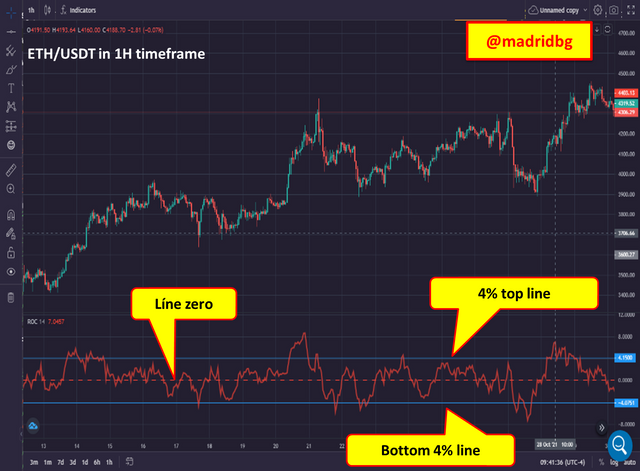
Now, it is necessary to be clear that any movement above the upper line are considered as overbought zones that we can speculate and profit in the market by selling our assets once the correction or percentage decrease of the ROC is observed.
Similarly, those values that are below the lower line, are considered as oversold zones that we can use and speculate on the price of the asset under study, again we must wait for the correction and in this sense, that a percentage increase in the ROC arises.
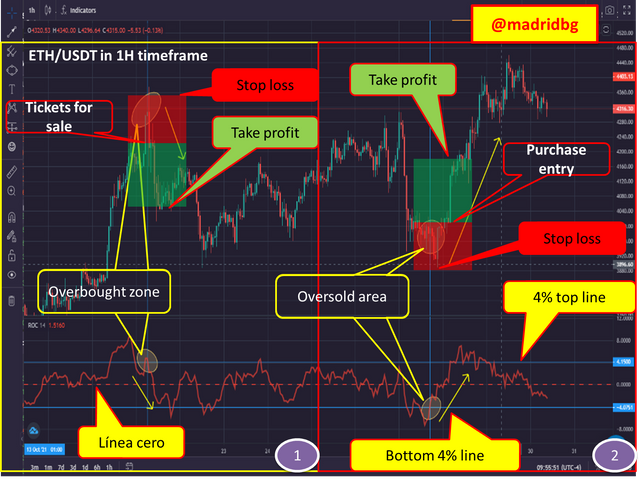
If we analyze the previous chart we have delimited two scenarios, in the first one we observe that the asset is overbought since the ROC line is above the danger line stipulated in the 4% and we have stipulated a sell order when the percentage levels start to fall and the ROC line returns to the upper line, establishing take profit and stop loss zones in a 1:1 risk reward ratio.
On the other hand, scenario 2 shows us that the asset is oversold and we prepare to speculate the asset in purchase, for this we must wait for the ROC line to return to the lower 4% danger line and speculate based on this, likewise we set the stop loss and take profit zones in 1:1 ratio.
In this sense, both analyses for the ETH/USDT pair in daily timeframe were fulfilled, so the ROC or percentage movements in a good ally to speculate on the price action.
5. How to trade with divergence between the ROC and the price line - does this trading strategy produce false signals?.

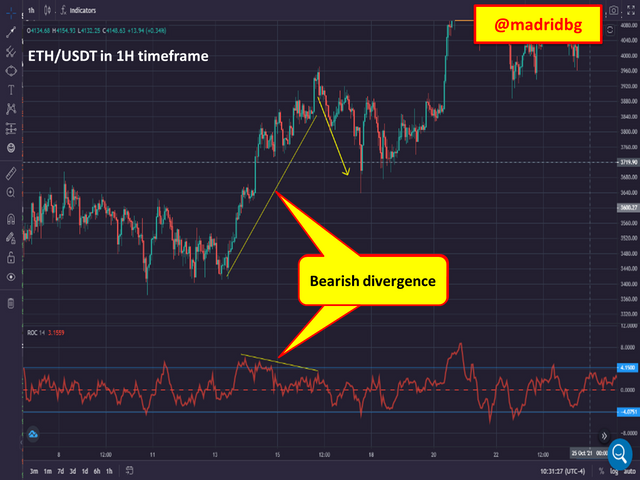
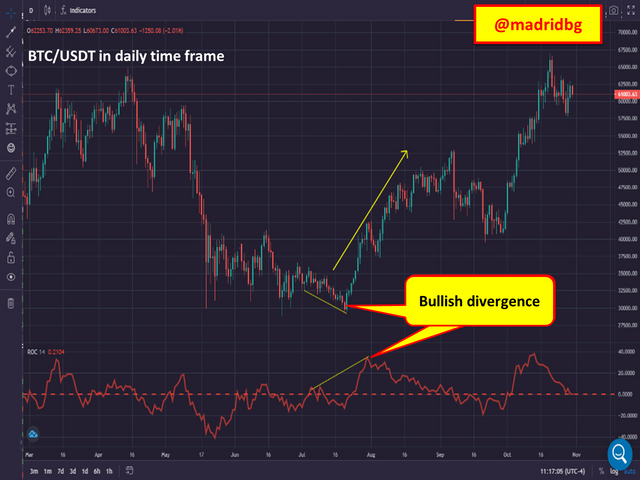
As is well known, divergences are contradictory variants between the indicator and the price action, so we can establish that bullish divergences manifest themselves when the price assumes a fall, while the indicator shows a rise, on the contrary, in bearish divergences the price will apparently continue to rise, however, the indicator indicates a possible fall.
By way of observation, in one scenario or the other these divergences must be respected since in most cases it is presented as a consequence of the projection of anticipation that the indicator has shown on the price and the probabilities that they are fulfilled in divergences scenario is higher.
On bearish divergences:
As we have previously established this is presented since the price will apparently continue to rise and the indicator marks a fall, this scenario can be seen in the following image and as can be seen, it is fully met as established by the indicator, since the price for the ETH/USDT pair in daily temporality, ends up falling and respecting the divergence generated, hence these patterns are of great interest to traders as it allows them to speculate on the price action of an asset.
On bullish divergences:
In this case the price marks a fall, while the indicator gives us bullish signals, as we will see in the following chart for the BTC/USDT pair in daily timeframe, the bullish divergence has been fulfilled as the price ended up rising.
By way of summary, we can establish that the divergences whether bullish or bearish, beyond a contradiction between the indicator and the price action, represents a period of transition from one dominant part to another, ie, if we are in a bullish scenario and a bearish divergence occurs, it gives us signals that the buying pressure is decreasing, where the pressure exerted by sellers is greater, hence the price respects the divergence and ends up falling. The opposite case occurs in bullish divergences, where the selling pressure decreases and the buying pressure increases, hence the price of the asset ends up rising.
False signals depending on the divergence trading strategy:
As we have explained in previous classes, none of the patterns or indicators used are 100% reliable, hence, we must look for confirmations based on other trading systems.
In the case of divergences, it is normal to observe failures in them, so it is essential to learn to filter the signals and differentiate the true ones from the false ones, through a trading system based on different indicators that allow us to obtain greater commercial profitability when trading in the market.
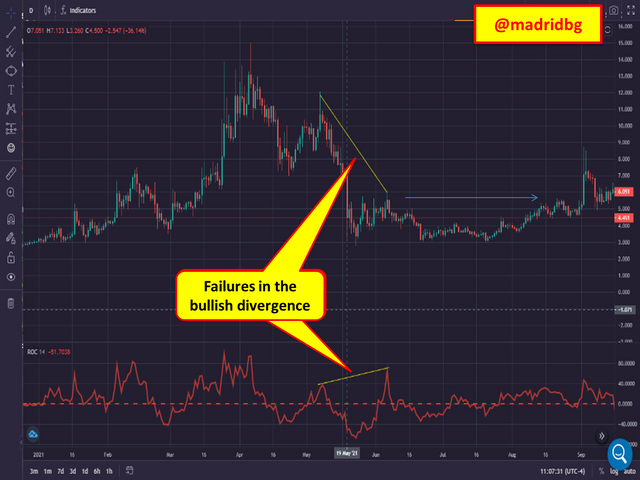
If we analyze the previous graph, the divergence formed is bullish, so it is expected that the price of the asset under study rises and achieve capitalize that rise in the market, however, the price ends up generating a zone of lateralization or indecision that does not allow the divergence to be fully met, so that a failure is generated in the divergence formed.
6. How to identify and confirm breaks using the ROC indicator?.

Before explaining this type of behavior in detail, it is necessary to highlight that breakouts are abrupt movements that are generated in the market, product of a large capitalization in that period of time, capitalization that can be caused by bullish investors when they buy or bearish when they sell.
In both scenarios, if the capitalization is strong the market moves with speed, strength and direction, a product of the amount of orders that have been placed for the time period studied. In the chart below for the for MATIC/USDT on daily timeframe, we can see that the market for this asset, had entered a sideways pattern, also known as market indecisions which can be by accumulation or by distribution.
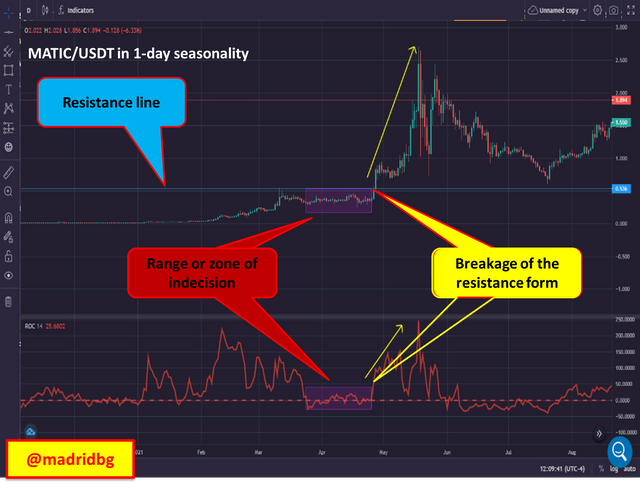
In this particular case, the range formed was by accumulation, which term generated a large upward momentum that breaks the resistance formed and that the ROC indicator registers with a strong movement above the zero line studied previously. In this sense, the ROC indicator allows us to identify the strong movement or breakout generated in the market and speculate based on these.
7. Review the chart of any cryptocurrency pair and present the various signals given by the trading strategy based on the ROC indicator..

Undoubtedly, the ROC indicator allows us to have valuable information about the behavior of an asset so that we can speculate on the price action and establish winning trades that allow us to be profitable over time.
In this sense, it is necessary to remember that by means of this indicator we can detect the following signals that we will illustrate graphically:
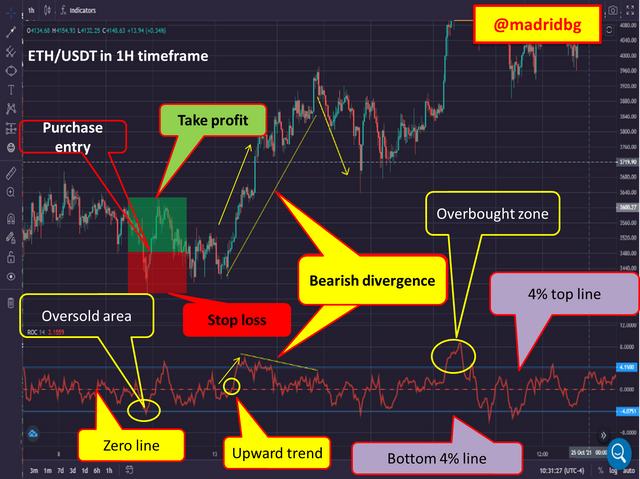
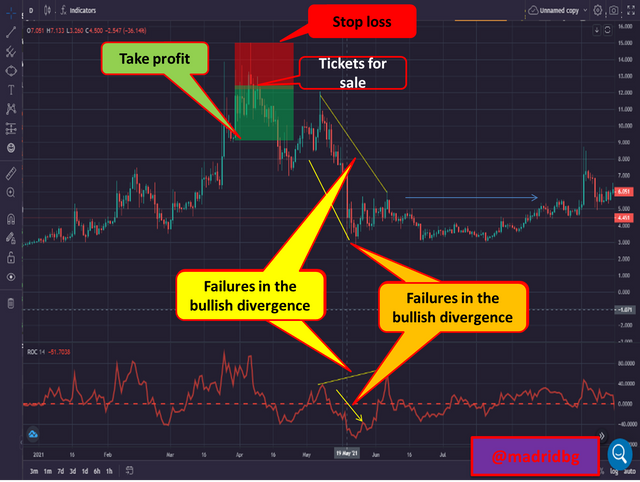
1. Signals of identification of bullish and bearish trend, in order to establish these signals we must identify the movements generated by the ROC line in relation to the zero line of the same, remembering that movements above the zero line are indicative of bullish movements, while movement below the zero line, show us bearish behaviors.
It is also necessary to highlight that we can rely on other indicators to detect through confirmations the trend with which we would be working.
2. Overbought and oversold signals of an asset, in this case we rely on the danger limits set at 4% for overbought zones and -4% for oversold zones. This type of signal is decisive for buying or selling an asset and our orders must be placed once the price has made the respective upward or downward correction, i.e. the price returns to one of the limits it has exceeded.
3. Divergence signals, as we have already mentioned they can be bullish or bearish, therefore, in one scenario or another, they are contradictions that occur between the price and the indicator and are usually used to enter or exit the market.
By way of practice on the following charts for the BTC / USDT pair on the daily time frame we have identified each of the signals studied in this section and that we have discussed throughout this writing, which will allow the reader to have a broader view of the ROC indicator, and the technical fundamentals behind it.

FINAL CONSIDERATIONS

Throughout this writing, we have addressed the potential of the indicator and as we have discussed in each section of this work, it allows us to speculate on the price action of an asset through the knowledge of the percentage change in the price of this, also product of its function as an oscillator is a suitable tool that allows us to know the direction of the trend, as well as the divergences that is formed in the price action of an asset and the and overbought and oversold areas of the same.
From there that its configuration and use, based on the accompaniment of other indicators that provide us with confirmations, can come to form a profitable trading strategy over time. Therefore, I consider it appropriate to thank the #SteemitCryptoAcademy team and Professor @kouba01 for the valuable training provided to us every week.
OF INTEREST


Hello @madridbg,
Thank you for participating in the 7th Week Crypto Course in its 4th season and for your efforts to complete the suggested tasks, you deserve a Total|8.5/10 rating, according to the following scale:
My review :
Good content in which you were able to answer all questions related to the ROC indicator with a clear methodology and depth of analysis which is a testament to the outstanding research work you have done.
Do not use the #club5050 tag unless you have made power-ups in the last 7 days that are equal or greater than any amount you have cashed out.
Thanks again for your effort, and we look forward to reading your next work.
Sincerely,@kouba01
Downvoting a post can decrease pending rewards and make it less visible. Common reasons:
Submit