Authored by @madridbg, via Power Point 2010, using public domain images. Gerd Altmann
Greetings and welcome dear readers, our training on economic issues associated with trading and technical indicators continues and every week the courses promoted from #SteemitCryptoAcademy are more promising. In this sense, this publication is aimed to comply with the course socialized by Professor @kouba01 in this week 5 of season 5 of the academy.

INTRODUCTION

For nobody is a secret that experience in the world of trading is fundamental and according to many experts this experience is assumed by facing the highs and lows in the market, that is, learning from the successes but also from the losses or mistakes that are usually made in the operations that are decided to open and it is these experiences that will allow us to face the market and the processes of speculation in a more dynamic and accurate way, with basic knowledge to do so.
Based on the above, the knowledge of technical analysis is fundamental, as well as the speculations that can be made at the level of fundamental analysis or news that affect the markets, in such a way that currently there are a variety of financial instruments or indicators that allow us to describe the price action and the behavior of the same, based on trend lines, the uses of supports resistance, volume profiles, regression methods, among others.
In this sense, the body of this work will be dedicated to the understanding of the linear regression method presented in the market, as a tool that allows to identify, confirm and evaluate changes in trends that occur in the price of an asset.p>


1. Cover image designed by @madridbg, using public domain image
2. All charts used in this publication, are screenshots taken by @madridbg, through the tradingview platform.


CONCEPTUAL AND PRACTICAL APPROACH TO THE LINEAR REGRESSION INDICATOR

In this section of the subject, we will provide answers to each of the questions requested by Professor @kouba01, so that readers can understand how this method of speculation works.
1. Discuss your understanding of the principle of linear regression and its use as a business indicator and show how it is calculated..

A linear regression is a statistical tool that follows the principles of scatter plots, knowing that it is based on a straight or central line that moves between those values closest to the real or daily behavior of the price of an asset.
In other words, the line is connected to where there is less separation or dispersion between the values under study and based on the above, the statistical process is used to predict the possible movements in the price of an asset, which is why it is understood as an indicator of overextension of the price.
According to the teaching and conceptual contributions transmitted by the professor, we can establish that the linear regression indicator, translates into a straight line that is based on the square of the distance of each point presented in the graph, which makes it possible that the analysis based on the indicator is much more accurate, because it assumes the points closest to the line, generating a scenario of more reliable accuracy when trading in the market, hence it is so widely used to identify changes in trends and projections of these based on the behavior of the price of an asset.
Like any other method of speculation, the linear regression indicator focuses on the study of variables such as time (temporality) and the price of the asset and according to these the line that converges in the most accurate way between the points that form the price is determined.
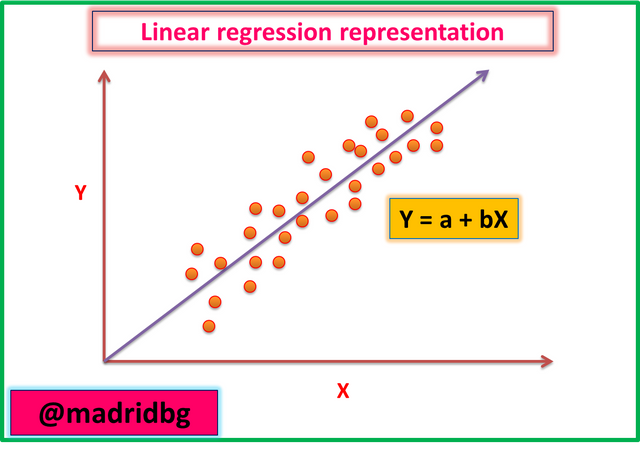
As we can see in the previous image, from the set of points that the price has drawn, the line is drawn according to the statistical data by the area where there is greater convergence of these points, which represents the closest values to normality in the price of the asset.
This analysis behavior was first coined by Gilbert Ruffy, who assumed the behavior of moving averages, but generating a shorter delay due to the use of the square of the values studied, which make the indicator work in the identification and monitoring of trends, as well as the regressions of the same.
On how it is calculated:
As previously mentioned, it is based on the use of the squares of the distances between the points that confirm the price of an asset, based on the above Gilbert Ruffy proposed the following equation that allows to determine the linear regression line.
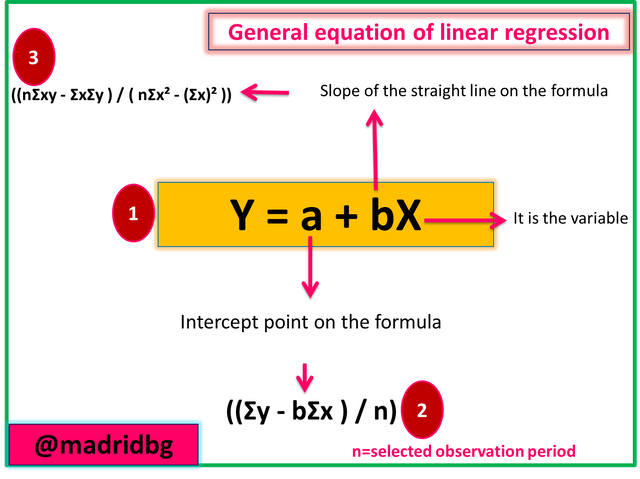
As we can see in the previous image, the calculation process is based on complex secondary equations that merit spending time in the selection of data for the execution, in that sense, we have explained in a conceptual and detailed way the method applied to calculate the linear regression indicator, as well as the equations used in each statistical process that composes the indicator.
2. Show how to add the indicator to the chart, how to configure the linear regression indicator and is it advisable to change its default settings?.

To add the linear regression indicator to the chart, we will rely on the tradingview platform, so we are going to sequence of steps to achieve this task:
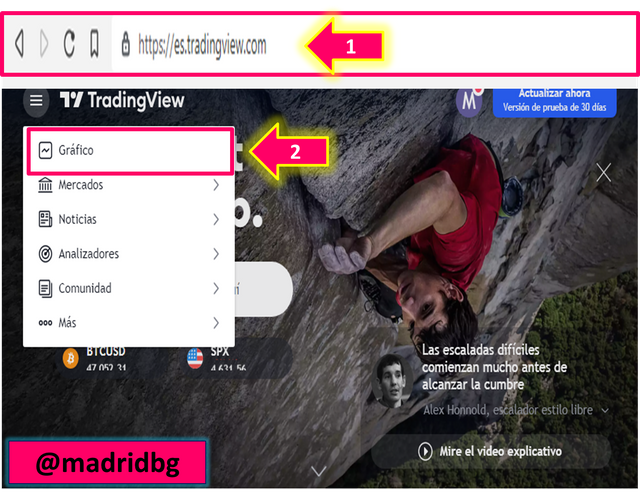
Step 1: we must visit the trading website (https://es.tradingview.com) and look for the chart section, then select the asset pair you want to analyze, after that, we go to the FX function and in the regression search tab, selecting the option that we have delimited in the image below.
Screenshot taken by @madridbg through the tradingview portal. tradingview
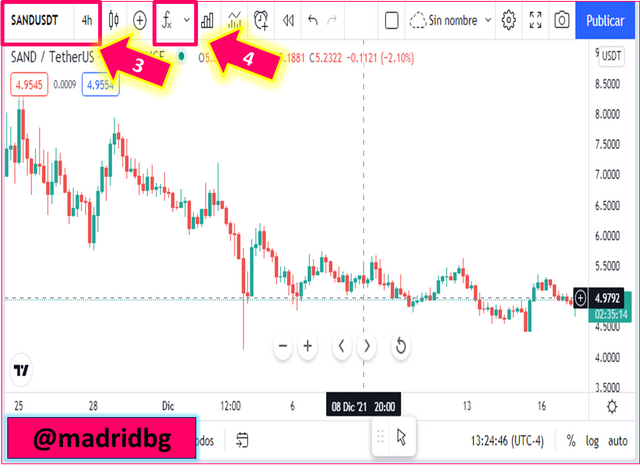
Screenshot taken by @madridbg through the tradingview portal. tradingview
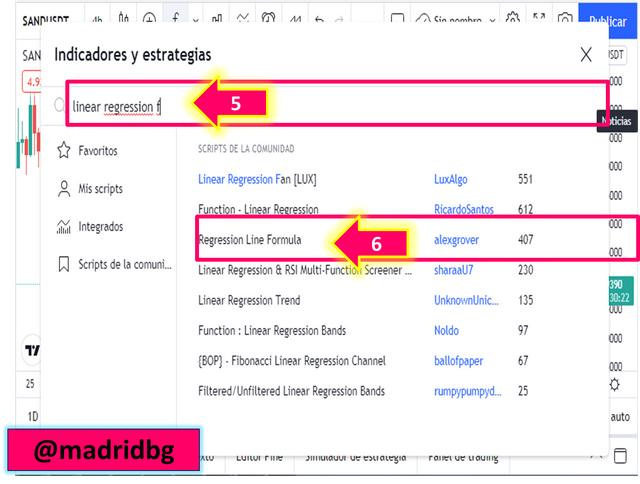
Screenshot taken by @madridbg through the tradingview portal. tradingview
Step 2: already added the indicator to the chart, we can configure the data input, as well as the style of the indicator, at this point, let's follow up on the configuration of the indicator, for this, we must go to the configuration section as shown in the following image, in the first instance we will go to the data input and choose the chart option, once configured, the data input we have chosen is accepted.
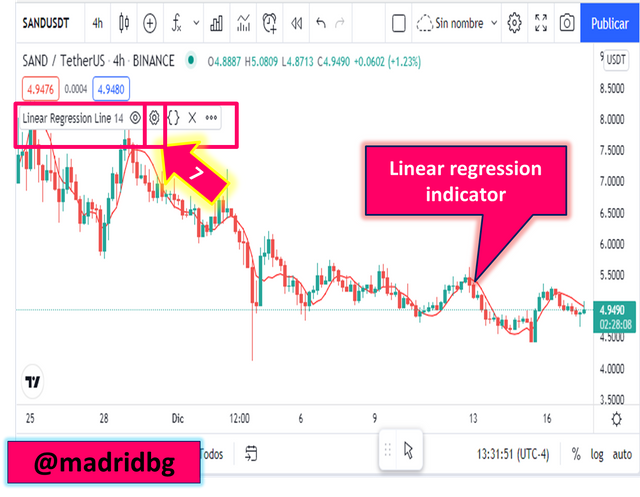
Screenshot taken by @madridbg through the tradingview portal. tradingview
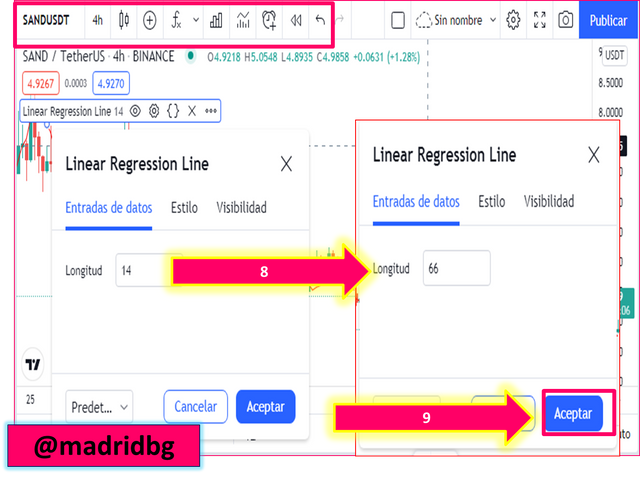
Screenshot taken by @madridbg through the tradingview portal. tradingview
As we can see in the previous image we have used the number of periods that well by default in our graph, however, let's observe in the image below how the regression line of the indicator is modified when configuring a period of 66, change that we will discuss in the next section when we make mention of the best configuration of the indicator.
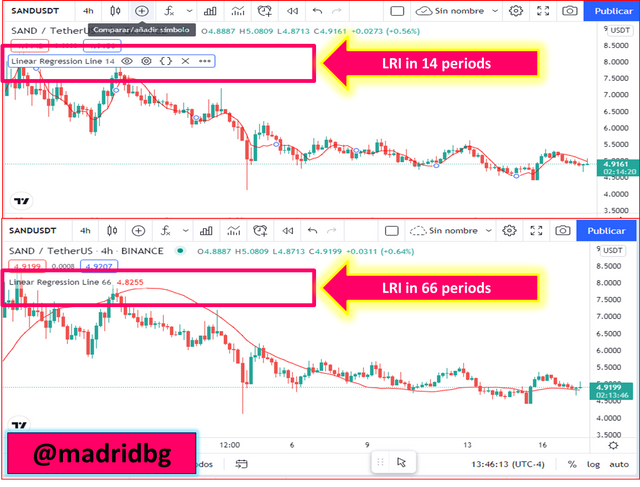
Screenshot taken by @madridbg through the tradingview portal. tradingview
Step 3: For the aesthetic configurations we will go to the style tab, at this point we can change the color of the graph line, where we can modify the opacity of these and the color associated with them, in this particular we will work with the red color that comes by default, except that we increase the thickness of this.
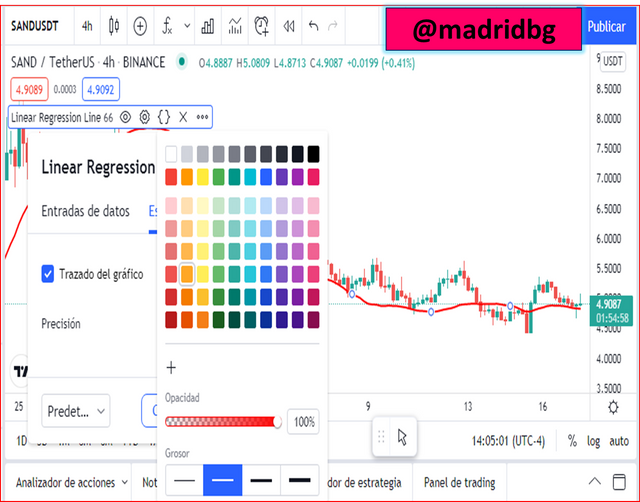
Screenshot taken by @madridbg through the tradingview portal. tradingview
Is it advisable to change your default settings?
This type of approach usually produces controversy among different traders, personally, I think that the settings should be adapted to our trading style and our trading strategy of speculation.
We must remember that the recommended settings are those that have been studied by the designers or creators of the indicators and therefore have been evaluated in different scenarios and behaviors, so it is expected to be the one that best responds, however, beyond the above, we must remember that the market is changing so trading strategies are adaptive as well as indicators.
Hence, if we look at the image below, we realize that the regression line in 14 periods behaves as an EMA that does not leave the price movements, so the information assumed is poor, so it is necessary to increase or decrease the evaluation period according to the temporality, In this sense, we have changed to 66 periods, which according to the approaches suggested by the teacher, good results are obtained in daily and weekly time frames since the movement of the regression line behaves as dynamic support and resistance lines, besides clearly observing the trend and behavior of the price.
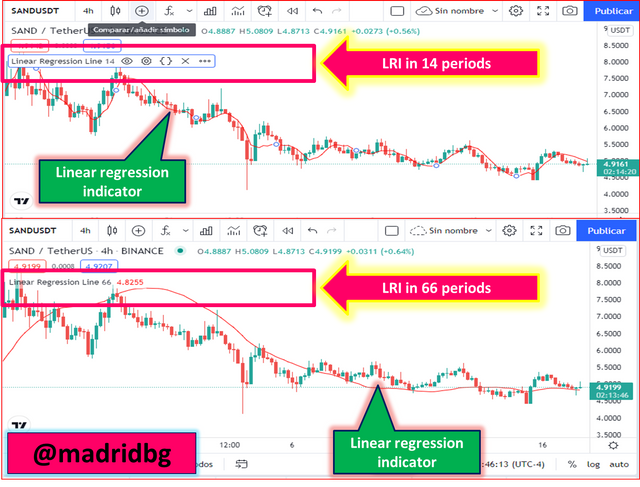
Screenshot taken by @madridbg through the tradingview portal. tradingview
3. How does this indicator allow us to highlight the direction of a trend and identify any signs of change in the trend itself?.

As we mentioned in the initial section of this work, the regression line is assumed as a point of equilibrium in the price action, so it is extremely important in monitoring strategies such as trend reversal, so that we analyze the behavior of the indicator, according to the trend following and trend reversal.
On the assertion of trend direction:
To address this type of behavior, we will rely on the BNB/USDT daily time frame chart, in this sense, the confirmation and affirmation of the trend can be detected by visual aspects associated with the location and direction of the regression line.
At this point, we will rely on visual aspects and the location of the line, so we will be addressing the behavior for the asset BNB/USDT in daily temporality, in such a way that if this is below the price action, it is an indication that the trend is bullish and that the buying pressure exceeds the selling pressure, at this point, the price should be developing higher and higher lows and highs, which is confirmed by the positive slope assumed by the regression line.
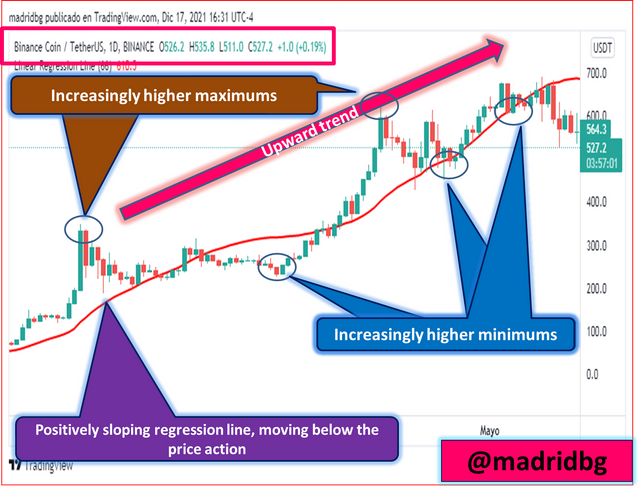
Screenshot taken by @madridbg through the tradingview portal. tradingview
Otherwise, when the regression line moves above the price action, we say that the trend is bearish, which we can confirm with the negative slope assumed by the regression lines studied.
These aspects, we can observe them in the graph below for the ETH/USDT pair in daily temporality, in the same we can detect that the price has been presenting lower and lower highs and lows which is another conformation that we can detect by using the regression line.
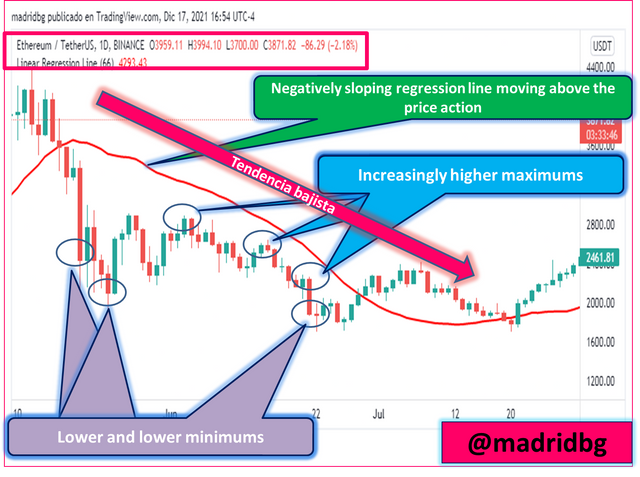
Screenshot taken by @madridbg through the tradingview portal. tradingview
On trend changes as a function of the regression line:
When we talk about a change of trend, we refer to the behavior of the price action, which can go from an uptrend to a downtrend and vice versa, if we analyze this behavior by means of the regression line we can observe that the slope generated by the indicator changes, according to the following patterns.
1. The trend changes from bearish to bullish when the regression slope changes from negative to positive.
2. The trend changes from bullish to bearish, when the regression slope changes from positive to negative.
In one scenario or the other, you should look for confirmations of these trend changes, in general lines you should expect the price candlesticks to reach the regression line and reverse its channel, at the same time you should observe the changes in the slope of the regression line, which is an indication that the previous movement has lost strength and that a reversal in the trend is approaching.
Therefore, it is necessary to determine these behaviors at the chart level and in the image below for the ETH/USDT pair in daily timeframe, we observe how the price action reaches the regression line, short it and the reversal of the same occurs, aspects that we can observe with the change of the slope from negative to positive, confirmation of trend reversal product of the weakening of the previous trend.
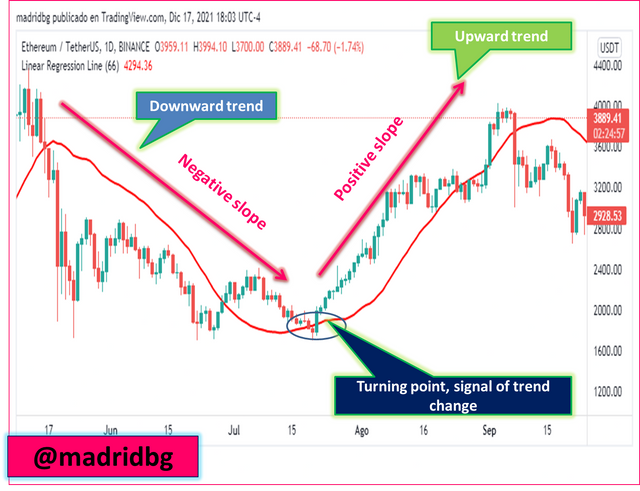
Screenshot taken by @madridbg through the tradingview portal. tradingview
In the case of the change of trend from bullish to bearish, we can see that the price also reaches the short regression line and reverses contrary to the previous trend, which is confirmed by a change in the slope of the regression line from positive to negative, indicating the weakening of the previous trend, as seen in the following chart for the BNB/USDT pair in daily time frame.
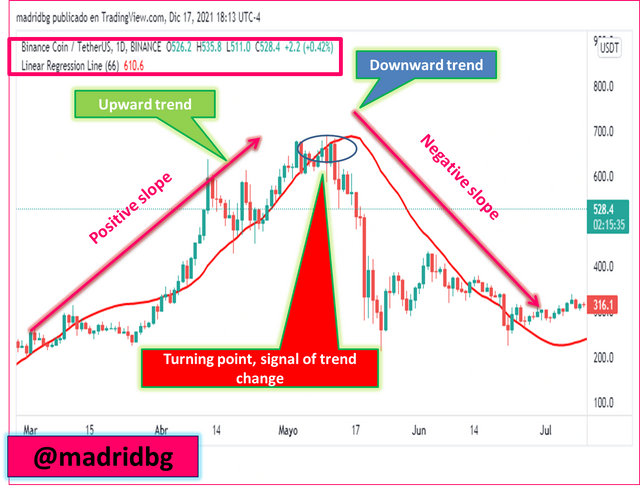
Screenshot taken by @madridbg through the tradingview portal. tradingview
4. Based on the use of the price crossover strategy with the indicator, how can you predict whether the trend will be bullish or bearish?.

As mentioned in the previous section, the change in trend is visualized by a change in the slope of the regression line, accompanied by a cut that the price action makes on it, in the event that such a cut occurs from the bottom up or vice versa, the important thing is to evaluate the closing of the candle that caused the cut and based on this, make our speculation system.
When the candle breaks from the bottom to the top, and the length of the candle is large, we can establish that the momentum generated is high and that the price will go up, hence we look for entries in purchase under this pattern.
The opposite happens, when the break occurs from up to down and the length of the candle that caused the break is high, at this point we speculate a bearish scenario, under this pattern we look for market entry on sale. In this sense, in one scenario or the other, the momentum of the breakout is an indication that the price will continue to move up or down.
Let's analyze these behaviors at the chart level:
Price breakout based on indicator: bullish entry signal:
As we have already explained, the importance of these patterns is to know the momentum or strength of the breakout, for this scenario we must evaluate an upward breakout of the price over the regression line, as well as the closing of the candle that causes such a breakout, it will be this breakout that will allow us to evaluate the momentum and bullish scenario that the price presents.
So that our speculation system must go function of knowing and identifying the generated breakout, in the following chart for the BTC/USDT pair in daily temporality we can observe different bullish confirmation signals, which we can use to enter the market and profit in our entries, so that we can detail the generated breakout and the momentum of each of them.
Regarding the use of stop loss and take profit levels we can be conservative and evaluate a 1:1 risk/reward ratio, where the stop loss is placed just below where the cut-off between the candle and the regression line occurred.
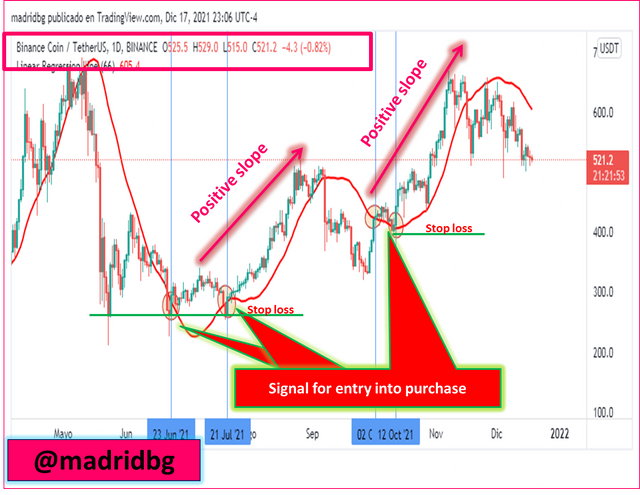
Screenshot taken by @madridbg through the tradingview portal. tradingview
Price breakout according to the indicator: bearish entry signal:
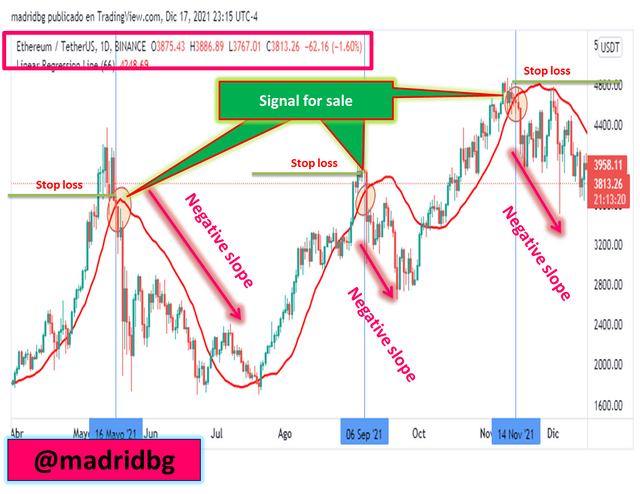
Like the previous scenario, we must evaluate a cut between the price and the regression line, a cut that will be executed from top to bottom, and depending on the size of the candle that caused the cut, will allow us to speculate our entries downwards, respecting a 1:1 risk/reward ratio.
At this point, the stop loss level, we will place it just above the crossing between the regression line and the price. In the chart below, for ETH/USDT on daily timeframe, we can observe different sell entry signals depending on the above mentioned guidelines.
Screenshot taken by @madridbg through the tradingview portal. tradingview
5. Explain how the moving average indicator helps to strengthen the signals determined by the linear regression indicator.

At this point of the thematic and according to the content socialized by the Professor, we can realize that to evaluate the behavior of the regression line indicator you have similar aspect to the moving averages, with the difference that the regression when using quadratic systems tends to present more variations for which it is more dynamic, hence the signals in some cases are more accurate and in others generate more false signals.
Based on the above, it is necessary to accompany the regression line of other confirmation indicators, in this particular let's work with the moving averages to speculate in the cryptoasset market based on entries based on confirmations of both indicators.
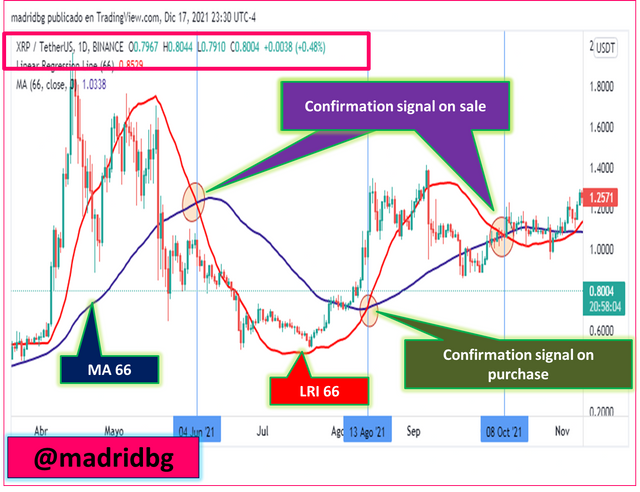
By way of orienting the reader in this regard, we will work with confirmations based between the LRI and the 66-period moving averages, where we will evaluate the crossovers that is executed between both indicators and perform our speculations based on the type of crossover that is generated.
In this sense, we have used the pair XRP/USDT in daily temporality, to evaluate the behavior of the exposed above and as can be seen, the crossing of both indicators generate us confirmations both in buying and selling, hence it can be a viable strategy that can be tested by operations in practical mode and evaluate the effectiveness of the same.
Screenshot taken by @madridbg through the tradingview portal. tradingview
According to the technical aspects that are necessary to understand based on the combination of these two indicators stand out:
1. If the LRI crosses from above to below the moving average line, the signal is bearish confirmation.
2. If the LRI line crosses from bottom to top to the moving average line, the signal is bullish confirmation.
3. The breaks generated between the price and the previously studied indicators must be respected.
Based on the above patterns and the aspects studied in the body of this paper, we can set up our strategy or speculation system using the price regression line.
6. Do you see the effectiveness of using the linear regression indicator in the style of CFD trading? Show the main differences between this indicator and the TSF indicator.

Using the linear regression indicator in the CFD market, according to the consulted literatures and the professor's approaches is beneficial and reliable, product of the follow-ups that this line performs as a function of the trend, therefore, being an excessive trend extender, it produces profitable scenarios in the CFD market.
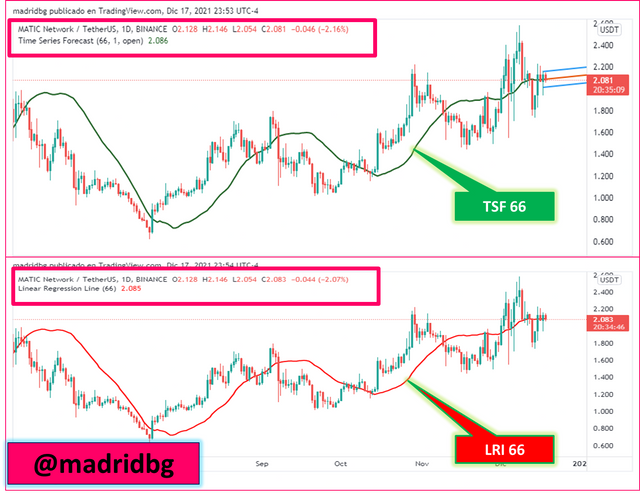
For its part, the TSF indicator (Times Series Forecast), serves as an aspect of linear regression, having as its fundamental support the short-term markets, while the LRI is a much more effective indicator at the level of medium and long-term operations.
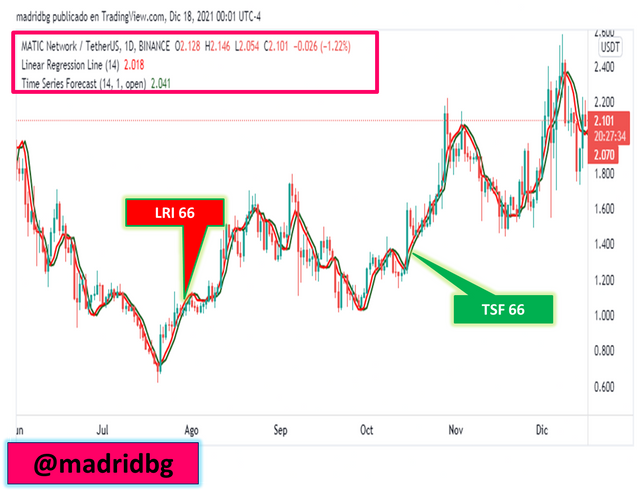
Based on the above, it is to be expected that in short timeframes the TSF responds more effectively than the LRI, likewise, the effectiveness of the LRI increases over longer periods while the effectiveness of the TSF is diminished in this type of periods.
With respect to the sensitivity of one indicator over the other as a function of temporalities, it depends on the statistical operations used in its calculations, since TSF is based on the slope of the data hence its effectiveness at low periods, while the regression line is a function of the squares of the points, increasing its effectiveness at longer periods of time.
Screenshot taken by @madridbg through the tradingview portal. tradingview
In the previous chart, MATIC/USDT pair in daily timeframe, we have configured the LRI and TSF line as a function of 66 periods, where we can observe that the behavior of one over the other are similar.
However, when we decrease the number of periods the TSF reactivity exceeds the LRI, hence one, should be used for low periods and the other for high periods see chart below MATIC/USDT pair in daily timeframe.
Screenshot taken by @madridbg through the tradingview portal. tradingview
7. List the advantages and disadvantages of the linear regression indicator.

As is well known, no system of speculation or indicators is 100% reliable, hence it is normal that the indicators present advantages and disadvantages in comparison with other indicators, and based on these we evaluate the pros and cons of the regression line.
On the advantages of the linear regression indicator:
Positive aspects include the following:
1. Thanks to the use of the quadratic system in its calculations, it is presented as an indicator with fewer delays if compared to the moving averages that we usually use, hence its reaction is faster and more efficient at the time of changes in the direction of the price of an asset.
2. The identification of both buy and sell signals are easy to identical, as well as trend following and possible reversals in these.
3. It can be combined with other indicators, looking for confirmations that make trading in the market more secure.
On the disadvantages of the linear regression indicator:
Negative aspects include:
1. When there are accelerated movements in the price action, the regression line does not adapt to these, since its configuration essentially starts from data in an equilibrium state and sudden movements in the market break this dynamic in the price.
2. Combination with other indicators is necessary, so that signals based on confirmations can be generated.
3. In fast price movements, it tends to produce false signals that can affect our profitability in the market.

FINAL CONSIDERATIONS

Once the conceptual and practical aspects of the linear regression indicator have been addressed, we can establish that it fulfills dynamic functions in monitoring the trend in the price of an asset, so that its behavior is similar to moving averages, which is why it can be a more efficient alternative to the latter.
At a practical level it represents an alternative that we can incorporate to our speculation system, so it can be combined with other indicators such as MACD, EMAs, RSI, among other speculation systems that give us the possibility to confirm the signals that the LRI gives.
So I take the opportunity to thank Professor @kouba01 and the #SteemitCryptoAcademy team for the training they provide us every week.
OF INTEREST

