Author: @madridbg, through Power Point 2010, using public domain images. Clker-Free-Vector-Images
Greetings and welcome dear readers of the prestigious #Steemitblog platform, may this publication serve as material for socialization of content associated with the world of cryptocurrencies and digital markets, topics that are being promoted by the #SteemitCryptoAcademy community.
In this sense, the publication seeks to respond to the approaches proposed by professor @kouba01 in his assignment number 1 corresponding to the third season of Steemit Crypto Academy.
So without further ado we start with the proposed activity:
ICHIMOKU-KINKO-HYO INDICATOR APPROACHES AND GENERALITIES

In this section of the subject we will respond to each of the approaches made by the professor, which we will justify with the help of the material socialized by the same, as well as external consultations that we may have made, for which we will break it down as follows:
APPROACH 1
What is the Ichimoku Kinko Hyo indicator and what are the different lines that compose it?

Before answering each of the questions in question 1, it is necessary to remember that the Ichimoku Kinko Hyo indicator was developed in 1930 by Goichi Hosoda, a Japanese journalist who spent 30 years of his life perfecting the technique or trading strategy.
So to answer the What is it? as the first question of the teacher, we must establish that the Ichimoku Kinko Hyo indicator, is a trading system that can be applied in any temporality and in any financial asset, where cryptocurrencies do not escape this reality, according to the reading made, the indicator is a versatile instrument that allows us to define the supports and resistances of the market, as well as to visualize the market trends and the momentum or strength according to the price action.
It is based on an equilibrium system, which allows us to understand the market action, according to those values considered as abnormal according to the values established in the indicator.
Hosoda, starts from the fact that the origin of the data circle will attract the abnormal values to its normal course, that is, those values that do not meet the established criteria or that allow us to take advantage of the market according to the resulting correction, although in the beginning these approaches were directed to human behavior, the data are easily extrapolated to the financial markets.
What are the different lines that compose it?
The structure of the Ichimoku Kinko Hyo indicator consists of five components or fundamental lines that provide important information about the price action. In this sense, it is necessary to analyze as a whole the indicator and not the components separately as we could generate false positives.
Its components include:
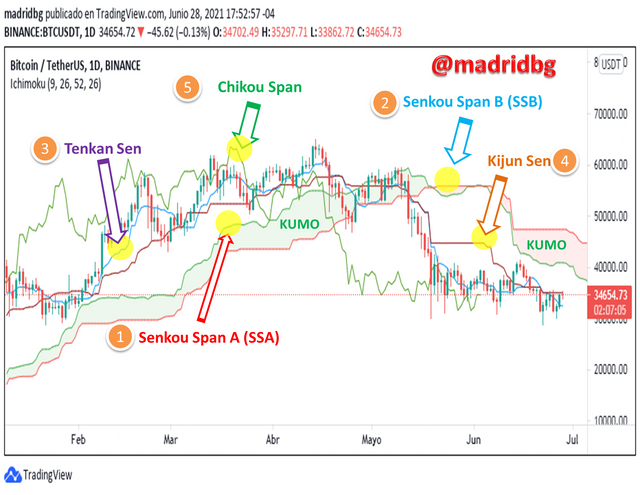
1. Senkou Span A (SSA), also known as the first line of leadership, is calculated by merging the sum of the Tenkan-Sen lines and the Kijun-Sen and dividing by 2, making a projection to 26 periods.
Note: the general equation is as follows: (Tenkan-Sen + Kijun-Sen)/2 with 26 periods of projection.
2. Senkou Span B (SSB), second leading line, is calculated by summing the lowest minimum and highest maximum, dividing by 2 over a range of the last 52 periods and making a forward projection of 26 periods.
Note: the general equation is as follows: (Highest maximum + lowest minimum)/2, period of 52 with projection of 26.
Important note: It is necessary to emphasize that both lines are used in the speculation process for the future, so that we can make projections of the price action.
3. Tenkan Sen, is considered as a fast line and resembles the exponential moving average without being a moving average, for its calculation process the following equation is followed [(highest high + lowest lows)/2 used the last 9 periods].
4. Kijun Sen, it is considered as a slow line, for its calculation process the following equation is followed [(highest maximum + lowest minimums)/2 but in this case the last 26 periods are used].
5. Chikou Span, this line is conceived as a lagging line and the current closing price in the market is calculated by taking 26 periods backwards in the price action.
In the following chart we can observe each of the lines that compose the Ichimoku Kinko Hyo indicator, using as reference the BTC/USDT pair in daily timeframe.
APPROACH 2
How to add the Ichimoku indicator to the chart, what are its default settings, and should it be changed or not?

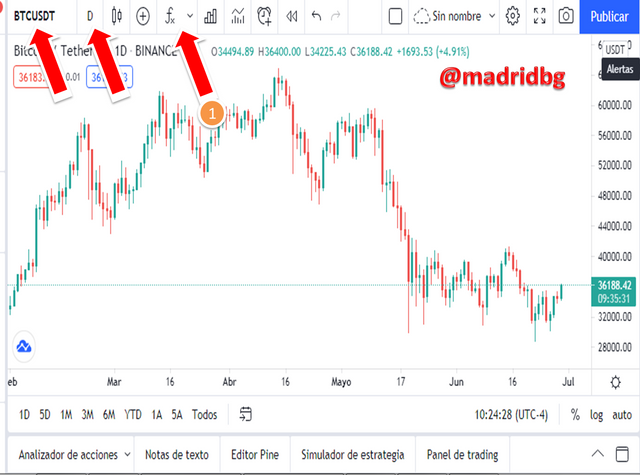
As with the indicators studied in the previous season, we will use the tradingview platform to explain in detail the process of inserting the Ichimoku Kinko Hyo indicator, taking as a reference the BTC/USDT chart in daily timeframe. For this we will follow the following sequence:
Step 1: open the corresponding chart in the tradingview platform and click on the FX option.
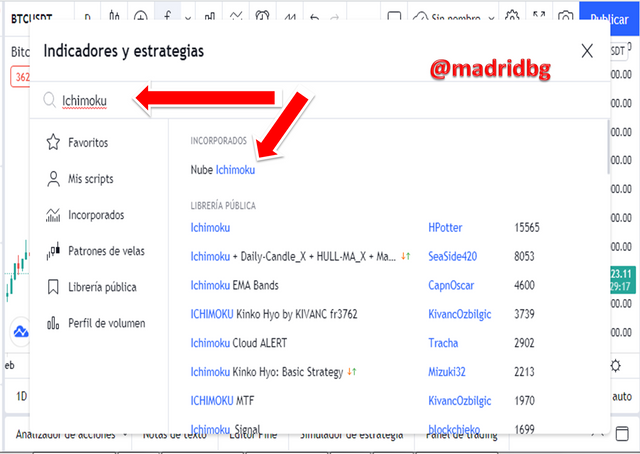
Step 2: Inside the FX option type Ichimoku and select the option that appears to us as Ichimoku cloud.
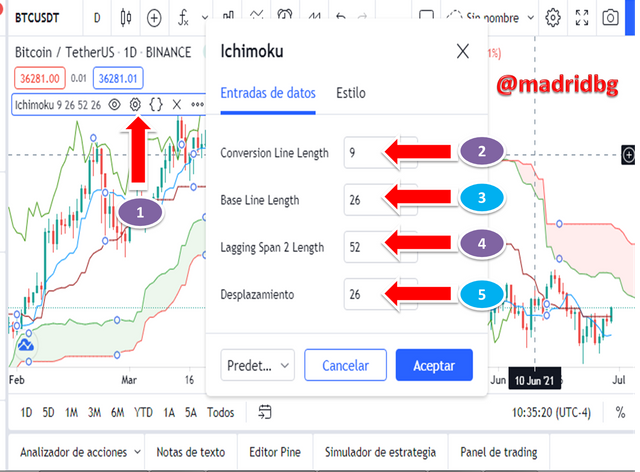
Step 3: Once the indicator has been inserted, we can go to the configuration section (pattern N° 1), where the configuration of values will be displayed, as well as the aesthetics that we want the graph to present.
What are your default settings and should they be changed or not?
As we can see in the chart above, the default settings are (9, 26, 52, 26) for each of the lines proposed by Goichi Hosoda, as in all indicators and trading styles the default settings can be changed and adapted to our style of approaching the market.
However, in the case of this particular indicator it is not advisable to change it, because it generates more noise within the signals, which implies a greater number of false signals and the true signals we will observe them at the wrong time.
Note: Remember that the default settings are obtained after long process of trial and error therefore it is expected that these are the ones that best suit the market, so it is up to each trader to modify or not the default values.
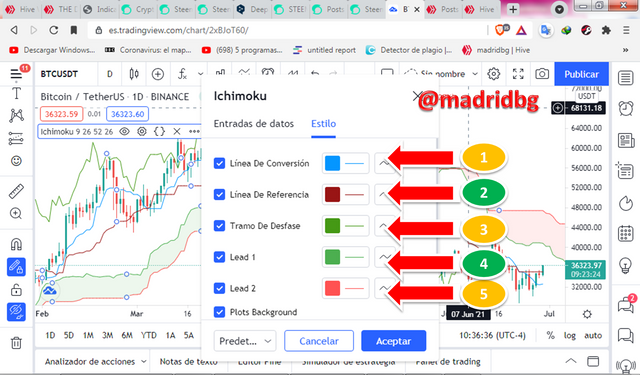
Regarding the aesthetics and colors of the lines, we can modify them according to our needs and comfort when entering the market, the ideal is to feel comfortable and enter with the best tools if we want to be profitable in the world of trading.
APPROACH 3
How to use the Tenkan Sen line? How to use the Kijun Sen line? And how to use them simultaneously?

In order to answer the following questions posed by the professor, we will try to carry out a separate analysis, which will be reflected below:
How to use the Tenkan Sen line?
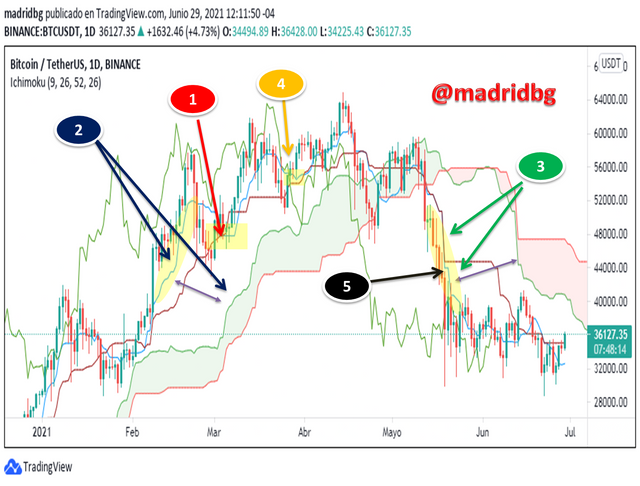
As mentioned above, the Tenkan Sen line is the fastest and most reactive of the Ichimoku indicator, so its main purpose is to provide timely information on short-term market volatility, since it takes the last 9 periods as a reference. In this sense, if Tenkan Sen rises it is to be expected that the highs and lows within the market will also rise and vice versa.
On the other hand, if the market enters a period of indecision, it can be observed that the Tenkan line adopts a flat shape (Pattern 1), which indicates that there is no clear trend in the last 9 period, similarly, this line allows us to determine the uptrend when the line is above the KUMO of indicator (Pattern 2) or bearish when it is below the KUMO of the same (Pattern 3).
Furthermore, because the line is based on balance it allows us to use it as supports (Pattern 4) and clear resistances (Pattern 5) when performing our trading analysis.
How to use the Kijun Sen line?
Unlike the Tenkan Sen line, the Kijun Sen is based on 26 periods so it is considered as the slow line of the Ichimoku system, the same indicates the volatility of the market in the long term, so it is expected that:
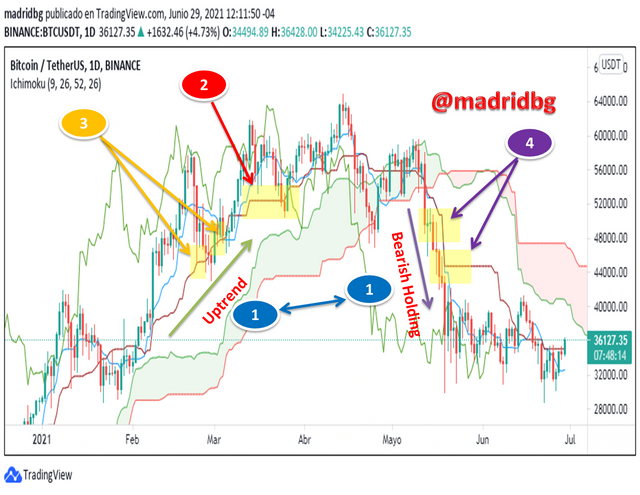
1. A rising Kijun Sen line tells us that the highs and lows of the market also makes it in a range of 26 periods case we can also observe in the opposite direction.
2. When the market stops rising or falling, we observe the formation of a flat pattern that indicates the need to look for a break-even point in the price action. (Pattern 2).
Note: it is necessary to highlight that according to the number of periods handled, the Kijun Sen can be more reliable than its companion Tenkan Sen in all aspects that we have already addressed, trend identification (Pattern 1), identification of supports (Pattern 3) and resistances (Pattern 4), as well as areas of indecision in the market, as we can see in the following chart.
How to use the Tenkan Sen and Kijun Sen line simultaneously?
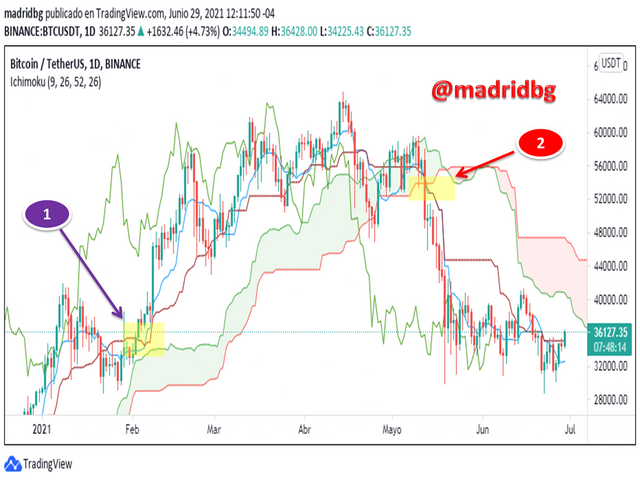
In the questions addressed above we were able to know the advantages and disadvantages offered by the fast line and the slow line separately, now we can use both in our trading system, since an approach of these allows us to speculate on a possible change of trends or major correction in the market.
In this sense, if the fast Tenkan Sen line crosses from up to down it is necessary to speculate that the price action will make a downward correction or a possible entry to sell (pattern 1), opposite case is presented when the crossing occurs from down to up, we speculate a bullish movement and a possible entry to buy (pattern 2).
Important note: We must remember that the Ichimoku indicator must be approached as a whole and not evaluate the behavior of the lines separately and in the case of doing so we must take into account whether the price is above or below the KUMO cloud which allows us to have a broader view of the market.
APPROACH 4
What is the chikou span line, and how to use it, and why is it often neglected?

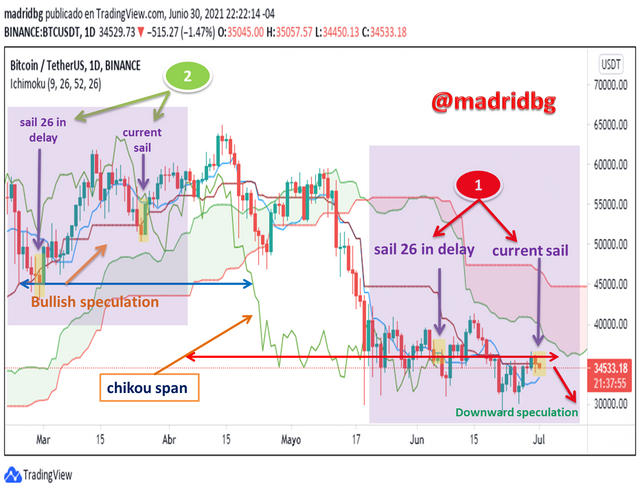
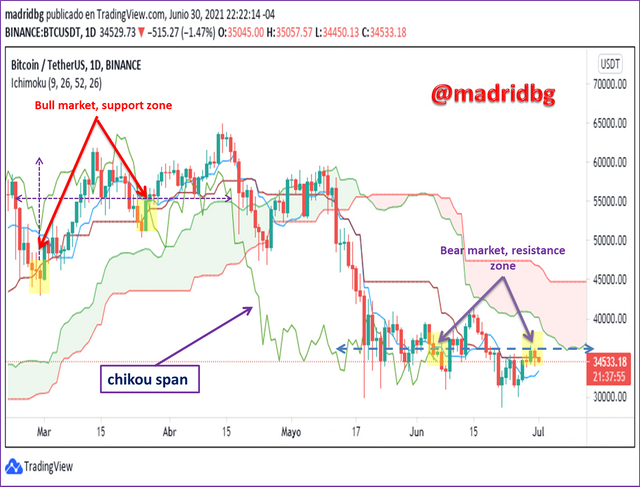
As we mentioned in the section related to the components of the Ichimoku indicator, the chikou span line is a lagging indicator that can be used to make buy or sell decisions, since it allows us to speculate on the direction of the price of a given asset.
In this sense, and to answer how to use them, we must take into account that they have varied uses, among which stand out:
1. If the chikou span line of the delayed 26 candle is below the price of the current candle, it is an indicator of the selling pressure in the market, as a consequence it is to speculate a bearish scenario (Pattern 1), the opposite case occurs when the line of the delayed 26 candle is above the price of the current candle, at this point there is greater buying pressure generating a bullish run in the market, (Pattern 2).
Note: It is necessary to remember that this type of analysis is not an absolute truth on the contrary they are speculations that as market analysts we make on the price action.
2. Due to its dependence on the price, it allows to form well-defined peaks and valleys, which can be used to mark support and resistance zones that will allow us to make the choice under more reliable criteria when entering the market.
Why is it often neglected?
We must remember that the Ichimoku indicator, is based on 5 fundamental components, which urge us to follow them in an integrated manner and not separately. So that this statement has become a point of neglect when analyzing the chikou span line, other aspects is attributed to the fact of little understanding about the 26-period trace line, where in many cases does not allow us to accurately establish the behavior of price speculation in an economic asset.
Similarly, sometimes we forget to analyze the close of the current candle, based on the 26-period candle in delay and we do not take into account if it is above or below it, a phenomenon that occurs when we focus our analysis on the kumo cloud and not on the rest of the lines. Based on the above, all the carelessness criteria are due to the little visual edge given to the indicator.
APPROACH 5
What is the best time period to use Ichimoku and what is the best indicator to use with it?

According to the approaches discussed so far, we can establish that the Ichimoku indicator can be applicable to any timeframe and any economic asset, so that everything comes down to the criterion of the trader or trader who makes the speculative analysis. In particular, I feel comfortable making projections in intraday analysis, where the indicator under study, for its breadth and completeness that has resulted, suits the requirements, need and my style of approaching the market.
Recall that we have fast lines Tenkan Sen, for short-term markets and the slow line Kijun Sen for market with greater projection of time, which are complemented by the rest of the components that provides us with the Ichimoku indicator, hence it is suitable for any market temporality.
What is the best indicator to use with it?
Due to its breadth, it can be used alone as a trading strategy, however, thinking about efficiency and profitability in the market and as a complement to the lessons learned in the previous season I consider it can be used in conjunction with the relative strength indicator RSI.
Both indicators as a whole will allow us to perform more complete analysis on the price action on a specific asset. At this point let's look at the chart below and analyze how Ichimoku and RSI work as a trading strategy.
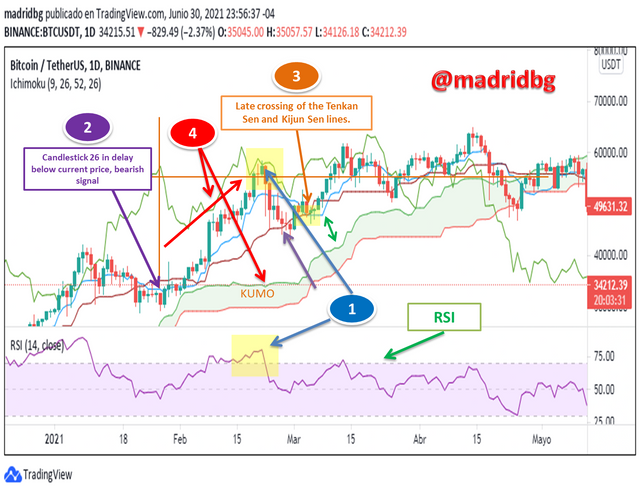
As we can see in the chart of the BTC/USDT pair in daily temporality, for February 21, 2021, the RSI marks us an overbuy of the BTC asset, so it is to be expected that a downward correction occurs (Pattern 1), so the analysis allows us to speculate a signal that we assume as sell and take profits, which corresponds to the Ichimoku indicator through the chikou span line, who works as a strong resistance that corresponds to the information of the RSI.
Likewise, by means of pattern 2, we can observe that the 26-period delay line of the chikou span, is below the current candle which confirms a fall of the price in the market.
However, when analyzing the behaviors of the Tenkan Sen and Kijun Sen lines, we realize that the crossover is generated late, that is where the use of the RSI as a means of confirmation is justified.
Note: we must take into account that the analysis we have done following an uptrend as can be seen in the pattern 4, likewise we can see that all components of the graph have developed above the cloud or KUMO of Ichimoku which strengthens the trend in which we are working.
CONCLUSION

As we could analyze throughout this writing, the Ichimoku indicator is characterized by its reliability in trending market, where it is necessary to emphasize its use in a holistic way and not to see the lines separately because we could fall into false positives.
Due to its multiple components, it allows us to have a clearer vision than many of the known indicators, which by making a good combination will allow us to generate a reliable trading strategy, reliable and applicable to different assets and financial markets.
At this point, it is an indicator that adapts to any trading need and its durability over time allows us to take it into account as an alternative that produces profitability in the market.

Grateful for the teaching imparted:
Cc: @kouba01

OF INTEREST


Dear @madridbg
Thank you for participating in Steemit Crypto Academy Season 03 and making efforts to complete the homework task. You got 9.5/10 Grade Points according to the following Scale;
Key Notes:
We appreciate your efforts in Crypto academy and look forward for your next homework tasks.
Regards
@cryptokraze
Downvoting a post can decrease pending rewards and make it less visible. Common reasons:
Submit
Greetings Professor @cryptokraze, grateful for the assessment and observations made, the idea is to continue improving throughout the process. Success in your task
Downvoting a post can decrease pending rewards and make it less visible. Common reasons:
Submit