
Authored by @madridbg, via Power Point 2010, using public domain images. Gerd Altmann
Greetings and welcome dear readers to another installment associated with technical analysis and the indicators we can use to establish profitable trades when entering the market. In this regard, this post is intended to respond to each of the approaches requested by Professor @fredquantum in the assignment for week 2 of season 5 of #SteemitCryptoAcademy.

CONCEPTUAL AND PRACTICAL APPROACH TO CRYPTOCURRENCY TRADING USING THE AROON INDICATOR

As is well known in my style of writing, this section is dedicated to give timely answers to the questions suggested by the teacher that allow a full understanding of what concerns the AROON indicator.
1. What is the Aroon indicator in your own words? What are Aroon-Up and Aroon Down?.

As mentioned in previous publications, trading in its different aspects, is a speculative system that allows us to acquire profit and in many cases losses, if we do not have the necessary experience to understand the behavior of the price.
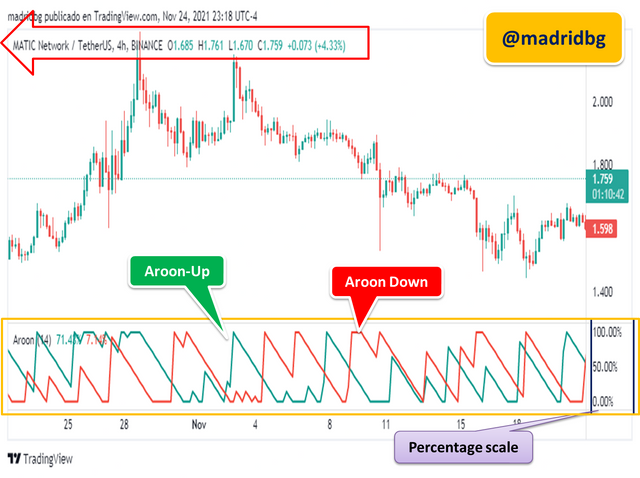
In this sense, and answering the question "what is it? we can establish that Aroon in a technical indicator of oscillator type, its appearance is attributed to Tushar Chande in 1995 and focuses on being able to identify the trend and the strength of the market according to the price action, in addition to this, some texts state that by correlating the variables time and price of the asset, the indicator has the ability to detect emerging trends, periods of consolidation of the asset, as well as anticipate possible reversals in the price, hence it is considered an early warning indicator for the behavior of the price.
Graphically the indicator is composed of two fundamental lines, the Aroon-Up / Aroon-Down and each one fulfills specific functions within the indicator, the same ones move within a percentage scale that goes from 0 to 100 and that allows us to understand the performance of the asset.
In this sense and referring to the first line (Aroon-Up), we can establish that it is based on measuring the number of days elapsed since a maximum was recorded during the last periods evaluated, understood as 7, 14 or 25 (Respond to temporality) which are adjusted to the needs and style of trader, in such a way, it is valid to establish that this line allows us to measure the price movements in the uptrend, as well as its strength, focusing its attention at the level of the percentage scale.
For its part, the Aroon-Down line, has the same purpose as the previous one, but intended to evaluate the minimum recorded in the price for the period of time established for the analysis, so, that its main objective is aimed at measuring the strength of the downtrend, in this sense, that the interaction between the Aroon-Up and Aroon Down lines, we will be addressing them in the following sections.
Screenshot taken by @madridbg through the tradingview portal. tradingview
2. How is Aroon-Up / Aroon-Down calculated? (Give an illustrative example).

Like any statistical indicator, it requires data processing and mathematical operations to determine the objectives it pursues. In this sense, in order to respond to this approach, we will rely on a sequence of images that will allow us to understand the calculation process behind each line that makes up the AROON indicator.
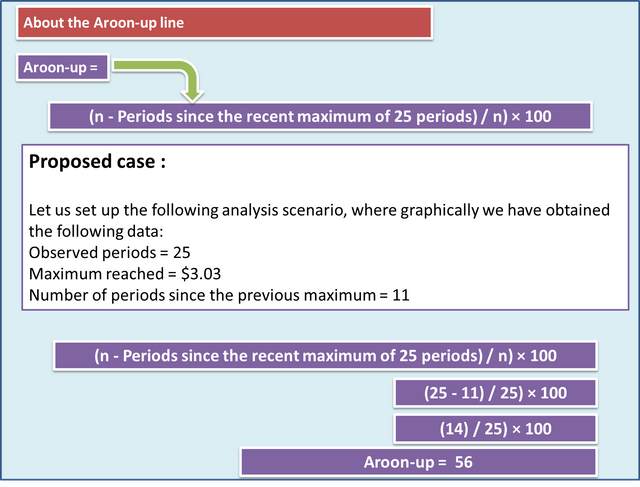
As we can see in the following image, a scenario has been established based on data that allows us to determine the performance of the AROON indicator, where we can observe for the Aroon-Up line a value close to 56, which allows us to infer an upward movement in the price, product of a continuation of the previous trend or in many cases the birth of a new trend. What is not certain under this scenario, is that it is foreseen that according to the values that are thrown that the dominant pressure will be the bullish one.
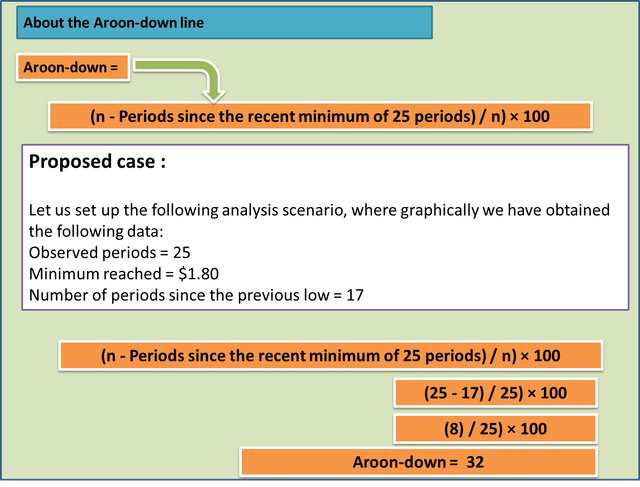
In the case of the Aroon-Down line, the proposed scenario gives us results of 32, this is telling us that the trend is weak, so we must operate with caution and generally speaking the downtrend has no strength, so the dominance should be observed in the bullish scenario.
3. Show the steps involved in the Aroon Configuration indicator on the graph and show different configurations.

As has been constant in my publications, associated with technical analysis, the behavior of the asset and their respective analysis are executed through the tradingview platform, as it allows us to add a variety of financial instruments with a user-friendly interface. In this sense, let's go to the sequence of steps to include the AROON indicator in the chart.
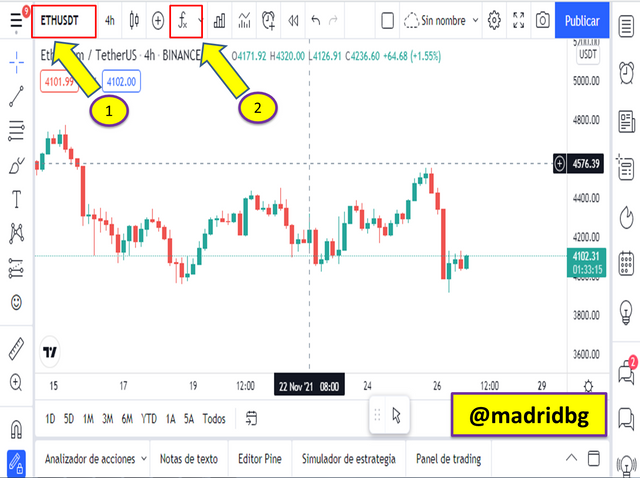
Step 1: go to the tradingview website (https://es.tradingview.com/) and look for the charting section, then select the asset pair you want to analyze.
Step 2: We go to the FX function and in the search tab type AROON, selecting the option provided by the platform.
Screenshot taken by @madridbg through the tradingview portal. tradingview
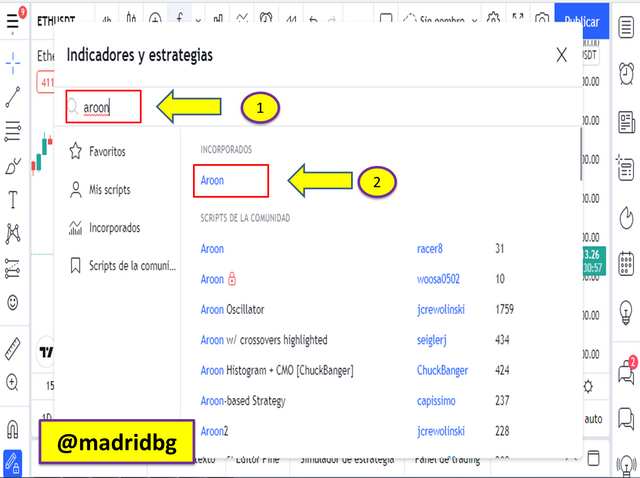
Screenshot taken by @madridbg through the tradingview portal. tradingview
Step 3: once the indicator is added to the chart, we can configure the data input, as well as the style of the indicator, for this particular one we will change, the data input from 14 that comes by default up to 25 periods since it is a value that allows us that the indicator can follow the price with a certain degree of balance, because if the periods are very low, many false signals are generated and if they are very high in indicator usually throws many late signals.
At this point, let's follow up on the configuration of the indicator, for this, we must go to the configuration section as shown in the image, in the first instance we will go to the data entry, by default it is in 14 periods, which we will change to 25 periods for reasons of the development of the explanation, once configured, the data entry we have chosen is accepted.
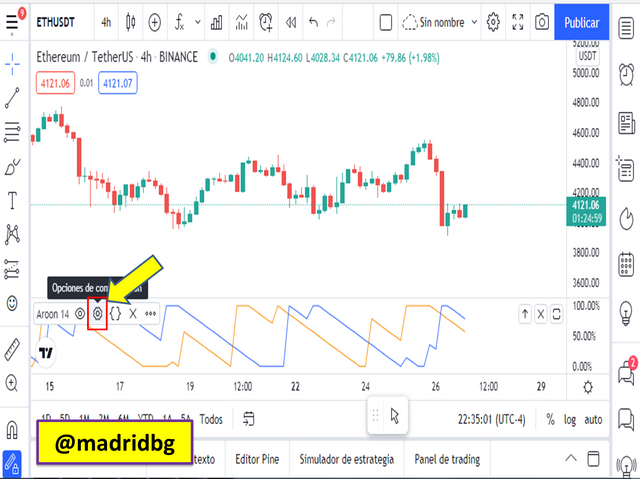
Screenshot taken by @madridbg through the tradingview portal. tradingview
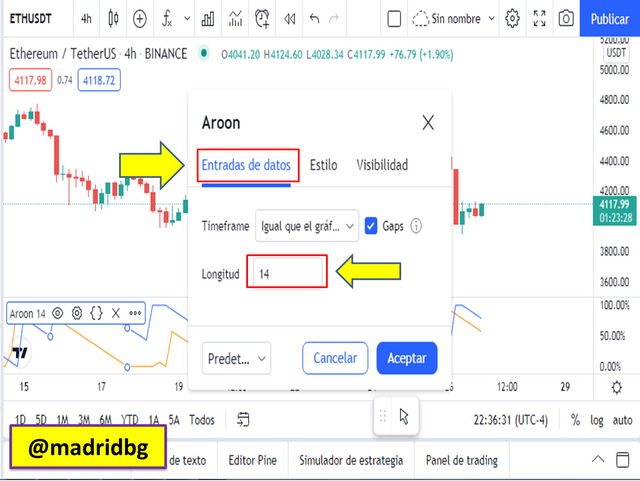
Screenshot taken by @madridbg through the tradingview portal. tradingview
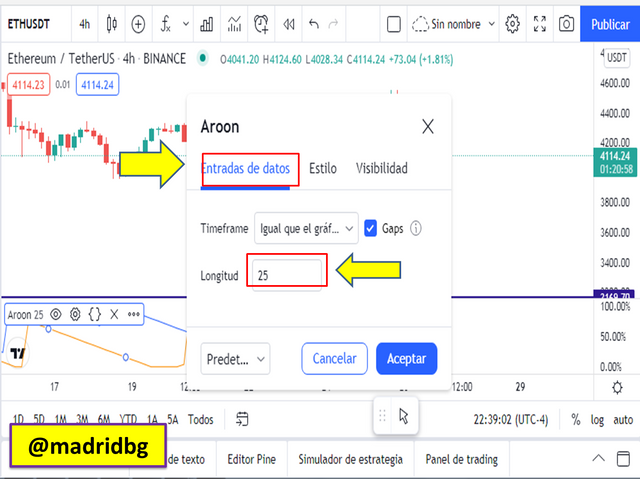
Screenshot taken by @madridbg through the tradingview portal. tradingview
For the aesthetic configurations we will go to the style tab, at this point we can change the color of the lines of the graph, where we can modify the opacity of these and the color associated with them, in addition to the presentation style either as line, histograms, area, among others.
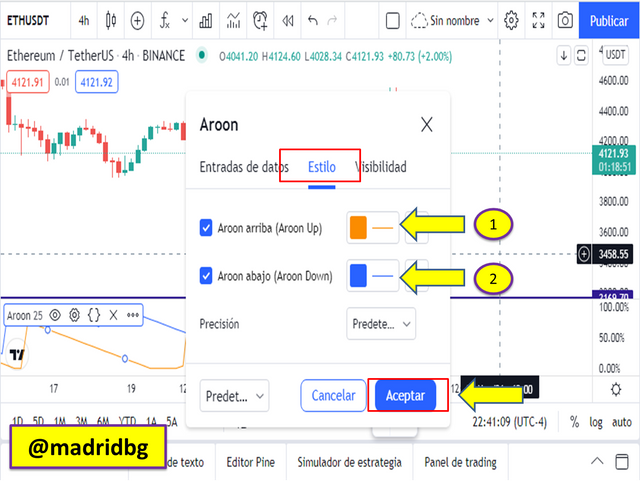
Screenshot taken by @madridbg through the tradingview portal. tradingview
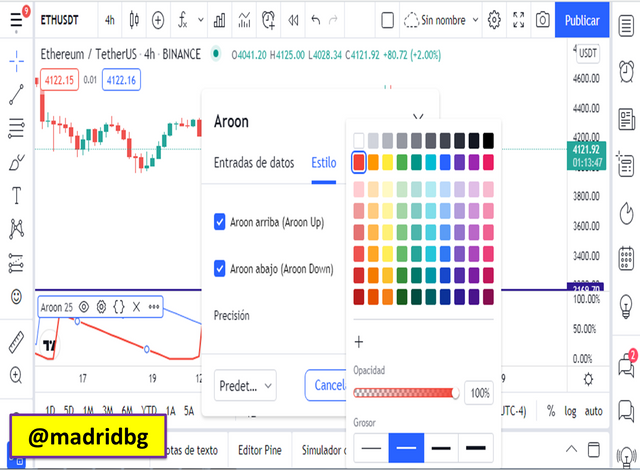
Screenshot taken by @madridbg through the tradingview portal. tradingview
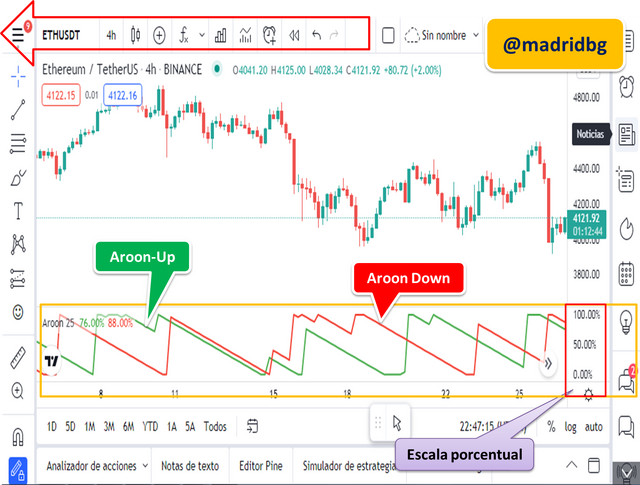
Screenshot taken by @madridbg through the tradingview portal. tradingview
4. What is your understanding of the Aroon oscillator and how does it work?.

Earlier in the body of this paper, we have addressed what concerns the Aroon-up and Aroon-Down lines that make up the Aroon indicator, such that the difference of these two lines results in the formation of the Aroon oscillator.
Which graphically fluctuates in values ranging from -100 to +100, with zero (0) being the intermediate value of both. In this sense, negative values are associated with bear markets and positive values with bull markets, so that this oscillator is used to detect the current trend, possible changes in it, as well as the momentum levels of the trend.
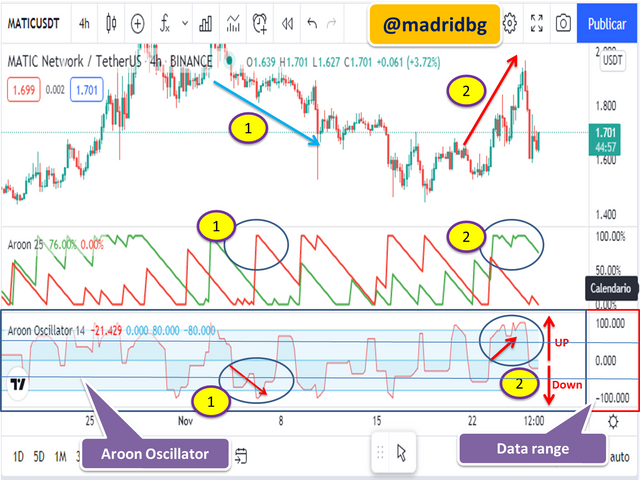
Screenshot taken by @madridbg through the tradingview portal. tradingview
If we analyze the above chart, we realize that when the values of the Aroon oscillator move from 0 to +100, the market moves upwards (pattern 2), at this point the buying pressure is higher, so the price tends to rise, otherwise, when the values move from 0 to -100, the selling pressure is predominant (pattern 1), so the price tends to fall.
In general lines we can establish according to the Aroon oscillator, that when the oscillator line moves above zero, it is to be expected that the Arron up line was greater than the Aroon down line (pattern 1), which does not lead us to think that the price is reaching new highs.
On the other hand, when the indicator moves below zero, one would expect the Aroon Down line to be greater than the Aroon up line, this is an indication that the price is reaching new lows (pattern 2).
Based on the above, we can establish danger lines (-50 and +50) that allow us to determine the strength and momentum of the market, where values above the +50 threshold, is an indication that the price has bullish strength, meanwhile, when the line moves below -50 are indicative that the market has strength to continue falling.
5. Consider an Aroon indicator with a single oscillating line, what does the trend measurement mean at +50 and -50?

If you wish, in the previous section we have given an answer to this approach, so it would only suffice to recall some basic aspects, among which stand out.
* The oscillating line of the Aroon oscillator, is the result of the difference between the Aroon up line and the Aroon down line.
* When the oscillating line moves above +50 it is an indication that the price of the asset in question, has bullish strength, whereby the buying pressure is greater than the selling pressure. In other words, in this scenario the Aroon up values are greater than Aroon down.
* When the oscillating line transits below -50, it is an indication that the selling pressure is greater than the buying pressure, so it is assumed that the price has strength or momentum to continue falling. In this scenario, one would expect the aroon down line to be greater than the Aroon up line.
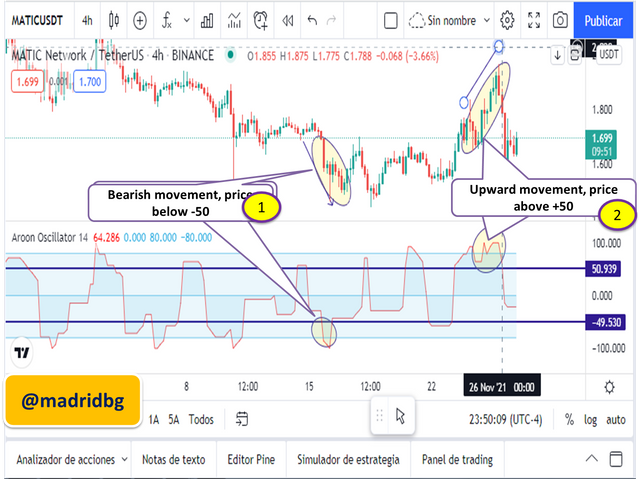
Screenshot taken by @madridbg through the tradingview portal. tradingview
Based on the above postulates, we can observe the behavior of the price of the MATIC/USDT asset in 4-hour time frame, where we can corroborate in pattern 1 that the oscillator was below -50 and consequently the price ended up falling, for its part, in pattern 2, we can see that the oscillating line was above the threshold +50 and in correspondence the price ends up rising.
6. Explain the movement of the Aroon indicator in ranging markets.

As we have mentioned throughout this writing, the Aroon indicator can be used to profit from trending markets, as it can measure the strength of the trend based on the behavior of the Aroon up and Aroon down lines.
Based on the above, this versatile financial instrument allows us to know when the market associated with an asset has entered a range or lateralization process, understood as those periods of indecision in the market, in other words, there is an absence of interest in the asset under study.
With this scenario in mind, on the chart the Aroon up and Aroon down lines of the indicator move in parallel and there is no crossover between them, which indicates that there is a period of indecision in the market and that it is in range or sideways.
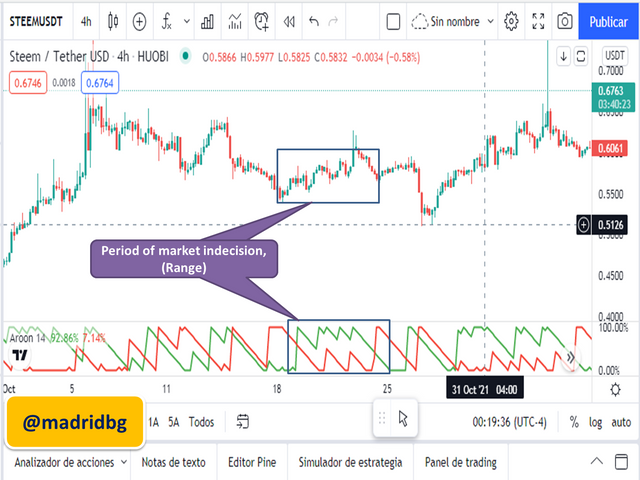
Screenshot taken by @madridbg through the tradingview portal. tradingview
In the previous chart for the STEEM/USDT pair in 4-hour time frame, we can see how the Aroon up and Aroon down lines converge in parallel with each other, which shows that the price of the asset is sideways, a scenario that is supported by the behavior of the price.
7. Does the Aroon indicator give false and late signals? Explain. Show false and late signals of the Aroon indicator on the chart. Combine an indicator (other than RSI) with the Aroon indicator to filter out late and false signals.

This approach is one of the burning issues of the subject and that every trader whether novice or advanced must understand and manage, since no indicator in the world of trading is 100% effective, so in many cases may present problems when following the price, product of market volatility or in many cases of sudden movements in it.
In this sense, the Aroon indicator does not escape this reality, so that we can not find with late signals and in many cases with false signals, attributable to the aspects mentioned above but also to the temporality and number of periods used for analysis.
We remember that when the analysis periods chosen are very low, the indicator becomes more sensitive and therefore noise is produced in the signals it generates, causing false signals that we must learn to filter, for its part, when the analysis period is very high, the signals emitted by the indicator present a slight smoothing, which brings as a consequence late signals at the chart level, hence it is advisable to use periods close in neutrality, where the analysis in 14 periods stand out.
In this sense, to fully respond to the approach suggested by the teacher, I have combined the Aroon indicator with indicators that I usually use in my trading strategy, referring to two EMAs of 10 and 55 periods respectively that allow to establish dynamic supports and resistances and a modified MACD capable of establishing the direction of the asset, with respect to the strength of the momentum we will evaluate it by using the Aroon.
On late signals:
Once we have explained the details behind the strategy we have established, we can implement it and evaluate the behavior of the Aroon indicator, seeking through practice to establish a strategy with high profitability levels.
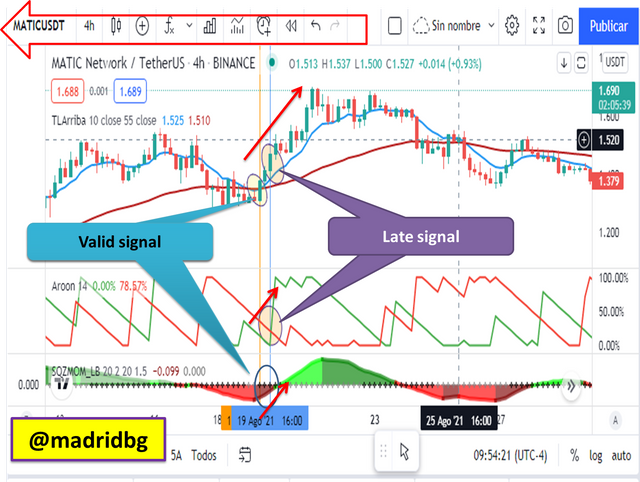
Screenshot taken by @madridbg through the tradingview portal. tradingview
In the previous graph we can visualize that there is a crossing from bottom to top of the Aroon up line over the Aroon down line, now if we analyze this crossing with the other indicators we realize that the pattern established by the MACD with bullish direction and the crossing of the EMAs the fast one over the slow one, occurred in advance, which allows us to think about how tight has been the confirmation signal of the Aroon indicator.
About false signals:
At this point of the thematic, we will observe some failures that can throw us the Aroon indicator and as seen in the chart below, the Aroon down line crosses the Aroon up line from bottom to top, so Aroon down will be greater than the Aroon up line, under this scenario we would expect a bearish price movement, however, the price continues to rise.
To confirm this false signal, we will rely on the 55 and 10-period EMAs where the respective crossover occurs after the signal thrown by the Aroon. In this sense, we must learn to filter the signals and work according to an investment strategy and not only to the use of an indicator.
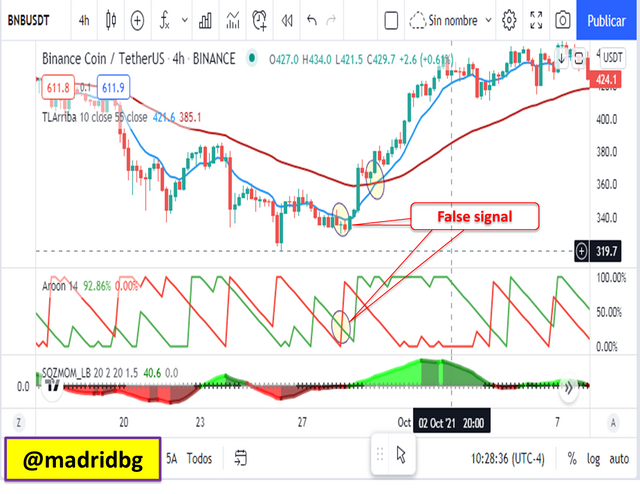
Screenshot taken by @madridbg through the tradingview portal. tradingview
8. Perform at least one buy and sell trade using the Aroon indicator with the help of the combined indicator in approach 7. Use a demo account with appropriate trade management.

In this approach we will make a practical approach to what we have learned about the Aroon indicator, so that we will place buy and sell orders that will allow us to understand how the indicator works in real time.
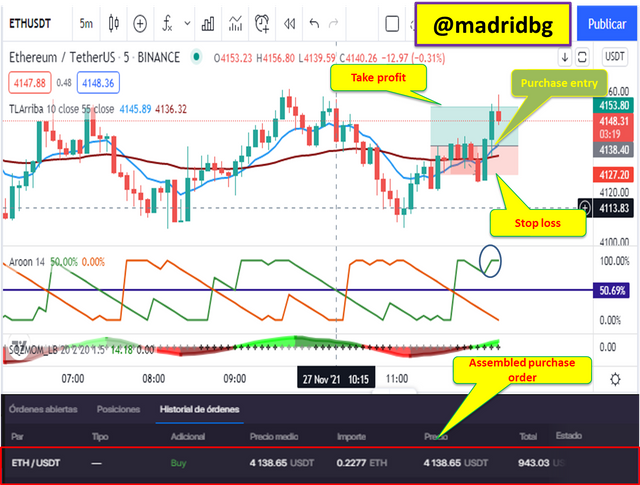
Trade 1: purchase of the asset ETH/USDT in 5-minute time frame:
In this section we have entered into purchase according to the postulates and technical analysis made by the Aroon indicator, for this we have relied on the tradingview platform to perform the analysis and the purchase operation we have made using the bitsgap platform (https://app.bitsgap.com/trading), as it does not allow practice transactions through demo accounts.
Screenshot taken by @madridbg through the tradingview portal. tradingview
If we analyze the previous chart, we realize that the Aroon up is above the Aroon down, so much that its prevalence is above the 100 percentage range, which is indicative of the bullish strength that has the ETH asset for that period of time, therefore and supported by the bullish crossing of the EMAs of 10 and 55 periods we have entered into purchase for this asset, taking into account a risk-reward ratio of 1:1. It is necessary to emphasize that the stop loss, take profit and entry price levels for the operation can be seen in the image of the chart.
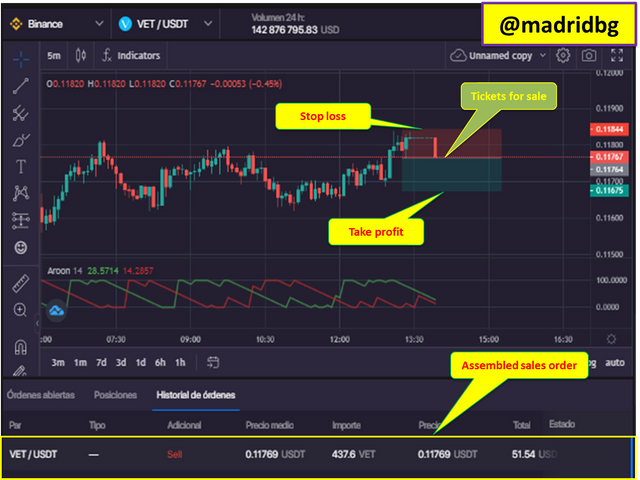
Transaction 2: sale of the asset VET/USDT in 5-minute time frame:
In this opportunity our operation is in sale and if we analyze the following graph, we realize that the Aroon up line is above the Aroon down line, however, the buying pressure has lost strength, aspect that we can observe with the negative slope that brings the Aroon up line, which for the operation carried out was in descending form below the percentage level of 40.
Based on the above, we have decided to enter into sale, setting stop loss and take profit levels that respect the 1:1 risk-reward ratio, the mathematical aspects of the operation can be seen in the chart.
9. Indicate the merits and demerits of the Aroon indicator.

Having dealt with the Aroon indicator, we can analyze that, like any indicator, it has advantages and disadvantages, which we will summarize in this section:
About the advantages:
* Its statistical calculation style, allows us to establish and identify the birth and continuation of the trend, although it also allows us to address range or lateralization scenario in the market and consequently to know the momentum of the same.
* By crossing the lines that compose it, we can generate buy and sell positions that allow us to capitalize on the market.
* It can be combined with other indicators to have a broader view of the market and consequently generate a better trading strategy.
On the disadvantages:
* It is necessary to rely on other indicators and look for confirmations, since being a lagging indicator produces negative effects on it, among which outdated or untimely signals that can generate economic losses.
* Another of the consequences of this indicator is that it produces many false signals since it is a lagging oscillator that emits signals that do not correspond to the price movements.

FINAL CONSIDERATIONS

Undoubtedly once approached in a conceptual and practical way concerning the Aroon indicator, we can realize that it is a very useful indicator to detect trend, momentum and possible reversals in these, so that in combination with other instruments that allows us to obtain confirmations we can get to establish a profitable trading strategy in the trader's world.
In this sense, I understand my thanks to the community #SteemitCryptoAcademy for the hard work they do every week likewise thank the teacher @fredquantum for the extraordinary teaching he has shared with us.
OF INTEREST

