
Authored by @madridbg, via Power Point 2010, using public domain images. ds_30
Greetings and welcome dear readers of this prestigious platform, the topic that concerns us in this opportunity, refers to the use of the equilibrium volume indicator and seeks to respond to each of the approaches requested by Professor @fredquantum in this week 4 of the fifth season driven from the spaces of #SteemitCryptoAcademy.
Without further ado, let's get to the body of this work.

CONCEPTUAL AND PRACTICAL APPROACH TO THE EQUILIBRIUM VOLUME INDICATOR

The world of cryptocurrencies and trading in general, is based on statistical variables whose understanding can generate profitability when trading in the market, there are three of these variables that every trader either novice or experienced should know, among these statistical variables include.
* The temporality, allows to know the behavior of the asset in function of time and from the management of the time we can assume the entries to the market, which will be short, medium or long term.
* The direction of the market, this variable is associated with the trend and as we all know the direction is based upwards for bull markets or downwards for bear markets.
* Market strength, knowing this variable is fundamental, as it allows us to understand or try to predict the possible movement of the asset, depending on the buy and sell orders that are being executed.
* The volume, this is an arduous point of the subject that for many investors represents the degree of interest that one has on an asset.
In this sense, we will focus our attention on this last variable, without neglecting the previous ones, therefore, a good trading strategy should be based on the use of indicators that allow us to know with veracity each of the statistical variables mentioned above. Based on the above, let us respond to the postulates requested by the teacher.
1. In your own words, explain your understanding of the OBV (On-Balance Volume) indicator.

As previously mentioned, knowing the interest held in the asset is essential to understand the behavior in the price of such assets, in this sense, the indicated volume in balance (OBV), is presented as a financial tool that allows us to understand the periods of time where there is greater commercial interest in the asset.
Commercial interest that we can identify as incoming and outgoing buy or sell orders and depending on these, will be the direction and strength of the asset in question, for example, if the number of buy orders is large and exceeds the sell orders, the price of the asset would be expected to rise, on the other hand, when the sell orders exceeds the buy orders, the price will undoubtedly fall.
In other words, the volume in balance indicator, is a technical analysis indicator that is based on market momentum as a function of buy orders entering and exiting the market, hence it is used to predict the direction and strength of the asset in question and allows traders or investors to make time-sensitive speculative decisions in search of profitability.
In this sense, the OBV indicator at the chart level is presented as a line that allows us to know the degree of trading interest on the asset, its creation is attributed to Joseph Granville in 1963 who at first, based his strategy on being able to track changes in volume and thus predict the possible price movements of an asset.
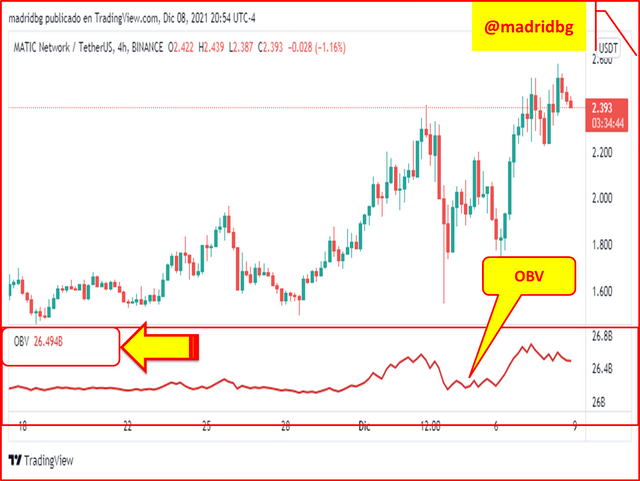
Screenshot taken by @madridbg through the tradingview portal. tradingview
2. Using any charting platform of your choice, add the Equilibrium Volume to the encryption chart.

The process of adding any indicator to the chart is if you want an easy task, due to how intuitive is usually the tradingview platform, in this sense, let's see in detail how to add the OBV indicator in this platform.
Step 1: go to the trading website (https://es.tradingview.com) and look for the trading section, then select the asset pair you want to analyze, after that, we go to the FX function and in the search tab we write OBV, selecting the first option that gives us the platform.
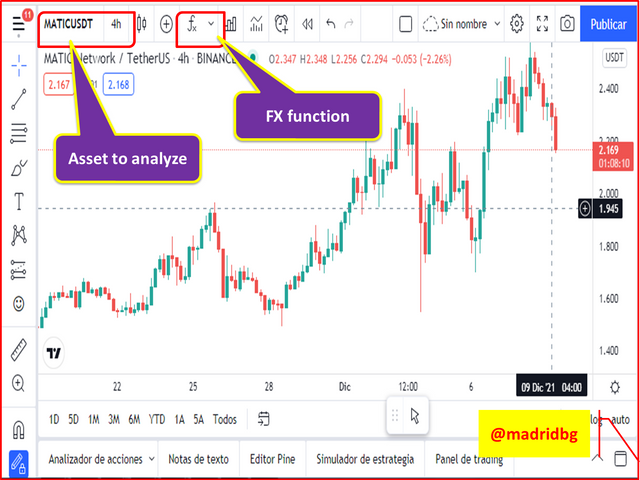
Screenshot taken by @madridbg through the tradingview portal. tradingview
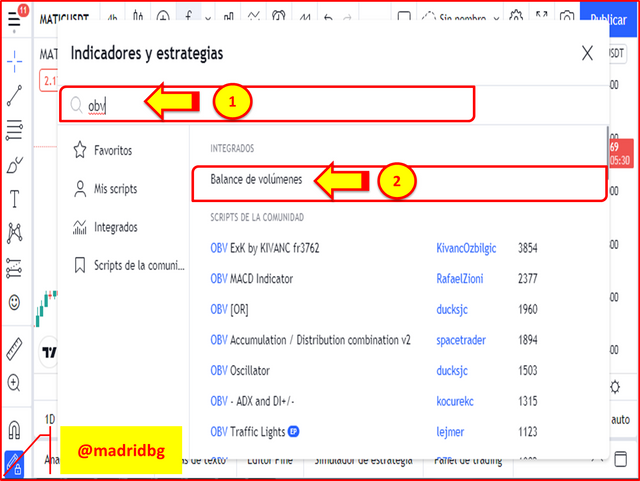
Screenshot taken by @madridbg through the tradingview portal. tradingview
Step 2: already added the indicator to the chart, we can configure the data entry, as well as the style of the indicator, at this point, let's follow up on the indicator configuration, for this, we must go to the configuration section as shown in the image below, in the first instance we will go to the data entry and choose the chart option, once configured, the data entry we have chosen is accepted.
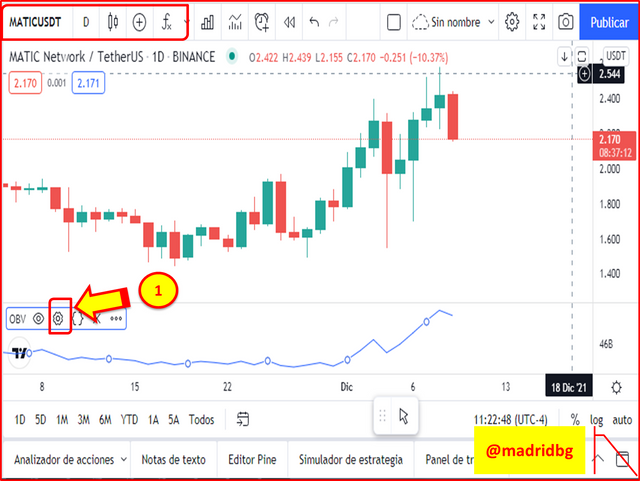
Screenshot taken by @madridbg through the tradingview portal. tradingview
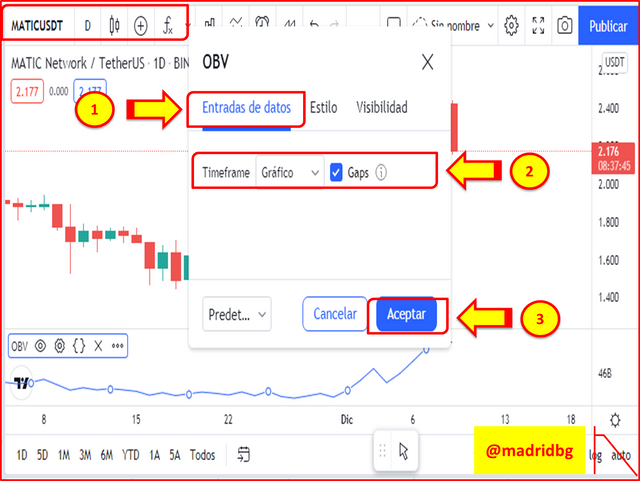
Screenshot taken by @madridbg through the tradingview portal. tradingview
Step 3: For the aesthetic configurations we will go to the style tab, at this point we can change the color of the graph line, where we can modify the opacity of these and the color associated with them, in addition to the presentation style either as line, histograms, area, among others.
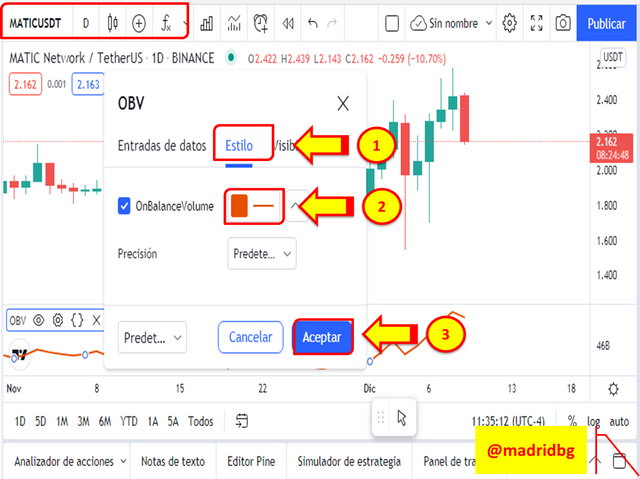
Screenshot taken by @madridbg through the tradingview portal. tradingview
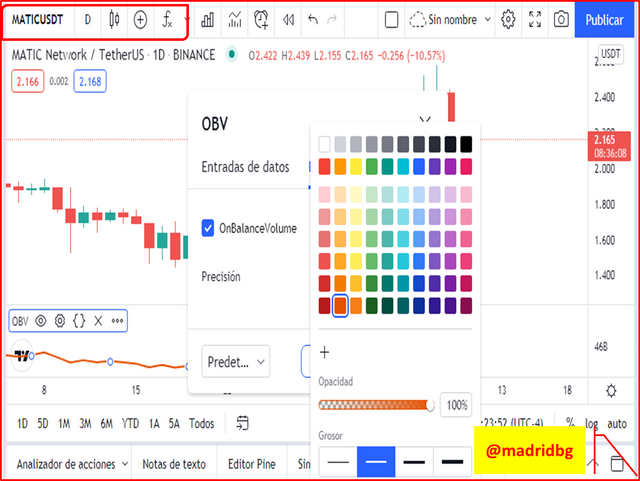
Screenshot taken by @madridbg through the tradingview portal. tradingview
Step 4: Another aspect that we can modify is the visibility of data, for this, we must go to the visibility section and make the settings that suit our style of trade, in particular is a section that I do not usually modify.
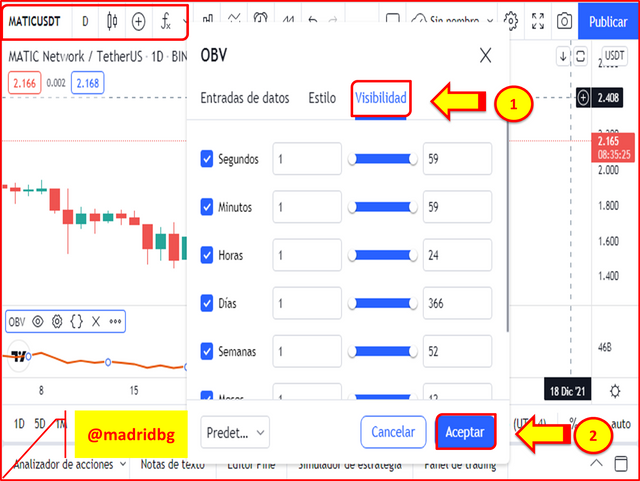
Screenshot taken by @madridbg through the tradingview portal. tradingview
3. What are the formulas and rules for calculating the break-even indicator? Give an illustrative example.

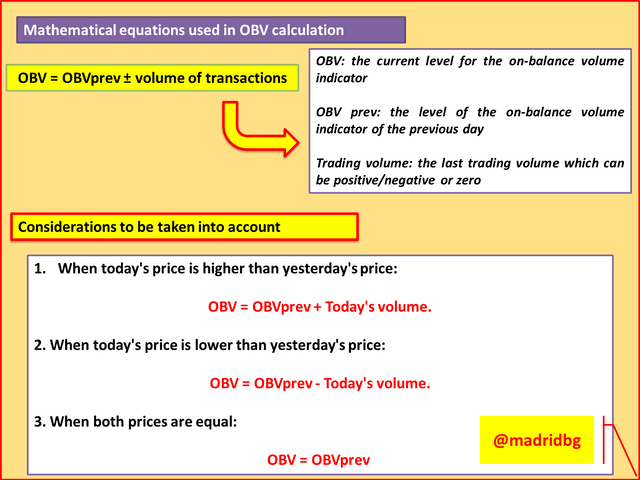
Like any indicator, the OBV is based on statistical data processing and mathematical procedures. In this sense, we will make a sequence of images that will allow us to understand how the indicator is calculated and which are the formulas used for its calculation.
About the formulas and rules used to calculate the indicator:
In the following image we can detail each of the mathematical formulas used for the calculation as well as the sequential principles to be taken in each of them.
About the proposed exercise:
Starting from the above equations, we have set up a proposed scenario that allows us to understand the use of the mathematical equations used above, stinging the basic principles of each of them.
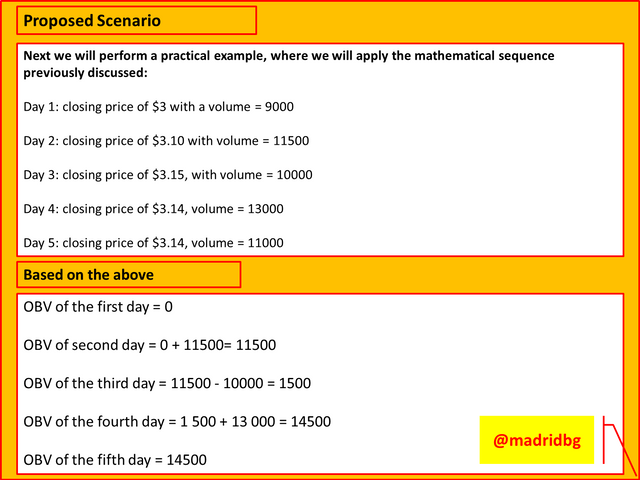
If we analyze the previous images, we can observe the sequence of mathematical formulas used to calculate the OBV of an asset, in the case of the proposed example, we can realize that there is a variant that we must assume and the same is observed in the fact that the OBV of day 3 is less than the OBV of the previous day, at this point we must subtract in the established equation, in the rest of the days the OBV of the day are greater than those of the previous day therefore, in the equations the values are added.
Undoubtedly this sequence of data, allows us to obtain valuable information about the commercial interest held on the asset and based on this, we can execute our speculation strategy.
4. What is trend confirmation by the volume indicator in equilibrium? Show it on the cipher charts in bullish and bearish directions.

It is no secret that the cryptoasset market moves in wave forms, so it is normal to have ups, downs and periods of indecision to those called lateralization or range of the asset.
Based on the above, the OBV indicator is an excellent tool to predict at what point there is greater bullish or bearish interest on a given asset, allowing us to perform a speculation process that allows us to be profitable in the time that our operations are executed.
In such a way, it is necessary to remember that the volume is nothing more than the number of incoming or outgoing orders in a period of time and depending on this volume, the price of the asset can end up rising or falling, hence we analyze how the price behaves depending on the behavior of the volume of an asset.
On uptrend behavior:
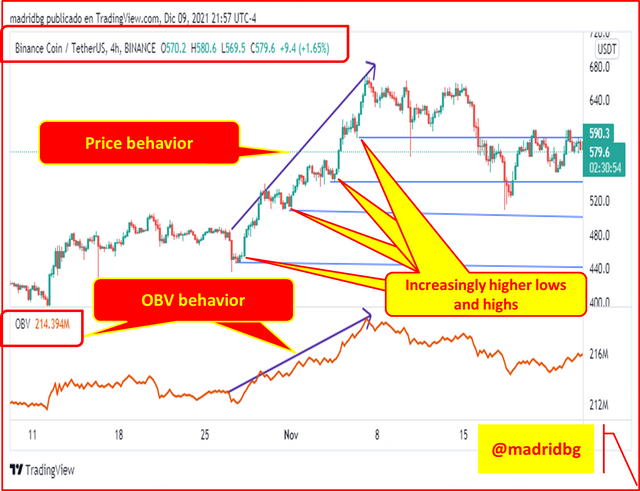
If we remember the training we have been receiving, since the start of the cryptocurrency academy, we realize that an uptrend, is formed as the buying pressure exceeds the selling pressure, at this point the asset price ends up forming higher and higher highs and higher and higher lows, which allows us to establish that the asset price has entered an uptrend.
Screenshot taken by @madridbg through the tradingview portal. tradingview
In the previous chart, for the BNB/USDT pair in 4-hour time frame, we can realize that the asset under study moves in an uptrend where the bullish trading volume exceeds that of bearish investors, an aspect that we can establish by observing the behavior of OBV.
On the behavior in a downtrend:
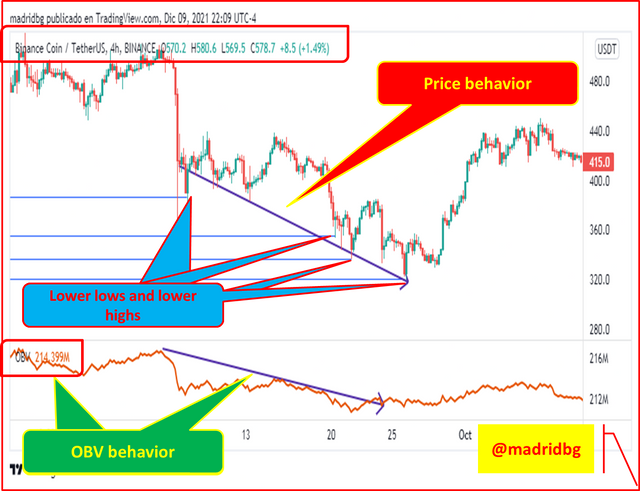
In this case, the opposite happens, since the dominant pressure is bearish, so the price tends to fall and generate lower and lower lows and highs, as we can see in the following chart for the BNB/USDT pair in 4-hour time frame, where the volume suggested by the OBV has been falling according to the behavior of the price of the asset under study.
Screenshot taken by @madridbg through the tradingview portal. tradingview
5. What is your understanding of breakout confirmation with volume indicator in equilibrium? Show it on cipher charts, both bullish and bearish.

As we mentioned before, in the market there are usually periods of indecision that are translated in lateralization or range zones, these are associated by phases of accumulation so that the price continues to rise or distribution so that the price ends up falling, in one scenario or the other, there are breaks that are accompanied with a large trading volume, hence the OBV indicator is a fundamental instrument that allows us to predict the behavior of the price and act according to this.
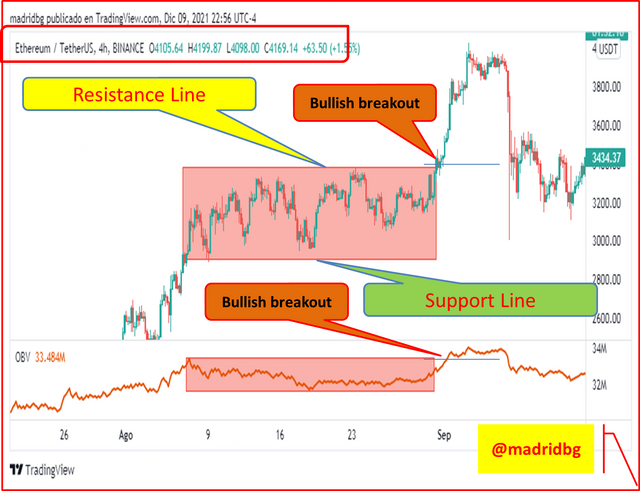
In this sense, in the chart below for the ETH/USDT pair in 4-hour timeframe, we can see how the price of the asset has entered a period of lateralization, where we have identified support and resistance zones that the price respects, at this point we can say that the price has adopted a repetitive pattern.
Screenshot taken by @madridbg through the tradingview portal. tradingview
As can be seen in the previous image for the ETH/USDT pair in 4 hours timeframe, the price has been sideways and respecting the support and resistance lines, a pattern that follows the OBV indicator and where the trading zones are low. However, once the price has managed to generate enough capital, it makes the respective breakout that we can confirm by the increase in volume in the OBV indicator, from there we can speculate on the asset to the upside and manage to capitalize on the market.
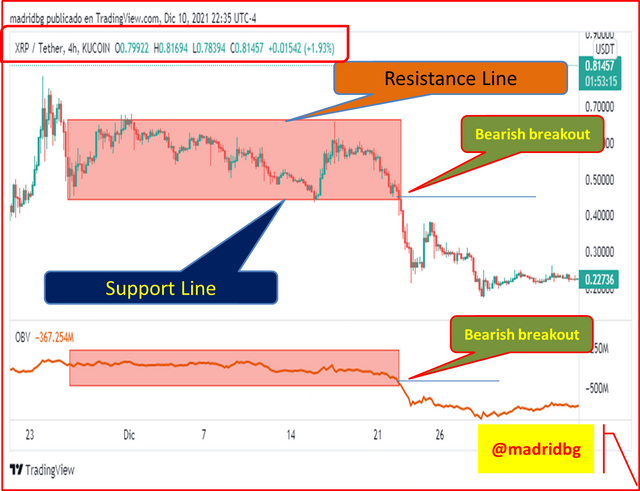
Regarding the bearish breakouts, they follow practically the same pattern, the difference lies in being able to understand the volume drop, hence it is estimated that the selling pressure has increased and the price will continue to fall.
Based on the above, we can visualize this behavior in the following chart, for the XRP/USDT pair in 4 hours timeframe, where the price has entered a distribution range that is confirmed by the bearish breakout generated, product of the number of outgoing sell orders that make the price end up breaking down.
Screenshot taken by @madridbg through the tradingview portal. tradingview
6. Explain the advanced breakout with the volume indicator in equilibrium. Show it on cryptographic charts for both bullish and bearish.

As we have well analyzed in the previous section, the price of an asset usually enters periods of commercial disinterest, patterns known as accumulation or distribution ranges, in other words, the price seeks to consolidate to go up or down according to the number of incoming or outgoing orders.
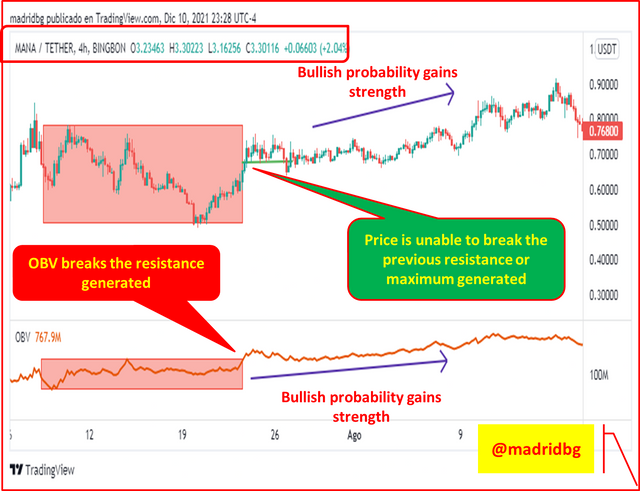
In the case of advanced breakouts, they occur and are identified since the OBV indicator manifests us a breakout of the support or resistance lines drawn, however, the price seems not to follow this pattern, so that according to what has been studied this scenario is a good signal to speculate on the asset, since under these conditions an advanced breakout to higher highs or higher lows in the asset is approaching.
In afterword, the OBV shows the breakout from the previous high or low and the price does not follow this behavior as a function of time, so a short capitalization period is expected to generate further buying or selling pressure on the asset.
Screenshot taken by @madridbg through the tradingview portal. tradingview
In the above chart, for the MANA/USDT pair in 4 hour time frame, we can observe the support and resistance lines generated and how the OBV indicator has produced a breakout at the resistance level, which is expected as a bullish move and although the price cannot break the previous high, the advanced breakout generated is an indication that the bullish probability has increased, hence, it is used as a pattern to speculate to the upside.
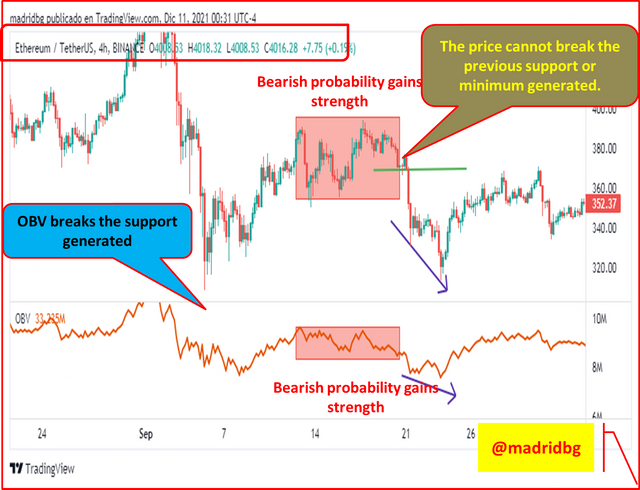
Regarding the bearish advanced breakout, it occurs when the indicator breaks the generated support and the price finds it difficult to do so, at this point the probability that the price will fall increases and can be speculated downwards.
In the following chart for the ETH/USDT pair in 4 hours timeframe, we can see how the price is not able to break the previous low generated, scenario that if it is fulfilled in the OBV indicator, at this point the probability that the price falls increases, so it is a pattern that we can use to speculate in the bearish market.
Screenshot taken by @madridbg through the tradingview portal. tradingview
7. Explain bullish divergence and bearish divergence with the volume indicator in equilibrium. Show both on graphs.

As we have mentioned in previous publications, divergences are contradictions that occur between the price action and the indicator, so that we say that the divergence is bullish, when the indicator shows us a rise and the price is falling, while the divergence becomes bearish, when the price rises and the indicator shows us a fall.
In one scenario or the other, these divergences must be respected and the probabilities of occurrence of what is established by the indicator are higher, since it is assumed as a movement where the indicator is ahead of the price, hence the fundamental of using them to speculate on a particular asset.
Bullish divergence at the chart level using the OBV indicator:
In the chart below, for the CAKE/USDT pair in 4 hours timeframe, we can observe the bullish divergence generated, where the price goes down as OBV goes up, this type of behavior must be respected since the price usually ends up complying with the established by the indicator, as shown in the image.
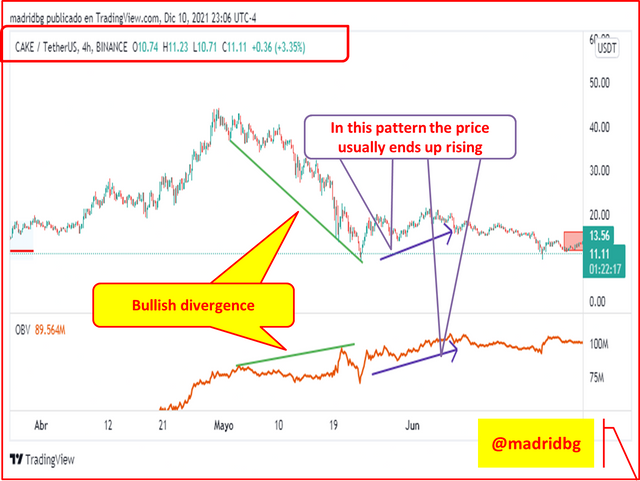
Screenshot taken by @madridbg through the tradingview portal. tradingview
Bearish divergence at the chart level using the OBV indicator:
To explain the bearish divergences we will use the chart for the BNB/USDT pair in timeframe of 4, remembering that in this pattern the price rises as OBV falls and as we have mentioned this behavior must be respected since the probability of the occurrence of what is shown by the indicator increases.
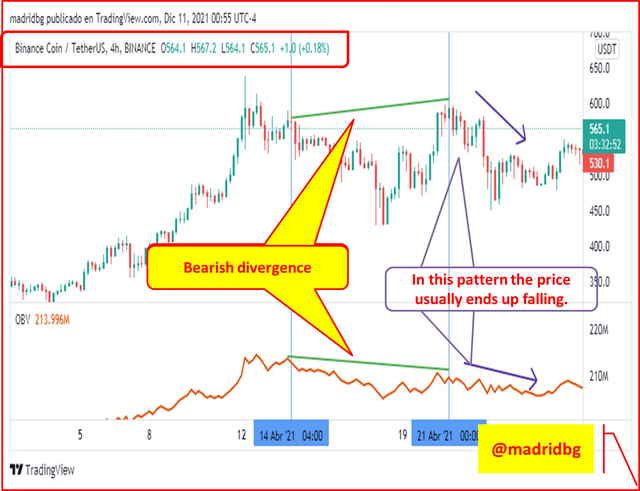
Screenshot taken by @madridbg through the tradingview portal. tradingview
8. Confirm a clear trend using the OBV indicator and combine it with another indicator of your choice. Use the market structure to place at least two trades (one buy and one sell) through a demo account with proper trade management.

Whenever I can, I mention this type of section, which does not allow us to put into practice the knowledge learned throughout the subject, in this particular, we will perform the corresponding technical analysis to establish buy and sell orders using the tradingview platform, because of how complete it is from my way of operating, for its part, the execution of the operation will develop them using the bitsgap platform, which allows us to perform operation through demo account.
With respect to the indicators, we will make a combination of the OBV indicator that allows us to measure the commercial interest of the asset, with a modified MACD that does not allow us to establish the direction of the market, in addition to this we will add the ADX, as a tool to detect the strength of the market, these indicators together we will be testing it as a trading strategy when executing our operations.
Trade 1: buy XRP/USDT:
As mentioned above the trading strategy is based on knowing the interest (volume), strength and direction of the market, based on this, in the chart below, we can see that the MACD and ADX have positive upward slopes and the OBV, although it is low, is an indication that time has passed and the asset has not finished falling.
Therefore, we have decided to speculate the market, setting our take profit in short trades or up to the proximities of the resistance marked at the top, the same responds to a 1:1 risk/reward ratio, where the stop loss will allow us to protect our trade from unnecessary losses, in case the trade is not executed according to the analysis, the numerical details of the operation we can observe in the chart below.
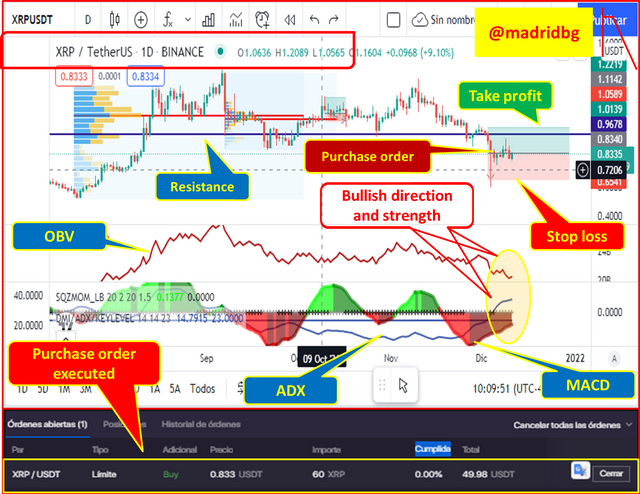
Screenshot taken by @madridbg through the tradingview portal. tradingview
Transaction 2: sale of the SHIB/USDT pair:
Having clear the structure of the strategy that we have decided to implement, we proceed to execute a sell order establishing a 1:1 risk-reward ratio, for this we can see that both the direction and the out point to a bearish scenario, in addition to the above the volume of capitalization is low, so we have allowed us to speculate the price down and as we observe the details of the operation are in the following image.
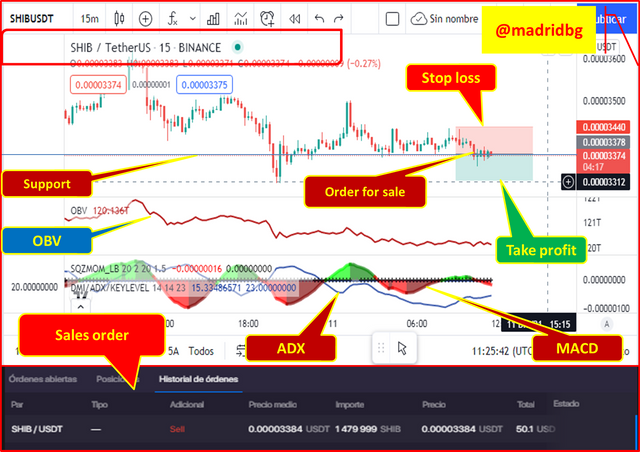
Screenshot taken by @madridbg through the tradingview portal. tradingview
9. What are the advantages and disadvantages of the equilibrium volume indicator?

Having studied all the aspects related to the OBV indicator, we can establish that it has its advantages and disadvantages, as do all the indicators in the market.
On the advantages of the volume indicator in equilibrium:
Among the advantages of the indicator are:
* It is easy to understand


1. Cover image designed by @madridbg, using public domain image
2. All charts used in this publication, are screenshots taken by @madridbg, through the tradingview platform.

* It is easy to understand since it is presented as a single line that provides valid information about the interest held on the asset.
* Its use is valuable, since it does not allow us to determine divergences, trend, periods of indecision, which allows us to speculate according to the price action.
* It can be used on any asset or market.
* It adapts to any trading strategy and therefore combining it with other indicators allows us to generate a profitable trading strategy in the market.
On the disadvantages of the equilibrium volume indicator:
The disadvantages of the indicator include:
* For greater reliability of the information it provides, the indicator must be combined with other analysis tools.
* In certain occasions the indicator is lagging so the signals it gives may be false, hence the fundamental of knowing the above disadvantage.
* It presents an important risk, which translates into the influence of large investors or institutions that move the price at will, at this point the indicator is ahead or behind, which entails risks in the market.

FINAL CONSIDERATIONS

Once we have studied the OBV indicator, we realize that it can be a great strategy if combined with other analysis tools, allowing us to find confirmations and thus be able to speculate according to the price action.
In this sense, it allows us to know the degree of commercial interest on the asset and determine the trend that the same follows, the fact of being able to study the calculation styles, allows us to generate a holistic view of the indicator in question. In this sense, I take the opportunity to thank Professor @fredquantum and the #SteemitCryptoAcademy team for the hard work of teaching that they do every week.
OF INTEREST

