

Homework
1A) Explain the Japanese candlestick chart? (Original screenshot required).
1B) In your own words, explain why the Japanese Candlestick chart is the most used in the financial market.
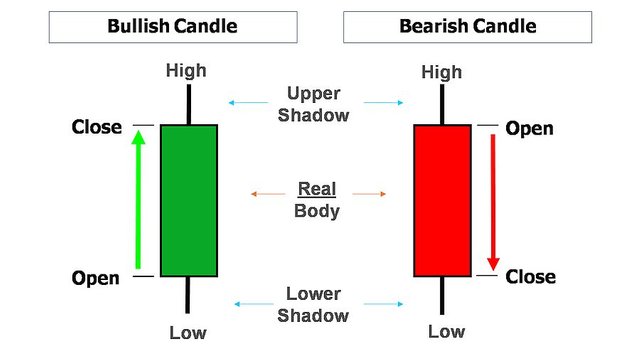
1C) Describe a bullish and a bearish candle. Also, explain its anatomy. (Original screenshot required)


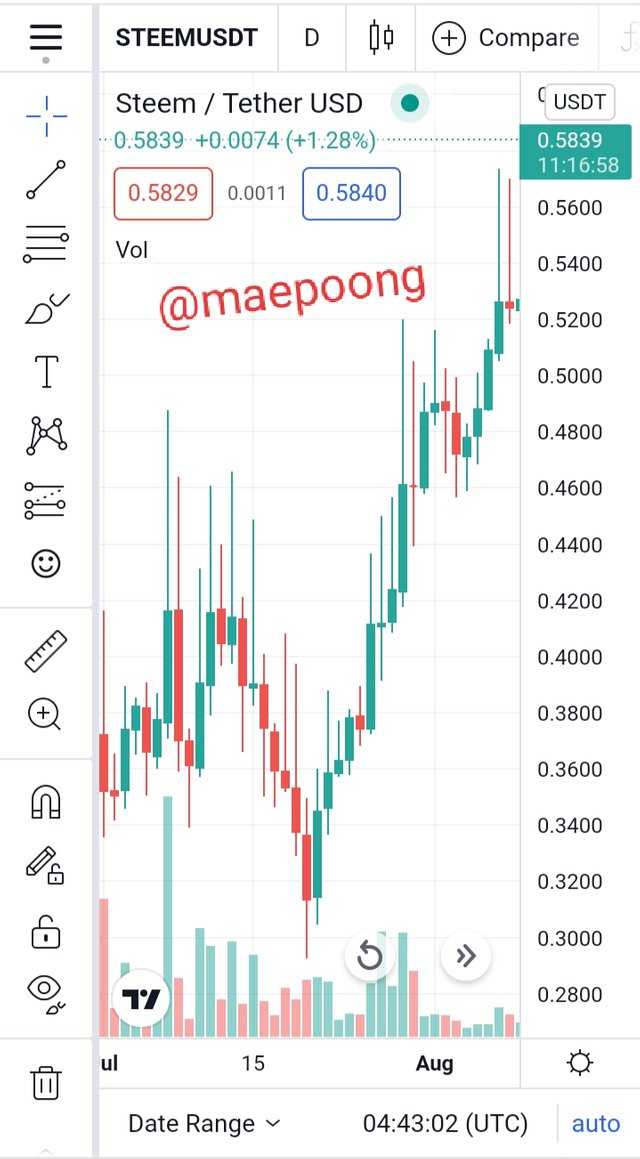
Explain the Japanese candlestick chart?.

Japanese candlesticks can be called the most popular type of presentation of price fluctuations today. Terminals usually have the ability to switch between different options, but most of them use candles. It's easy enough to explain too much filtered information, some of which is not important at all.
Japanese candlesticks are one of the most popular chart types. The charts show a lot of information and in a very visual way, allowing traders to spot potential trading signals or trends and perform analysis at a faster rate. So, let's explain what a Japanese candlestick is, how a "candle" is made, and some basic interpretations of a candlestick.
Many novice traders who are unfamiliar with the trading industry focus on candlesticks because they are easy to understand and give one the feeling of being a real trader. However, it is also true that no one makes money without using candlestick patterns. Many new traders get excited because they didn't spend much time reading about trading at first and had good results with candlestick patterns. But in the long run they fail and come back to learn more.
So, in order to learn how to read graphs, you need to know the principle of their creation. A Japanese candlestick is a structural unit consisting of two key elements:
- A rectangle is called the body of the candlestick. In rare cases, this can be a horizontal line.
- The line segment starts at the top of this rectangle. This is the upper shadow of the candle, also the name "wick" is used. Maybe absent.
The exact same segment, only at the bottom.
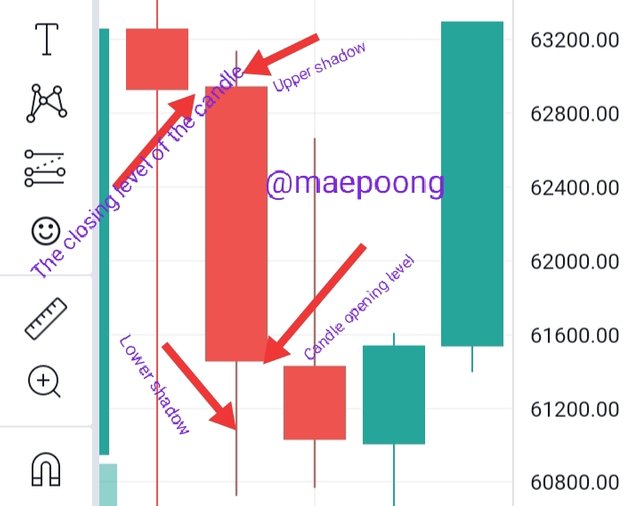
As a rule, most candles have a clearly visible rectangle and both shadows. However, depending on what is happening in the market, its shape can change quite strongly under the influence of various events and activities of market participants.lNow let's consider the process of forming a candlestick for a certain period of time and show how each of the listed Japanese candlestick elements is formed. There are 4 main indicators in total:
Candle opening level. This is the price value that was in the market when the candlestick started to form. This gives rise to the body of the candle - a rectangle. This value does not change and remains until the moment the candlestick closes, i.e. the indicated time period ends.
The closing level of the candle. This is the price value at the end of the formation.In the process, as long as the candle is not closed, the body can change, becoming bigger, smaller, and so on. If the closing price is higher than the opening price, then we get a white candlestick. If the closing price is lower, then it is black. Of course, all this can be adjusted to your taste. What we describe are standard color schemes that allow you to quickly evaluate graphics.
Lower shadow. It shows how low the price fell during the candle formation process. That is, the price reaches a certain minimum, then rises. The shadows would show how far he had descended.
Upper shadow.By analogy with the previous indicators showing extremes, but only now have the maximums shown by quotes.

In your own words, explain why the Japanese Candlestick chart is the most used in the financial market.

The reason why Japanese Candlestick charts are widely used by traders is because :
The first reason for Japanese candlesticks when combined with other technical analysis methods such as trend lines, moving averages and oscillators, Japanese candlesticks provide traders with a complete picture of the market situation. The experience of many generations of investors shows that this graphical analysis method is the most effective and very easy for market participants to understand, so many traders like it.
The reason is that Japanese candlesticks are very informative compared to other methods of graphical analysis is the most detailed view of the market situation. The line chart shows only the price levels, the bar chart shows the price levels of the open and close points. On the other hand, candlestick chart models also show the positions of sellers and buyers so that traders are very easy to understand.
The next reason why Japanese Candlestick charts are so popular is because they are very relevant in contrast to point-and-figure charts, which are not tied to a timeline, candlestick patterns allow traders to see the smallest changes in the market in real time making it easy to analyze them.
The following reason is because because candlesticks are very visual, there are many signals and patterns that traders need to make analysis and trade. Some patterns are classified as 'advanced strategies', but there are general principles that anyone new to Japanese candlestick charts should understand.

Describe a bullish and a bearish candle. Also, explain its anatomy. (Original screenshot required)

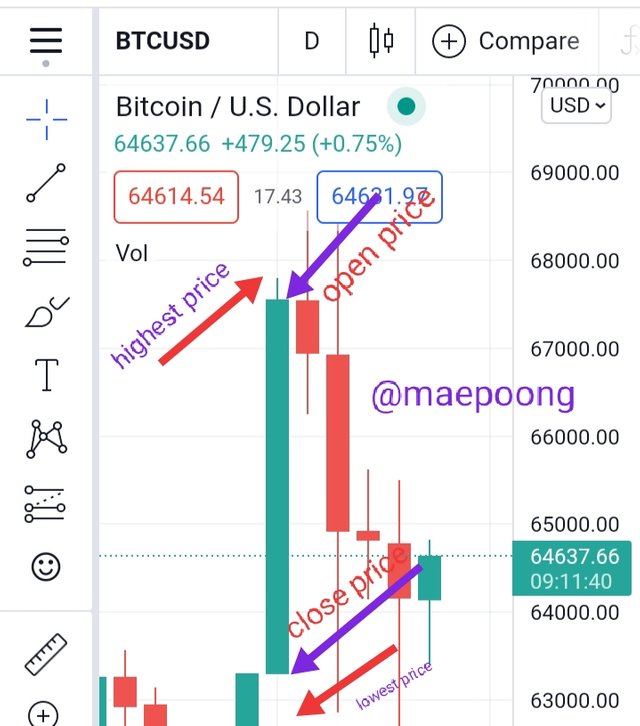
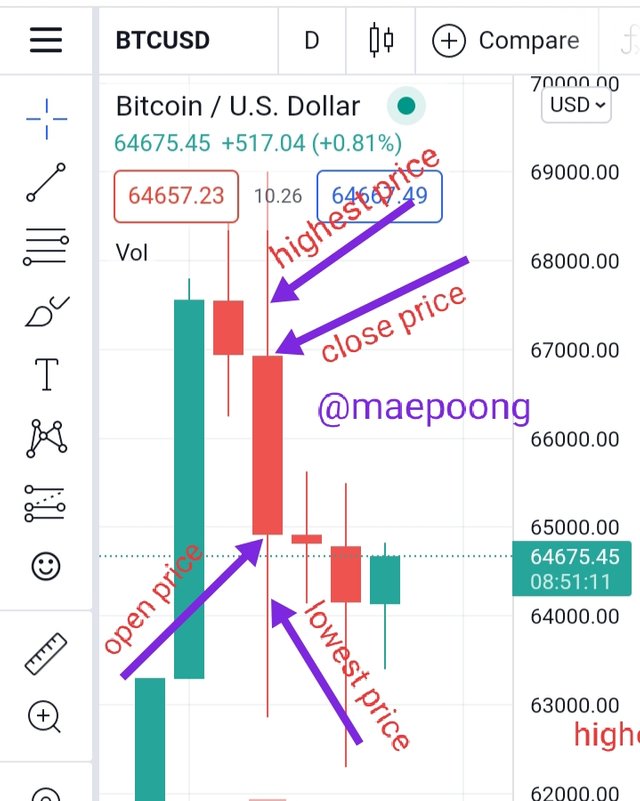
Each candlestick on the chart reflects the price movement over a certain period of time.The candlestick body is formed by the opening and closing prices, and the shadows are the highs and lows.
The upper candlestick's shadow is the vertical line that shows the difference between the high and close for a bullish candle and the difference between the high and the open for a bearish candle.
Below are my screenshots for bullish candlesticks and bearish candlesticks.
Bullish Candlestick
Bearish Candlestick
Each individual candlestick, as well as its various combinations, carries a lot of valuable information about the state of the market. In addition, many believe that the candlestick itself is a fairly reliable technical indicator, and not just a variant for displaying the price on the chart. Among other things, Japanese candlesticks can be analyzed effectively on almost any timeframe - be it daily or half-hourly charts.
However, note that a single candlestick does not contain direct information about price movements in a given time interval.There is no indication of whether the high or low was , or how many times the price went down or up.
For example, if the price contains both upper and lower shadows, it is impossible to say clearly whether the price is rising or falling initially.To find out, you need to study charts from smaller timeframes.
Observations of candlestick charts over the years allow traders to identify various signals consisting of one, two, three or more candles.
Let's consider in more detail the "anatomy" of the Japanese candlestick, as well as the basic pattern based on it.
Explanation of anatomy.
A long candlestick body usually signifies strong bull or bear pressure in the market. Short candlestick bodies usually indicate low trading activity, and or equality of relative strength between buyers and sellers during periods of market consolidation.
Bullish candlesticks with large bodies indicate significant buying pressure in the market. The longer the body of the candlestick, the bigger the difference between the closing and opening prices.
On the other hand, such candles should be considered every time in the context of a particular market situation. For example, if a large bullish candle appears suddenly after a prolonged downtrend, then this may indicate a high probabilitas of a reversal, a strong support level and or exit from a deep oversold zone.
#club5050 😀
Downvoting a post can decrease pending rewards and make it less visible. Common reasons:
Submit