Question 1
What do you understand by ultimate oscillator indicator? How do you calculate the ultimate indicator for a particular frame or candle giving real example and calculations?
The Ultimate Oscillator Indicator
The ultimate oscillator indicator is a technical indicator which is used for finding the momentum in the prices of a security. The ultimate indicator happens to be a lagging indicator and a momentum based indicator as well.
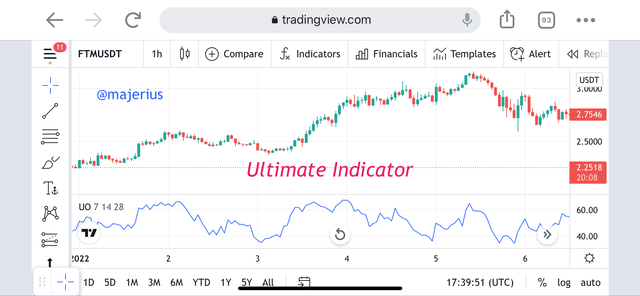
The ultimate indicator is known to behave just like the stochastic and the relative strength indicator. Meaning, the ultimate oscillator indicator fines the overbought and oversold areas in the market.
The ultimate indicator shows the overbought and oversold region in the prices using the 30 and the 70 level. It means that if we have the prices below the 30 level it is indicating an oversold in the market and signifying a beginning of an uptrend while when we have the prices above the 70 level it indicates and overbought which is signified by a start of a downtrend as the buyers are tired of selling that particular asset.
how to calculate the ultimate oscillator.
The main formula of the indicator is given by;
- Ultimate indicator =
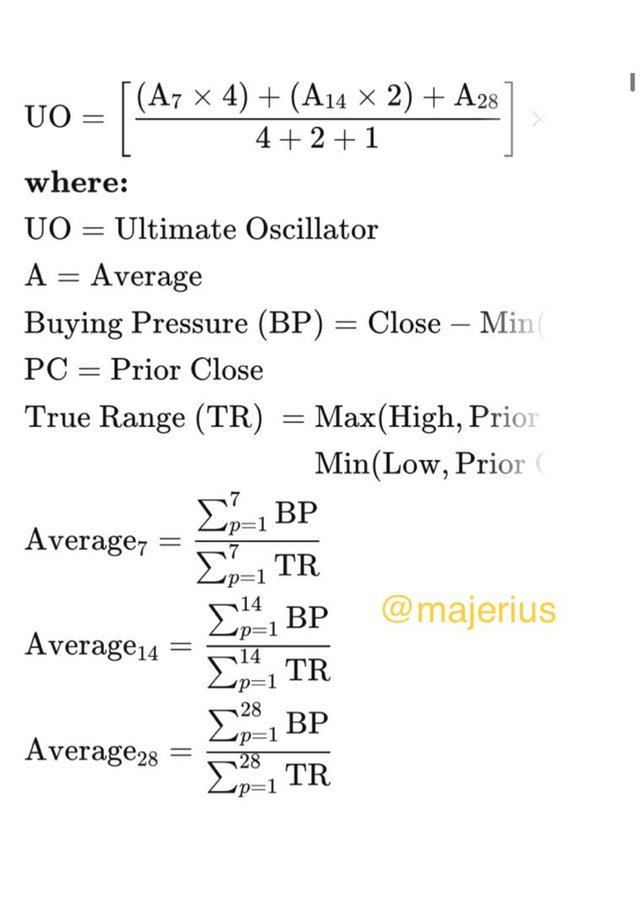
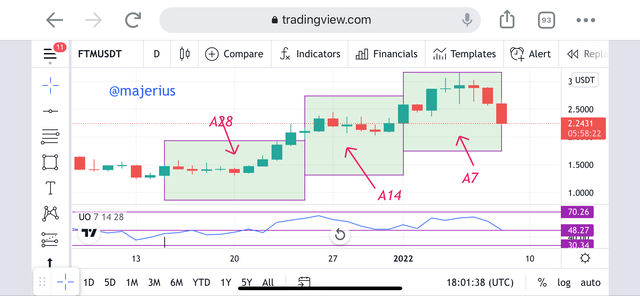
In this calculation, we will be calculating the Buying Pressure and the True range using the high, close, open and low as seen in the above to the 7, the 14 and the 28 period. This is as shown below.
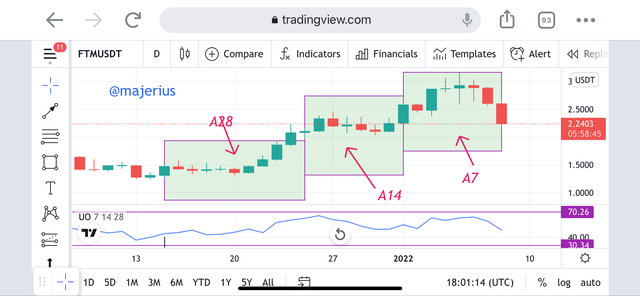
Example
Calculating Buying Pressure and True Range
We begin by calculating buying pressure and true range using the formula as stated below.
The buying pressure = current close – min (current close or previous close)
The true range = max (current high - previous close) - min(current close or previous close)
This is shown in the database below;
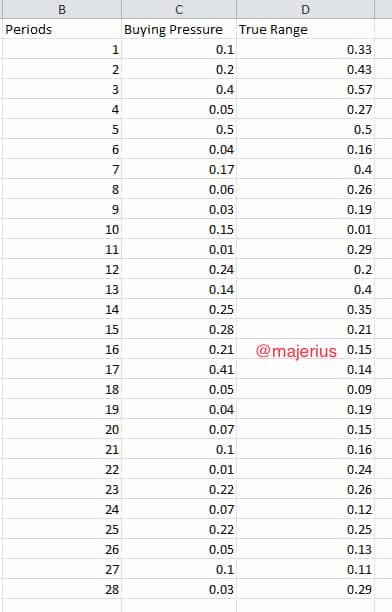
Now calculating the A7, A14 and A28
- A 7 = sum of BP for last 7 days / sum of TR for last 7 days
= 1.46 /2.66
0.56
- A 14 = sum of BP for last 14 days / sum of TR for last 14 days
= 2.34 / 4.36
0.53
- A 28 = sum of BP of last 28 days / sum of TR for last 28 days
= 4.2 / 6.85
0.61
Inputting now in the ultimate oscillator formula
[((A 7 * 4) + (A 14 * 2) + (A 28 )) / 7] * 100
[(( 0.56 X 4) + (0.53 X 2) + (0.61) / 7) * 100
= 48.2

Question 2
How to identify trends using the ultimate indicators and the difference between the ultimate indicator and stochastic indicator.
How to Identify Trends with Ultimate Indicator
Uptrend Identification
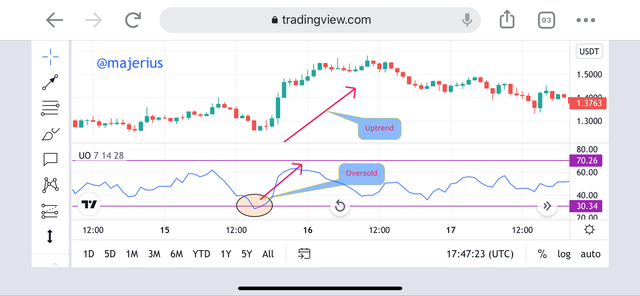
Identifying trends with the ultimate indicator is simple and straight forward. The uptrend is shown when we have the ultimate indicator crossing below the 30% level line which is the indication of a oversold. This oversold is the indication that the sellers are tired of selling their holding of that particular asset which is an indication of an uptrend beginning which is shown in the ftm/usdt chart.
Downtrend Identification
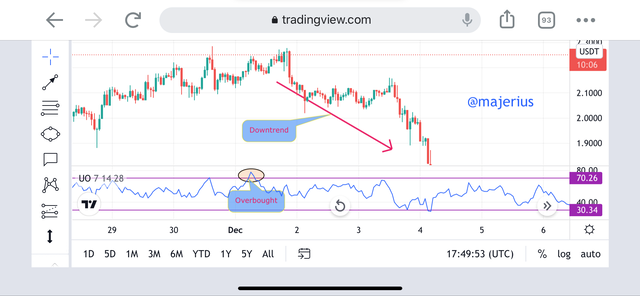
The downtrend identification with the ultimate oscillator indicator is the exact opposite of the uptrend identification. It is seen as we have the formation of an overbought point. The overbought is seen as we have the prices crossing the 70% level line which indicates that the buyers are tired of purchasing that particular asset. We can also see the indication of the oversold in the ftm/usdt below.
Difference between the Stochastic and the Ultimate Oscillator Indicator
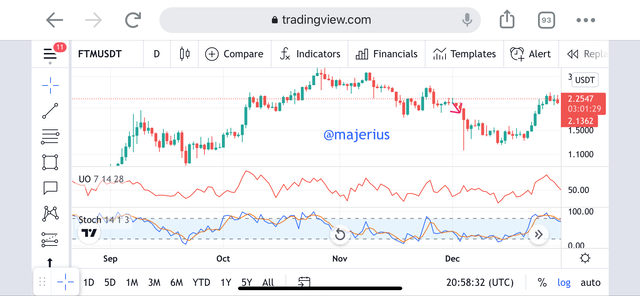
The ultimate indicator and the stochastic indicator both show overbought and oversold areas. The difference is that the upper level of the ultimate indicator is represented by the 70 level while the lower level is represented by 30% by default. In the stochastic, we have the representation by 80% and 20% for the upper and the lower levels respectively.
The stochastic indicator line is represented by two lines while the ultimate oscillator indicator is represented by a single line.
For the calculation of the stochastic indicator, we take into consideration the 3 and the 14 periods while for the calculation of the ultimate indicator, we take into consideration the 7, the 14 and the 28 periods.
For the giving of signals, the ultimate oscillator provides very few signals because it makes use of multiple time frames while the stochastic provides many signals.

Question 3
How to identify divergence in the market using ultimate oscillator and which other can be used.
How to identify divergence
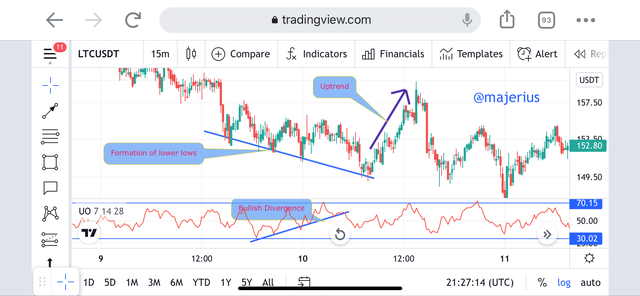
Bullish Divergence
We can identify the bullish divergence when we have the formation of higher highs with the ultimate oscillator while the current movement of the prices is in a downtrend with the formations of lower highs. This is a simple and vivid explanation of the bullish divergence.
With this formation, we see that the downtrend will turn into an uptrend which is a perfect entry when we have the breaking of the break point as shown in the formation below.
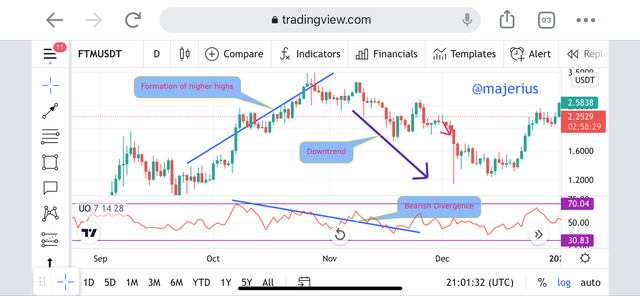
Bearish Divergence
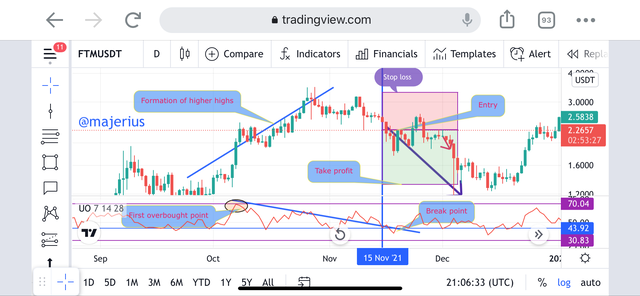
We can identify the bearish divergence when we have the formation of lower highs with the ultimate oscillator while the current movement of the prices is in an uptrend with the formations of higher highs. This is a simple and vivid explanation of the bearish divergence just as above.
With this formation, we see that the downtrend will turn into an uptrend which is a perfect entry when we have the breaking of the break point as shown in the formation below.
Which other indicator can we use in place of ultimate indicator.
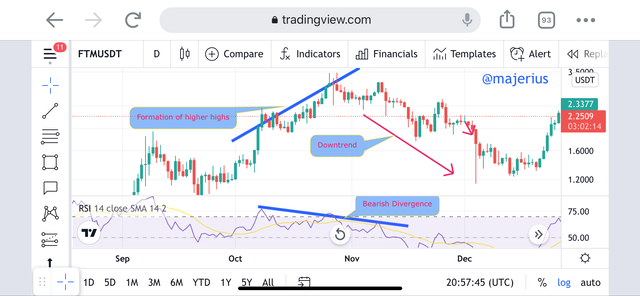
We can use the relative strength index indicator and the stochastic indicator in place of the ultimate oscillator indicator. In this experiment, I will be explaining using the relative strength index for the divergence. We have the formation of a bullish divergence with the relative strength index indicator when we have the formation of higher highs and the formation of lower lows with the prices. While for a bearish divergence, we have the formation of a lower highs with the relative strength index indicator and higher highs with the prices.

Question 4
What is the 3 step approach method through which buy and sell in the market.
What is the Step Approach for the Buy and Sell
3 Step Approach for buy
For the 3 step approach to enter a buy position, we are going to follow each of the steps as shown below.
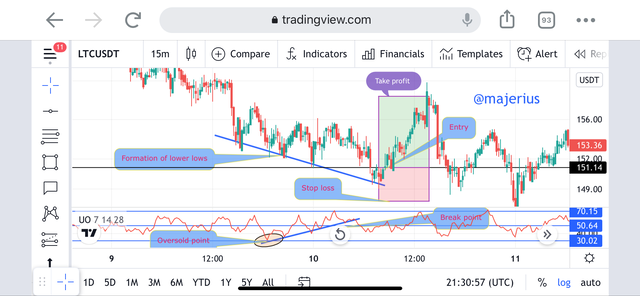
- The first step is to identify the trend, knowing if we have a bullish divergence. As earlier explained above, we have the bullish divergence formation when we have the formation of higher highs with the ultimate oscillator indicator while we have the formation of lower lows with the prices which is signalling a trend reversal.
- The second step is the identification of a lower low point which will be the formation of an oversold region normally below the 30% level which is an indication of an uptrend beginning.
- The third step which is the last step is the identification of the ultimate indicator to rise above the divergence high point found between two lows of the divergence.
3 Step Approach for sell
For the 3 step approach to enter a sell position, we are going to follow each of the steps as shown below.
The first step is to identify the trend, knowing if we have a bearish divergence. we have the bearish divergence formation when we have the formation of lower highs with the ultimate oscillator indicator while we have the formation of higher highs with the prices which is signalling a trend reversal.
The second step is the identification of a higher high point which will be the formation of an overbought region normally above the 70% level which is an indication of a downtrend beginning.
The third step which is the last step is the identification of the ultimate indicator to fall below the divergence low point found between two highs of the divergence.

Question 5
What is your opinion about the ultimate oscillator indicator and timeframe you prefer?
What is my conclusion on the ultimate oscillator indicator?
My conclusion on the ultimate indicator is that it is a very good indicator to find entry and exit trades in the market. This has been proven with the numerous analyses I have carried out so far. The ultimate oscillator with the proper implementation of the bullish and the bearish divergence provides better entry points with a high percentage of winning.
A good aspect that could be used to enhance the winning of the signals s through the usage of confluence trading which will be using the ultimate oscillator along other indicators such as the moving average and the Bollinger band indicator.
the timeframe I will prefer for the usage with this indicator is shorter timeframe such as the 15 and the 30 minute timeframes. This is because the indicator provides signals very slowly and using longer time frames will take forever to get a signal.

Conclusion
The ultimate oscillator indicator is a technical trading tool which is used as a lagging and a momentum based indicator to capture overbought and oversold points in the market using the 30% and the 70% levels.
The indicator is calculated based on the 7, the 14 and 28 period which makes it unique to other momentum based indicators.
With the usage of the bullish and the bearish divergence, we can be sure to get entry and exit points.