
What is your understanding of the TRIMA indicator?

Technical analysis is a trading approach that evaluates investments and discovers trading opportunities by analysing trends derived from trading activities such as value movement. Price patterns, trading signals, and other analytical charting tools such as the EMA, SMA, TEMA, TRIMA indicator, RSI (relative strength index), and others are used by technical analysts to assess an asset's strength or weakness.
The Triangular Moving Average (TRIMA) is a moving average-based indicator that is effectively a doubly smoothed Simple Moving Average that smooths down the data to reveal clear trade signals during periods of high volatility.
The triangle moving average's objective is to double-smooth price data, resulting in a line on your chart that doesn't react as quickly as a SMA. Depending on what you're using the TMA for, it can be beneficial or problematic.
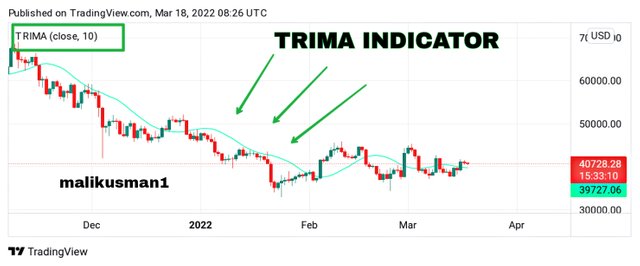
In volatile market conditions, the TMA won't react as rapidly, therefore your TMA line will take longer to change direction. If you're utilising the TMA as a trade signal, it can take too long to react.
However, the TMA's latency can be advantageous. The TMA will not respond as strongly if the price goes back and forth (range), indicating that the trend hasn't moved. To force the TMA to change directions, the price must move in a more consistent manner.
The TMA is not the moving average to use if you want to react swiftly to price fluctuations. If you want a responsive moving average, you should use a front-weighted moving average, an exponential moving average (EMA), or even a SMA. If you prefer an indication that doesn't react as much or as frequently to price swings, the TMA is a suitable alternative.

Setup a crypto chart with TRIMA. How is the calculation of TRIMA done? Give an illustration. (Screenshots required).

Technical indicators in financial markets are based on calculations derived from previous data. Let's have a look at how we can now calculate the TRIMA indicator. So now I'll figure out the TRIMA indicator formula.
To begin, compute the simple moving average (SMA) as follows:
Simple Moving Average = (P1 + P2 + P3 + P4 +... + Pn) divided by n
Then, to generate TMA values, take the average of all the SMA values.
TRIMA = SMA1 + SMA2 + SMA3 + SMA4 +... SMAn) divided by n
TRIMA = SUM (SMA values) divided by n
So this is the basic formula of Triangular moving average (TRIMA).
To configure the TRIMA indicator on the chart, I go to the Trading View website.
Then I select the indicators option on the BTC/USD chart.
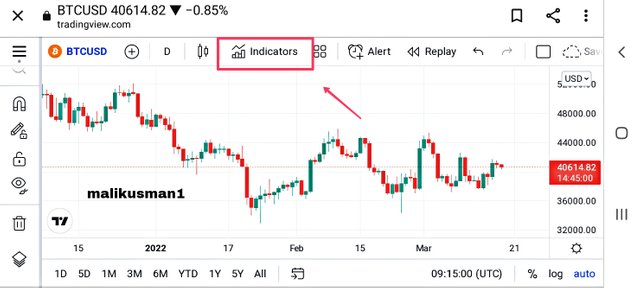
Then I use the search bar to look for TRIMA indicator, and then I search for it and open it. After that, as shown in the screenshot below, the TRIMA indication was successfully added to the chart.
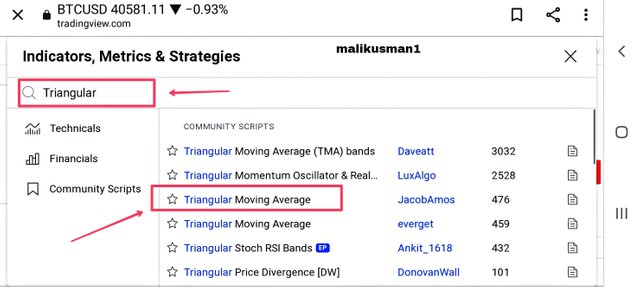
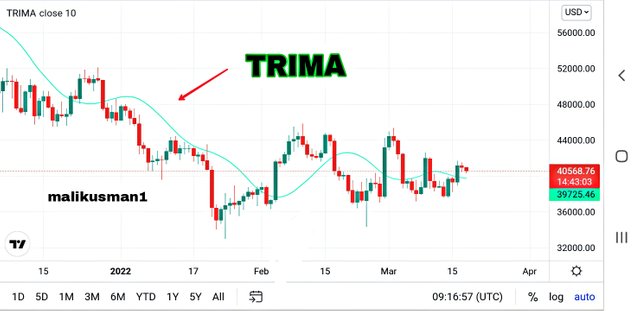
Then I choose the setting option and set the length to 20. TRIMA was successfully added to the BTC/USD chart after that.
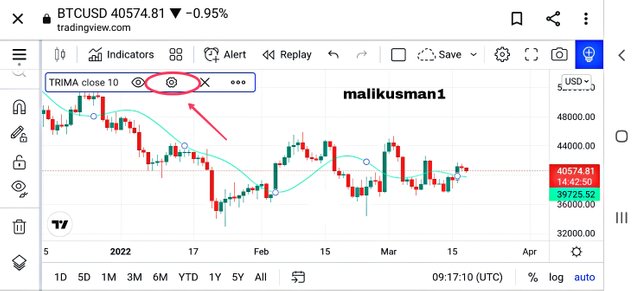
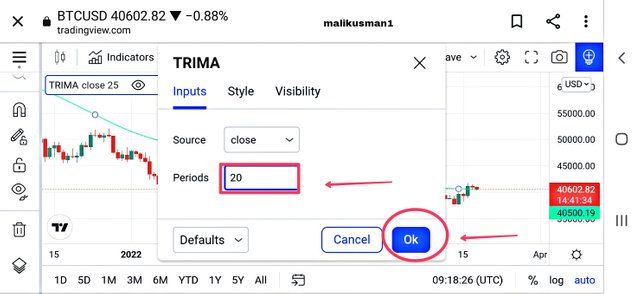
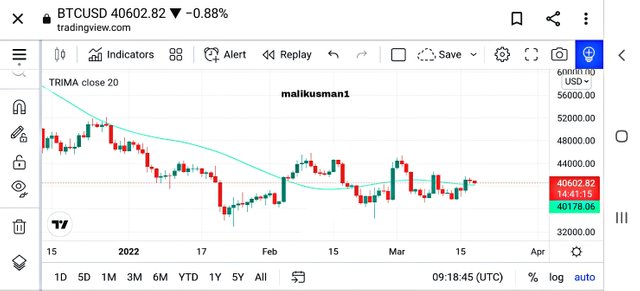
So this is how I set up the TRIMA indicator on the BTC/USD chart. Changing these parameters is not recommended unless you are an experienced trader who has used this indicator before.

Identify uptrend and downtrend market conditions using TRIMA on separate charts.

There are several advantages to using indicators in crypto and other financial markets, one of which is the ability to recognise uptrends and downtrends with the use of these indicators.
- Bullish Trend
To check a bullish trend using the TRIMA indicator, we must first ensure that the TRIMA is increasing in such a way that the indication is trending towards the market price, that means the market price is moving above the TRIMA indicator while the TRIMA line is moving below it.
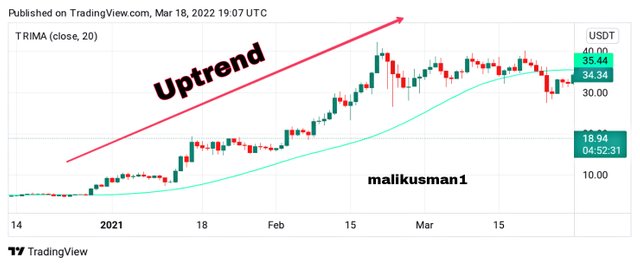
Since can be observed in the screenshot above, the market is in an uptrend, as the price is moving above the TRIMA indicator green line.So, in this way we can check the market bullish trend with the help of TRIMA indicator.
- Bearish Trend
To check a bearish trend with the TRIMA indicator, we must ensure that the TRIMA indicator line is falling. So, if the market travelling below the TRIMA indicator line and TRIMA is making its line above the market price in this case we can see a downtrend or bearish market.
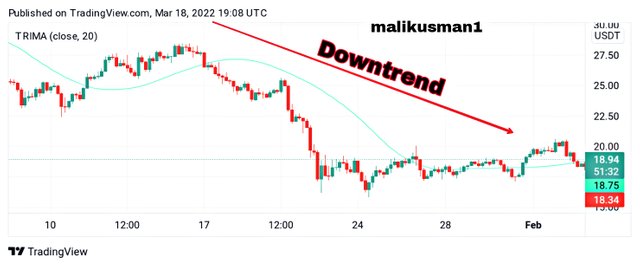
As can be seen from the screenshot above, the market is travelling below the TRIMA indicator that means a downtrend. So, in this way we can check the downtrend with the help of TRIMA indicator.

With your knowledge of dynamic support and resistance, show TRIMA acting like one. And show TRIMA movement in a consolidating market. (Screenshots required).

The market might draw back into and find support at dynamic support and resistance levels, which must be at a horizontal support or resistance level. This occurs because the market is constantly changing, and interest in buying and selling fluctuates in ways that aren't always predictable.
- Dynamic Support
TRIMA can also be used to find dynamic support and resistance. Price finds support on the TRIMA line during an uptrend, as shown in the screenshot below. After that, the price returns to its original state. This dynamic support could be used as an entry point for a purchase position.
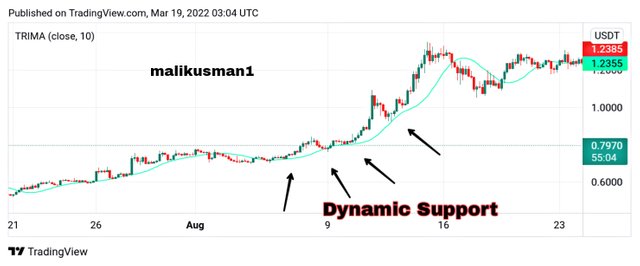
We can see how the TRIMA indicator acts as dynamic support to price during an uptrend in the screenshot above. We can notice that how the pricing is rejected when it comes into contact with the TRIMA indicator due to its dynamic support.
- Dynamic Resistance
The TRIMA indicator is also a good dynamic resistance indicator. We can also check the dynamic resistance with the help of this indicator.So, During a decline, the TRIMA indicator finds resistance. This dynamic resistance can be used as an entry point for a sell short trade.
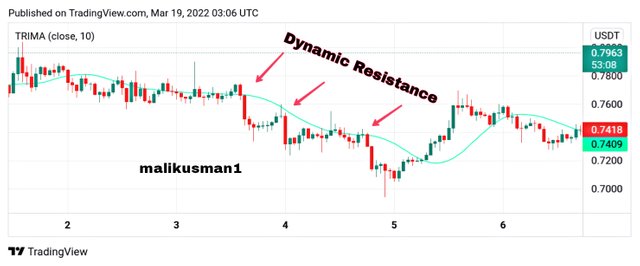
We can see how the TRIMA indicator acts as dynamic resistance to price during a downtrend in the screenshot above. We can notice that how the pricing is bounce back when it comes into contact with the TRIMA indicator due to its dynamic resistance.
- Consolidating Market
TRIMA is moves up and down in a consolidating market. As a result of the price change, the indicator will move up and down. When you notice this, you should know that the market is consolidating and that you should avoid trading at this time. Because trading at this time is dangerous for someone who is inexperienced.
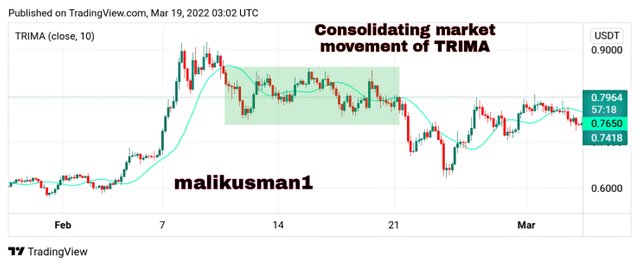
We can see from the screenshot above that the market has no direction due to its up and down price movement, implying that it is consolidating, and we can witness TRIMA's behaviour at that moment. Due to the sideways market, the TRIMA indicator was only moving up and down.

Combine two TRIMAs and indicate how to identify buy/sell positions through crossovers. Note: Use another period combination other than the one used in the lecture, explain your choice of the period. (Screenshots required).

TRIMA Indicator reacts slowly under very volatile conditions, as I explained in question 1. As a result, finding buy or sell signals with just one TRIMA Indicator will be challenging. We all know that no single indicator is 100 percent accurate. To check the buy and sell positions, we must utilise two or more indicators.
To check buy or sell signals of a crypto pair, we can combine two TRIMA Indicators. We can receive buy or sell signals by combining one shorter length TRIMA and another longer length TRIMA. If the shorter TRIMA corssover the lager TRIMA and goes up then an uptrend can be seen. And if the larger TRIMA line crossover the small TRIMA line and goes down the a downtrend can be seen.
- Buy Crossover
To check entrance points, I'll merge two TRIMAs. I'm going to combine a TRIMA with a length of 10 inches in light green and another with a length of 25 inches in purple. When shorter TRIMA line crossover to longer TRIMA line and rises above the longer period length TRIMA, we can consider that point to be our purchase entry point. When the small TRIMA crosses over the longer TRIMA line, we know we're in an bullish and may start buying.
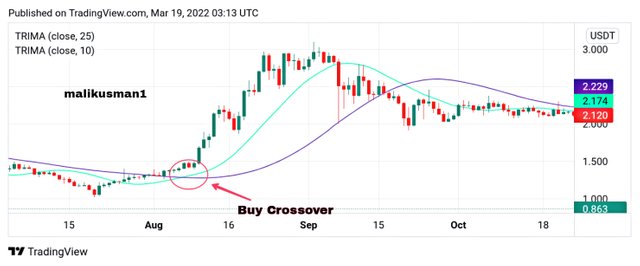
We can see that the small length TRIMA crosses over the larger length TRIMA line in the above screenshot, and that point can be considered a purchase point.
- Sell Crossover
As I stated in the beginning of this question, I will utilise two TRIMA, one with a length of 10 and the other with a length of 25. When the large period TRIMA line crosses the small TRIMA line and rises above the shorter period length TRIMA, that point can be used as an entry point for short positions or as an exit point for long positions.When the longer TRIMA crosses over the shorter TRIMA, it indicates that the market is in a downturn, and we can enter a short position.
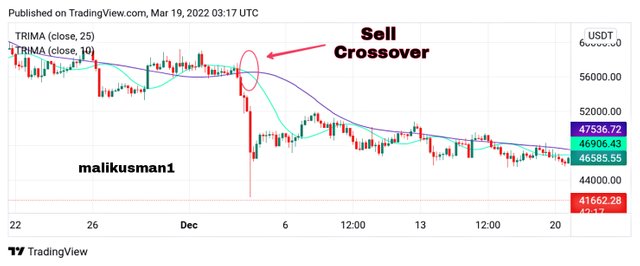
We can see that large length TRIMA crosses over the small period length TRIMA in the above screenshot, and that point can be regarded a sell point.

What are the conditions that must be satisfied to trade reversals using TRIMA combining RSI? Show the chart analysis. What other momentum indicators can be used to confirm TRIMA crossovers? Show examples on the chart. (Screenshots required).

It is usually beneficial for traders to understand the requirements that must be met before to engaging in any trading because these circumstances are excellent for trading and can help the trader make a large profit. So, below, I'll list the requirements that must be completed before trading using this TRIMA cross over method combined with the RSI indicator for profitable or risk-free trading.
- To receive a bullish indication for reversal, the asset's price has to be in a downtrend.
- The RSI indicator has to be in the oversold zone.
After that, confirm the purchase crossover on the chart. This signifies that the tiny period of TRIMA will cross the vast period of TRIMA.
You can see an upward trend after the short lenght of TRIMA crosses the long lenght and moves up, and you take your initial buy entry there.
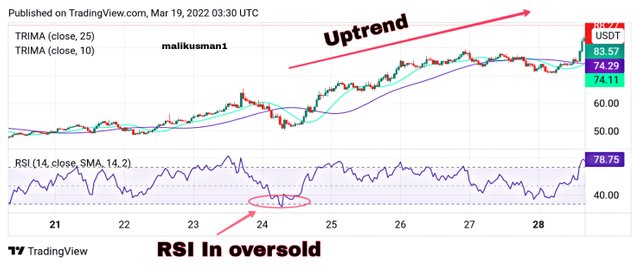
The asset has been on a bearish trend, as shown in the screenshot above, and the RSI indicator has also in the oversold level. This indicates that the current trend is about to change. As can be seen in the chart above, the TRIMAs crossed over shortly after that. This is the ideal time to place a buy order. As a result, we may use TRIMA to take a buy entry in this manner.
- To receive a bearish indication for reversal, the asset's price has to be in a uptrend.
- The RSI indicator has to be in the overbought zone.
After that, confirm the sell crossover on the chart. This signifies that the large period of TRIMA will cross the small period of TRIMA.
You can see an downward trend after the long lenght of TRIMA crosses the short lenght and goes down, and you take your initial sell entry there.
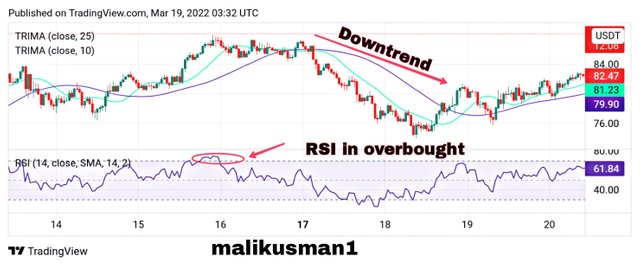
The asset has been on a bullish trend, as shown in the screenshot above, and the RSI indicator has also in the overbought level. This indicates that the current trend is about to change. As can be seen in the chart above, the TRIMAs crossed over shortly after that. This is the ideal time to place a sell or exit order. As a result, we may use TRIMA to take a sell entry in this manner.
- Compare TRIMA with MACD
The MACD indicator is made up of two EMAs which is a type of moving average, a fast period EMA and a slow period EMA, as we all know. A trend reversal indication is a crossover of the fast period EMA above and below the slow period EMA.
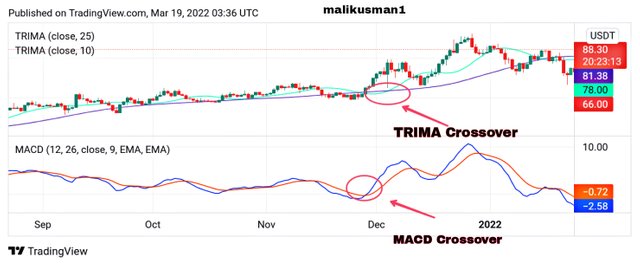
On the MACD indicator, we can see a crossover of the slow period EMA over the fast period EMA in the screenshot above. This is interpreted as a bullish trend reversal, which the TRIMA indicator also verified. A crossover of the small TRIMA line over the large TRIMA line can also be seen on the TRIMA indicator.So, With the help of these two indicators, we can then conduct a buy entry there.

Place a Demo and Real trade using the TRIMA reversal trading strategy (combine RSI). Ideally, bullish and bearish reversals. Utilize lower time frames with proper risk management. (Screenshots required).

In this question, I will choose Trading view website to check my entry and exit positions on a demo and real trade.
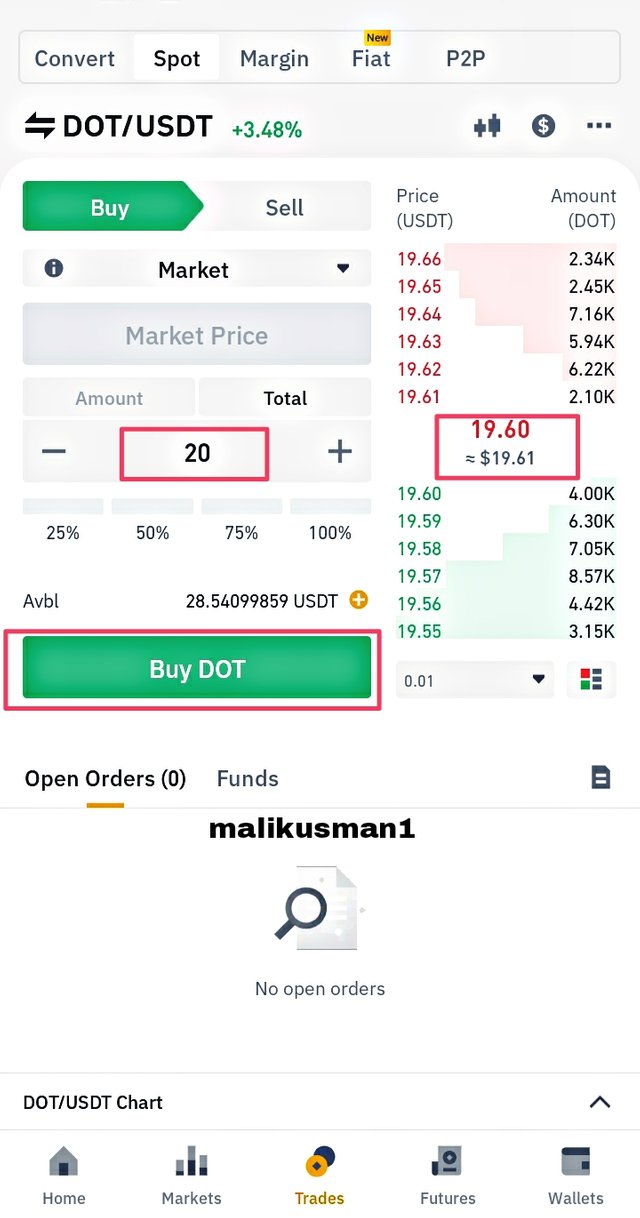
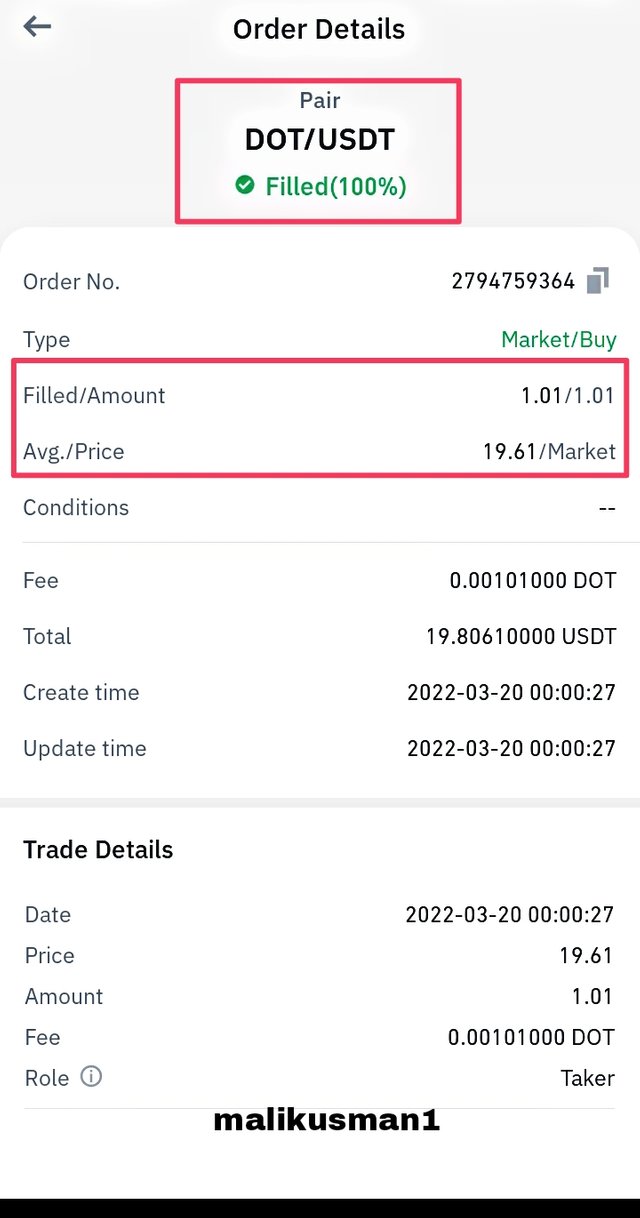
- Buy real trade
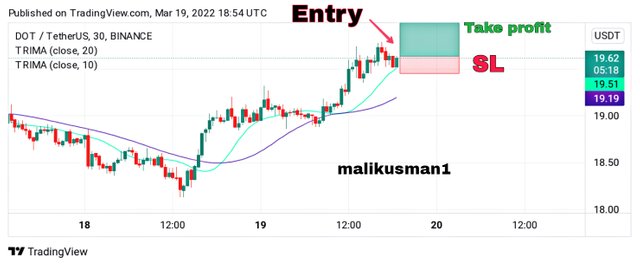
I saw that the price was falling on the DOT/USDT chart below. because the small period TRIMA line was below the large period TRIMA line. After a length of time, the short period TRIMA crossed above the long period TRIMA, resulting in a massive upswing. After the development of one green candlestick, I entered a buy trade with a stoploss on the TRIMA line, which functions as a dynamic support.
|
|
|
|---|
So, in the above screenshots you can see the prove of my transaction that i do on binance platform.
- Sell short trade
I noted that the small period TRIMA line is above the long period TRIMA line on the DOT/USDT chart below, indicating that price is in an uptrend. The tiny period TRIMA line crosses the long TRIMA line and descends after a period of time, indicating a trend reversal from bullish to bearish. I entered a sell position with a stoploss above the huge TRIMA line, which serves as resistance.
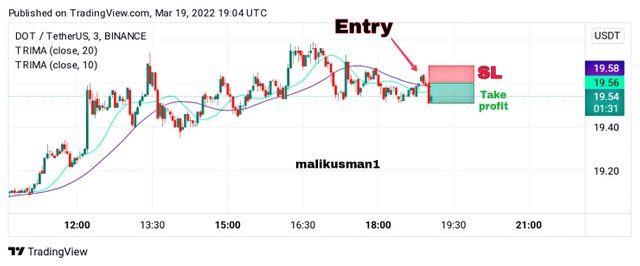

So, in the above screenshots you can see the prove of my transaction that i do on trading view platform.

What are the advantages and disadvantages of TRIMA Indicator?

- Better entrance and exit locations are obtained by combining two TRIMA indicators of big and small length.
- This is a technical indicator that is used to determine the direction of the market. We can easily determine the trend with the aid of this indicator.
- This indicator is quite useful in determining dynamic support and resistance.
- Its use in conjunction with the MACD and other indicators will aid us in analysing trade signals. It's also highly useful in a certain market trend.
- In a consolidating market, this indicator cannot assist traders in obtaining accurate results.
- Trading with simply one TRIMA is not a good idea. Because no single indicator can be relied upon to be 100 percent correct.
- The TRIMA indicator, as we all know, is a lagging indicator. As a result, traders will lose some significant market positions.

Conclusion

It was an excellent presentation on the TRIMA Indicator. This post taught me a lot about the TRIMA indication. TRIMA Indicator is a trend-based indicator that can assist traders spot trend reversals in technical analysis. For better results, we can compare two TRIMAs. Finally, I'd want to express my gratitude to Professor @fredquantum for this fantastic and educational talk on the TRIMA indicator.

Some photographs designed and edit by me on Canva and Picsart. Some Remaining Unsourced Screenshots taken from Tradingview and Coinmarketcap website and the grammer check from grammarly.

SUBMITTED TO DEAR PROFESSOR:
@fredquantum
SUBMITTED BY :
@malikusman1
THE END 😇

