"It was clear to me that other people could trade for a living, and if it was possible for other people to do it, then I could persevere long enough to figure it out."
Rob Booker

Image edited with PicsArt
Crypto Trading with Contractile Diagonals || Steemit Crypto Academy S4W3 || Homework Post for @allbert

What is a Contractile Diagonal?
First, to explain what contractile diagonals are, it seems to me appropriate to detail that the diagonal waves (whether contractive or expansive), constitute a relevant part of the group of classical motor patterns that support the Elliott Principle, as they shape the types of patterns that act as drivers of market trends. However, the diagonal waves move slowly and generally identify with those scenarios that we qualify as lateral-bullish or lateral-bearish, so you have to have more patience to earn money with them.
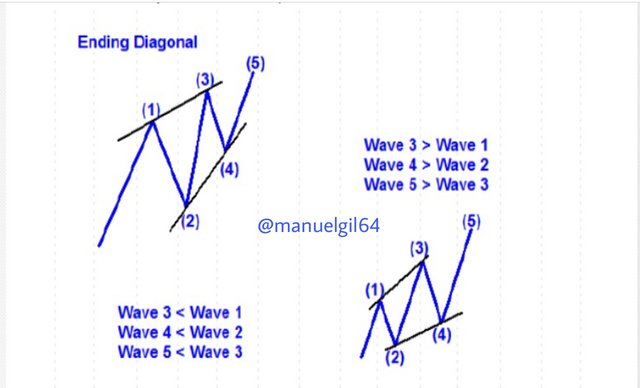
The pattern of the Diagonal Contractiva is that in which the line of resistance and the line of support of the structure are convergent so that the figure adopts the classic look of a wedge pattern, and the price movements that are forming are getting narrower as we approach the end of the pattern. This type of diagonal waves can be divided into two types which are: The initial diagonal waves, which are shown in the early stages of a new trend market, while the bulk of investors think that the previous move is still in place and are not aware that a directional turn has begun. These in turn, lead a 5-wave pattern or the first part of a zigzag, so they appear at the position of wave 1.
On the other hand, there are the final diagonals, which signal the exhaustion of the background trend and usually finish a 5-wave pattern: 3 driving stretches (1-3-5) and 2 corrective sections (2-4), therefore, appear in the position of wave 5.
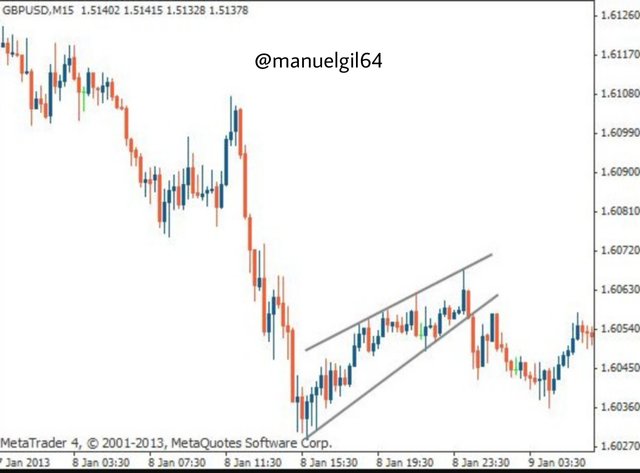
Also, for this type of pattern to take place on the chart, we need certain parameters to be met, so that the predictable result shows the contractile diagonal, whether it is uptrend or downtrend.
Within these parameters are: The specific dimensions that each wave must meet:
Wave 2 cannot invert the total of wave 1. That is, the retracement of this wave cannot enter the low of wave 1.
Wave 4 cannot reverse the total of wave 3. As in the previous point, wave 4 cannot enter the low of wave 3.
Wave 4 must enter the domain of wave 1. That is, the minimum of wave 4 crosses the maximum of wave 1, so there will be an overlap between the two.
Wave 3 must go beyond the end of wave 1.
Wave 3 cannot be the shortest of the motor waves (waves 1 - 3 - 5). It is essential that it is not the smallest of the three waves.
The diagonals must be touched by the corresponding points. Points 1 - 3 - 5 must be joined diagonally and points 2 - 4 must be joined.
Now, if the initial diagonal is the origin of a new trend structure, it is natural for us to ask ourselves what is the reason for this sharp fall that follows the diagonal.
The explanation is simple, suppose a bullish move has just ended, a market top is being traced and we are witnessing the origin of a low momentum. We must bear in mind that the bearish pattern appears just when a previous uptrend has just ended, which is why there is a change in the market.
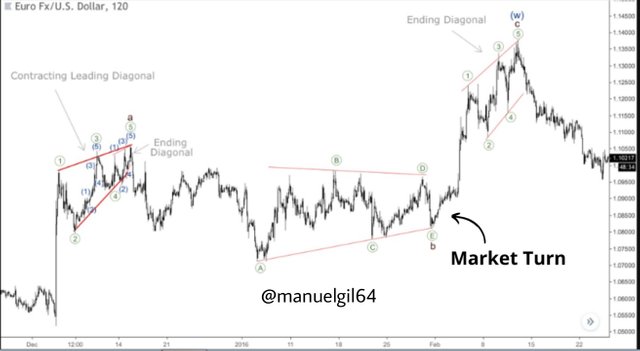
Therefore, when applying this type of diagonal waves it is important to study them since they allow to create a reversal pattern that occurs when the price is reaching highs and lows which are identified by a contraction range.
In this way, the price is limited to two lines that must converge to create such a pattern, which in turn indicates a slowdown and generally precedes a downward reversal (in case it was a bullish diagonal). So knowing how to identify them means you could search for potential sales leads.

Example of a Contractile Diagonal that meets the criteria of operability and an example of a Contractile Diagonal that does not meet the criteria
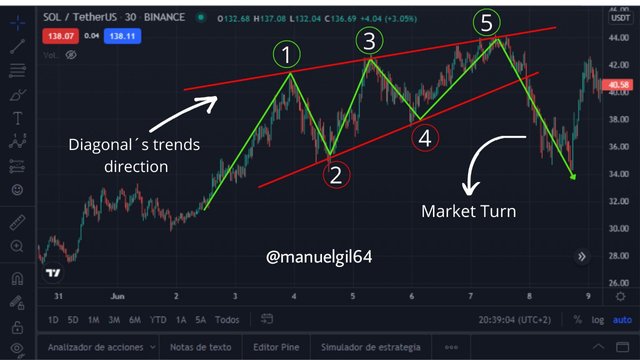
As a sample of a case where the operability criteria of a contractile diagonal are applied, we have the following example, where the pair in question that was executed was SOL-USDT. In which it is observed that it meets all the parameters established, both by the size of the waves in each case, and the inversion of the diagonal in trend in the market, so that in wave 5 goes down against the bullish prediction, as well as the two diagonals, that join the different points, are in a position soon convergent.
On the other hand, the following graph shows a contractile diagonal that does not meet all the criteria established to form the pattern.
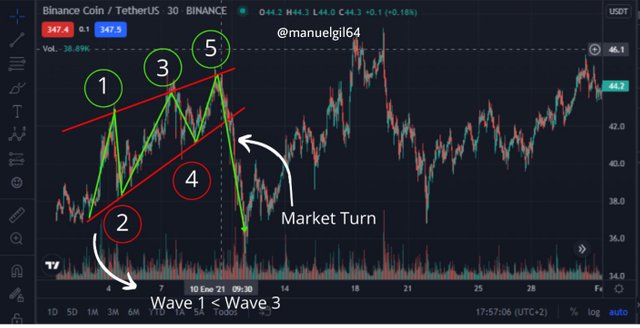
It is observed that in this case, with the pair BNB-USDT, both diagonals are going to converge, and like the previous case, subsequent to the trend diagonal there is a change in the market so it ends up having a bearish movement in wave 5.
However, it clearly states that in order to meet the criteria for operability certain rules must be followed, which include, for the most part, the dimensions of some waves with respect to others. Thus, wave 4 is less than wave 2, just as wave 5 is less than wave 3, however, wave 3 is greater than wave 1, which fails the first criterion.
So this contractile diagonal gives a favorable result by going against the trend, but does not apply the criteria properly.

Perform one real buy operation (15 USD minimum) through the Contractile Diagonal method
To start this requested operation, first enter the Binance exchange where I have a verified account.
Also to be able to carry out it it was necessary to carry out a search between different cryptocurrencies in order to observe the pattern of the method of the contractile diagonals, and in turn to comply with all the operational criteria that were described above.
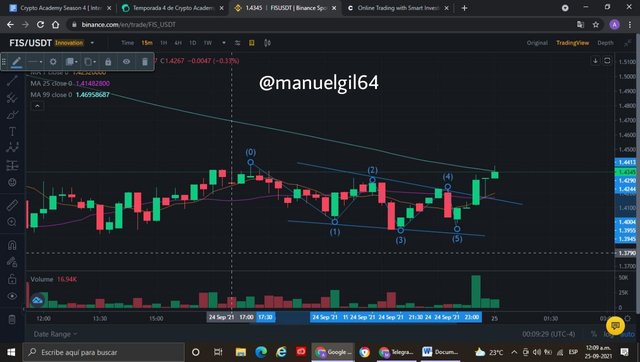
Thus, when finding the FIS-USDT pair, we can see that a zigzag of bearish wave trends is met as the market trend is observed in the main diagonal 1 - 3 - 5. In turn, the dimensions of each wave clearly correspond to the due size, as they are placed contractually, so that both the diagonal trend line and the diagonal joining points 2 - 4 may converge at some close point.
Now, once we confirm that all the necessary criteria are met, the analysis was carried out to verify that the purchase operation is successful, since having a bearish trend, the result to be obtained by means of this pattern will be that it breaks the barrier of the diagonals and makes an upward reversal.
That being said, the purchase transaction is carried out with an amount of $18.71 USDT, by predicting the inverted trend that is about to happen, under a 15-minute temporality margin.
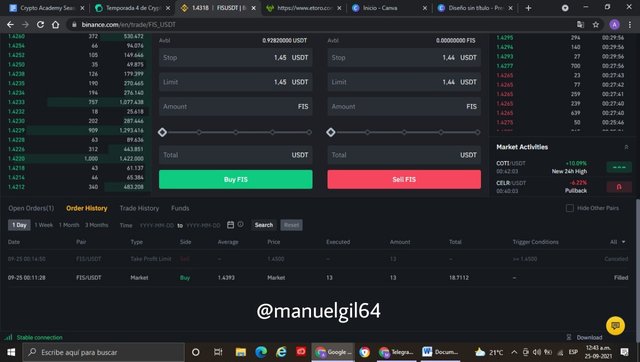
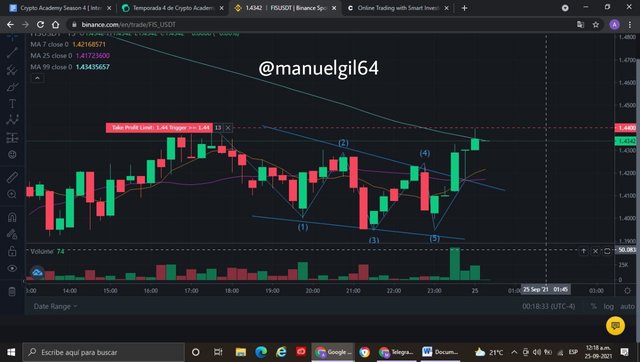
In this way, the following chart shows the purchase order made at a price of $1.4342 as a sure sign that an increase in the trend was expected.
The Take Profit command is also placed at a point near point 2, this being the highest point present in the contractile diagonal method. Thus, a beneficial position is projected as a result as the expected point of profit can be reached by increasing the price of cryptocurrency.

Perform one sell operation, through the Contractile Diagonal method
In this case, an analysis similar to the previous purchase was carried out to carry out the sales operation.
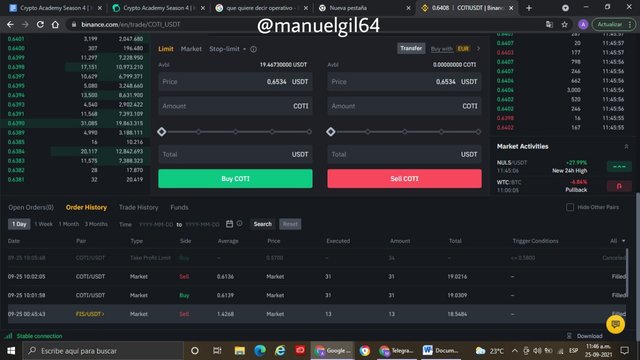
Naturally it was necessary to do a search among cryptocurrencies so that I could find a chart suitable to my needs, particularly a favorable position to sell. Thus, we found the pair COTI-USDT, which presents a chart of upward trend, therefore, by the method of Contractile Diagonals we expect the position to sell and the trend in the market is reversed, so that a satisfactory result is obtained as it is sold at a higher price in anticipation of the next trend decline.
In this way, a sale transaction in the amount of $19.02 USDT is carried out in this analysis, as shown below.
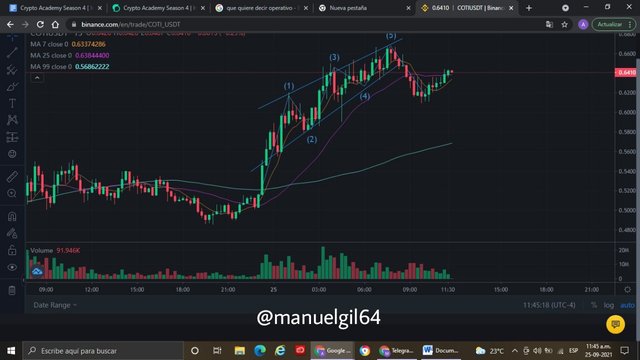
That said, by graphically analyzing it you can better understand how the pattern of the diagonals is formed and how they contract both lines, just as you can see how each wave has the necessary size to meet the requirements.
So the point of sale, at a price of $ 0.6196, is in a favorable position in view of the possible reversal of the trend in the market. Therefore, I place a Take Profit order at a point near the bottom of the pattern, which would be point 2, at a price of $0.5800.
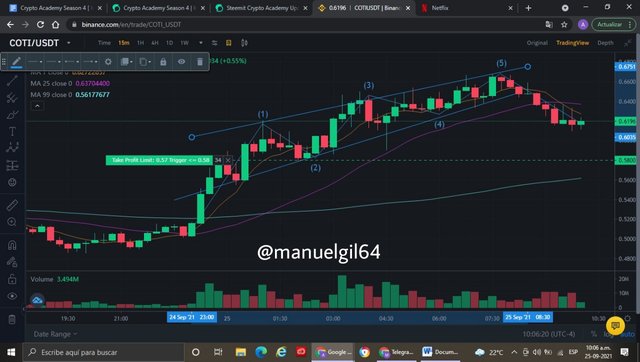
Thus, as more time has passed since the operation, it can be seen how the graph in question fulfilled the prediction thanks to the method of the contractile diagonals because it is observed that there was a fall in the price after breaking the barrier in wave 5.

Why not all contractile diagonals are operative from a practical point of view?
Now, we know that when we talk about something operational, we can immediately think about something that’s working and, in turn, does what it’s structured to do.
So when we talk about contractile diagonals, we know that it can work very well, just as it did in the previous questions. However, it is not completely acceptable for all cases where contractile diagonals are observed because that is where the important point of the risk criterion comes in.
We know that the risk when applying an operation can often be in our favor, however, when applying this technique it must be taken into account that enforcing a favorable risk-reward relationship will not always be simple, since it involves ignoring the known relationship 1:1 and instead choose to see and specifically denote the pattern that follows the chart in question.
For this reason, the following example is a positive effect, where it is observed that when placing the Take Profit and Stop Loss orders, you see a profit margin greater than the possible loss that could be given.
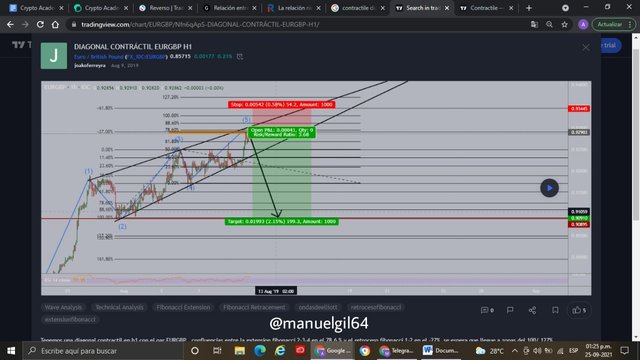
This can be detailed by looking at the percentage level that is applied according to the orders, where you can see that it will be a successful outcome. However, mainly for this reason I consider that it is not an operational indicator in its entirety since, in this example, a greater percentage difference could not be sought.
In addition, in a bad case for the operator, you can make either a purchase or sale that is in a good position according to the chart and still get percentage margins that play against. Therefore, visually it may seem that it meets the necessary criteria, but it does not ensure that an operation will be carried out where the risk is greater than the reward.

This is my Homework Post for Crypto Trading with Contractile Diagonals || Steemit Crypto Academy S4W3 || Professor @allbert


twitter-promotion
Downvoting a post can decrease pending rewards and make it less visible. Common reasons:
Submit
Congratulations, your post has been upvoted by @scilwa, which is a curating account for @R2cornell's Discord Community. We can also be found on our hive community & peakd as well as on my Discord Server
Felicitaciones, su publication ha sido votado por @scilwa. También puedo ser encontrado en nuestra comunidad de colmena y Peakd así como en mi servidor de discordia
Downvoting a post can decrease pending rewards and make it less visible. Common reasons:
Submit
Thank you!
Downvoting a post can decrease pending rewards and make it less visible. Common reasons:
Submit
Hello @manuelgil64 Thank you for participating in Steemit Crypto Academy season 4 week 3.
En ambas preguntas 3 y 4 faltó que definieras el stop loss y el take profit. Recuerda que el stop loss esta en línea con el punto 5 y el take profit con el punto 2.
De resto muy buen trabajo. Te felicito.Downvoting a post can decrease pending rewards and make it less visible. Common reasons:
Submit
Gracias Profesor @allbert por el feedback. Atenderé sus recomendaciones para las próximas asignaciones.
Downvoting a post can decrease pending rewards and make it less visible. Common reasons:
Submit