"Trading is not for the dabblers, the dreamers, or the desperate. It requires, above all, one steadfast trait of dedication. So if you are going to trade, trade like you mean it."
Rod Casilli

Image edited with PicsArt
Crypto Trading with Rate of Change (ROC) Indicator || Crypto Academy S4W8 || Homework Post for @kouba01

In your own words, give an explanation of the ROC indicator with an example of how to calculate its value?
The ROC is an oscillator which will serve as an indicator to carry out our technical analysis, since with this indicator we can understand the trends much better and obtain signals of overbought and oversold, crossover, and on the continuation of the current trend. With this we can have more information on whether a possible change in the direction of the trend is projected or if it has sufficient strength to guarantee its continuation.
In my opinion, the ROC indicator seems a bit analogous to the Chaikin Money Flow indicator that we have seen in past classes, since it oscillates between the value of 0, and we could see some similarities taking advantage of the fact that we are already familiar with a similar tool. However, you have to understand the mathematical context and how each particular indicator is calculated, for example the Chaikin Money Flow (CMF), it is calculated from the closings in the volume - prices relationship for a given period, however, the ROC indicator is based on the relationship of the current price and the price it had a certain period ago.
Basically the formula consists, as the teacher mentioned in the post, in subtracting from the current price (Pa), the price of n periods ago (Pn), then dividing this result by the price of n periods ago (Pn), and finally multiply it by 100, since this is a percentage indicator.
ROC = (Pa - Pn) / Pn* 100
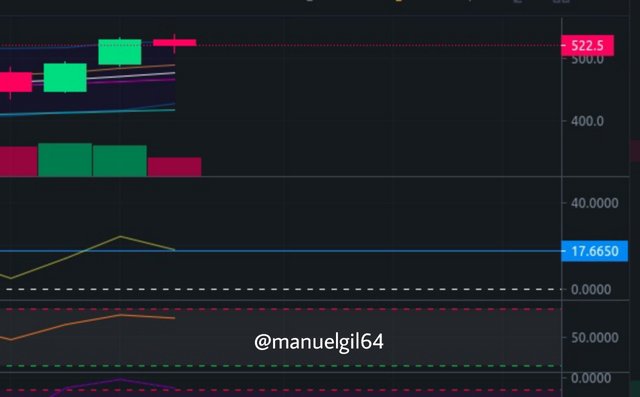
We will calculate the ROC for BNB - USDT in 25 previous periods in 1-day candles (we choose this number because it is convenient when we want to have a more analysis in the medium or long term).
Let n = 25, the current price is 522.5 USDT, that is: Pa = 522.5 and the price in the period Pn = P25 = 444.131.8 USDT.
Then,
ROC = (522.5 - 444.131) / 444.131 * 100 = 17.6454

Demonstrate how to add the indicator to the chart on a platform other than the tradingview, highlighting how to modify the settings of the period
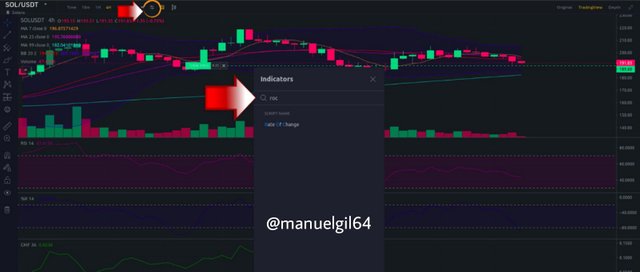
We go to the indicator option in Binance and write the word “ROC” in the input to add the indicator.
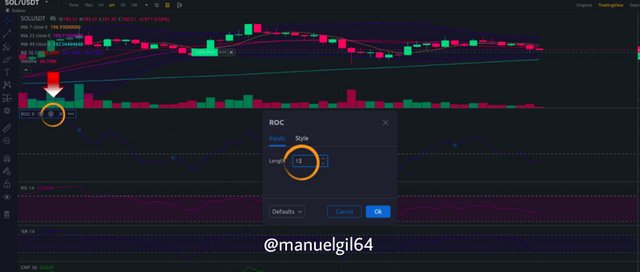
Then in the settings part we can change the styles and the configuration of periods. In this case I will use the configuration of 12 periods since, as the professor mentioned in the post, it is the ideal one for when it comes to performing a short-term analysis, while 25 is more when looking for a medium or long-term approach. term.

What is the ROC trend confirmation strategy? And what are the signals that detect a trend reversal?
As we well know, this indicator is based on the price range, so it will measure the rate at which the price will change in a given time and thus compare these values to see if they are above, if it is a case of an uptrend , or below the zero center line, in the case of a bear market, so that a growing market clears.
That said, this type of indicator allows us to have as a trading strategy to observe the change in momentum as it helps to anticipate the decisive moments to choose the exact reversal point, since when we refer to momentum we are talking about the trend that is maintained in time, while in a variant market the momentum is irregular and yes the trends begin to lose pressure and it is time to act and create orders according to the reversal to be made. Thus, once crosses are observed in the central line, the corresponding action must be decided as this technique indicates that an inverse trend is created, so that it offers us a clear anticipation based on the positives and negatives, such as I said earlier, positive values indicate an upward trend, so we get an immediate buy signal, while negative values warn us that a downtrend is coming and should be interpreted as a sell signal.
Likewise, it is clear that this indicator is ideal to show the reversal of the trend and can be obtained precisely when capturing the divergence between the opposition of the ROC value and the price, since it shows us the market flexion but this is you will see later.
Finally, as an essential data it is known that the momentum will show us the prevailing pressure, so we will be able to know the highest point that the indicator will reach as well as the lowest, knowing the weaknesses or increases that are presented in the market.
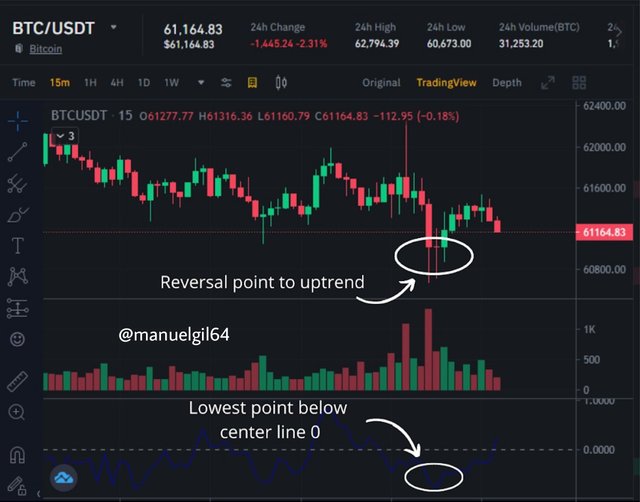
On the other hand, these changes in trend can occur as soon as a period has elapsed, however a consolidated increase will indicate a more accurate confirmation of trend change and vice versa, as well as breakouts since they allow us to visualize the actions that occur with high pressures.
However, the variability that a cryptocurrency can have at the time of operating must be taken into account as well as the time chosen as the professor mentioned in his introduction to the subject, as this helps us to reduce the false signals that may occur in the changes around the zero line.

What is the indicator’s role in determining buy and sell decicions and identifying signals of overbought and oversold?
At the time of making the decision to carry out any operation, we know that these indicators are a fundamental help, so the role of the ROC tool allows us to identify at a good moment the exact point where the market is weak or strong. Therefore, when looking for buy and sell signals, we must focus on what this indicator shows around the central zero line, because if the value shown after a cross is greater than zero we must assume that the active crypto market is about to increase as your momentum is strong. Whereas if the crossing that is made is towards a negative value, the trend that will take place will be downward.
It is essential to know the ideal way to operate with lateral markets, as indicated by the professor, since these prevent us from carrying out an action if a current trend is not present because the exact moment will not always be found when a trend begins or ends.
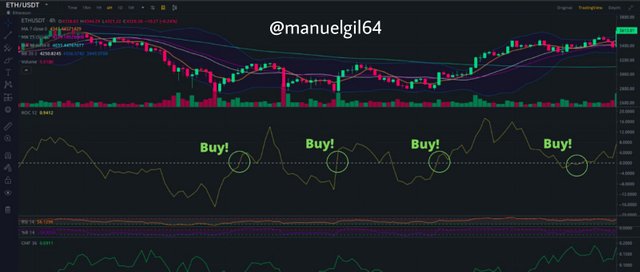
That said, we can capture as buy and sell signals the activation of the ROC prediction since, as we have defined, its central line indicates the decisions we can make. Thus, the increase in this central line warns us of a buy signal before the market is in an uptrend, so that profits would be obtained when the operation is carried out, as can be seen in the signal that was presented in the next picture.
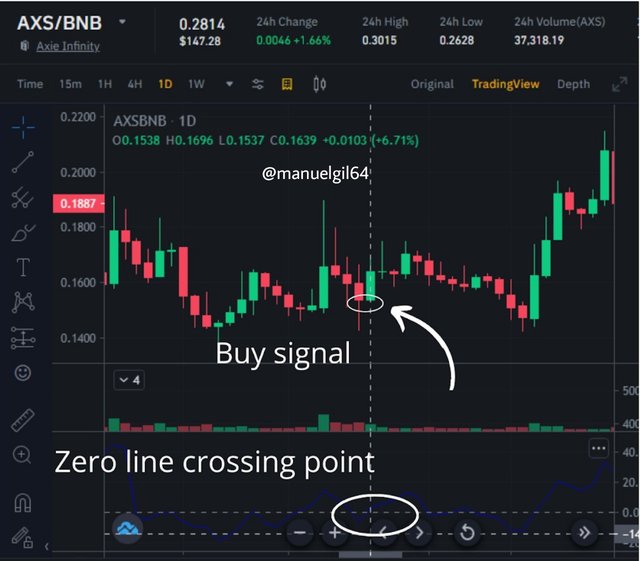
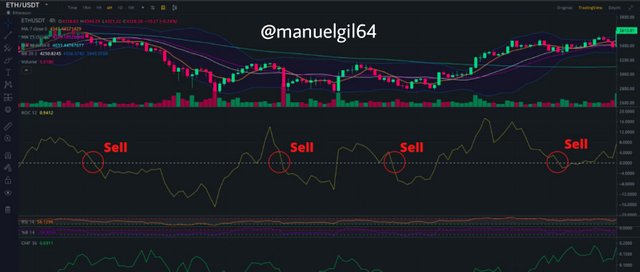
On the other hand, the sell signal can be obtained in the opposite case, once a negative value is shown in the central line, the indicator tells us that a downtrend is approaching, so it would benefit us to sell at that time and thus obtain Profits. Whereas, if we observe that the ROC value rises its value, it indicates that the current trend may come to an end.
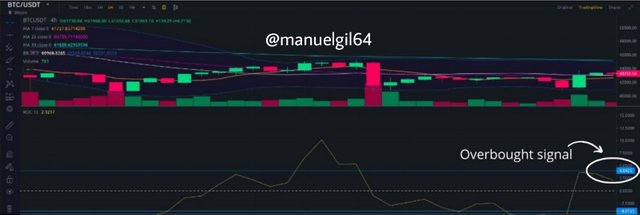
In the same way, many traders often use this indicator to measure and interpret the overbought and oversold points, which are the highest and lowest levels reached by the indicator. Although these are not fixedly identified in the technical tool, they are found within each crypto when creating its extreme values, which are known by locating them in past periods where the ROC showed its maximum level before the trend reversal.
This in turn makes the ROC indicator one of the favorites to operate as it does not have overbought and oversold limits, which is why the level is obtained by comparing previous periods.
Thus, these signals will help us to more easily decide the levels at which the trend can be reversed and in this way each operator will be aware of the limit point, so as to avoid false signals or confirm the ROC indications to operate. , as appropriate. However, in my opinion, I consider that other indicators that present the same overbought and oversold levels, such as the RSI, can be used if the main objective is to trade based on these levels.
Finally, these levels are observed in the graph presented by the indicator so that the overbought value will be the one where the maximum price goes down and the oversold point will be where the minimum value goes up.


How to trade with divergence between the ROC and the price line? Does this trading strategy produce false signals?
As we have seen in previous cases, the divergence in indicators is shown as the graphic difference between the point where the price is with respect to the point where it is in the indicator, so that it acts as an oscillator and they are positioned in opposite directions.
Thus, these signals indicate the deviation that occurs in the market together with the values shown by the indicator, so that we can see if the predictions that we anticipate as operators are correct.
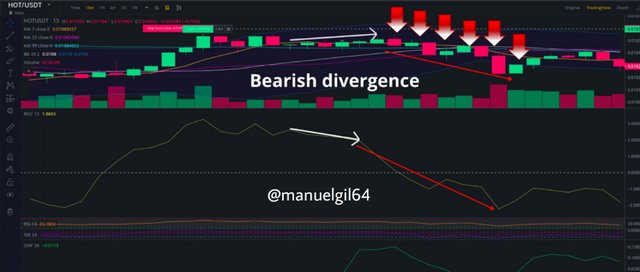
Below is a bearish divergence for the currency pair Holochain - USDT (HOT - USDT)
Now, the creation of divergences in the price movement can indicate possible positive or negative values, although it should not be taken as absolute signals since no indicator has infallible accuracy, so it is always advisable for any responsible trader to act with caution in addition to using multiple technical tools that allow a more accurate understanding of the market scenario.
It is important to know that this type of indicator can provide early signals which causes an inaccurate indication since the price can remain in the similar line for a period, so it should be used as a helper to confirm actions that we have previously analyzed.
However, we must not forget the good information that these divergences in the ROC provide us, since many times they allow us to have precise previous signals so that we confirm the next commercial action that we are going to do, whether it is a purchase or sale, as appropriate. Thus, if there is an upward divergence, we must know that the asset price will be creating low minimum values while the ROC indicator will create increasing minimum points, which will mean that the current (downward) trend loses momentum and possibly a uptrend reversal.
It also happens in the case of upward trends that have commercial divergences, prices and values will go in different directions and due to the lack of strength, the reversal is generated and causes a downward trend.
In this way, this type of indicator is critical when acting with changes in directions and trends thanks to the fact that they are directly influenced by the market situation so that operators can foresee the approach we should have when seeing the present momentum, which is supported by the divergences that are generated since they are very easy to interpret and identify and at the same time allow us to know and confirm the change that is approaching.
Therefore, we know well that if there is a bearish divergence, it is recommended to sell because prices have reached their highest point and the ROC has reached the lowest point, while with bullish divergences we can anticipate the exact moment to buy below it. applied logic.

How to Identify and Confirm Breakouts using ROC indicator?
Today there was a breakout with the Chiliz (CHZ) cryptocurrency, where after lateralizing in a price around 0.33 to 0.35 USDT, it broke and reached 0.4225 USDT.
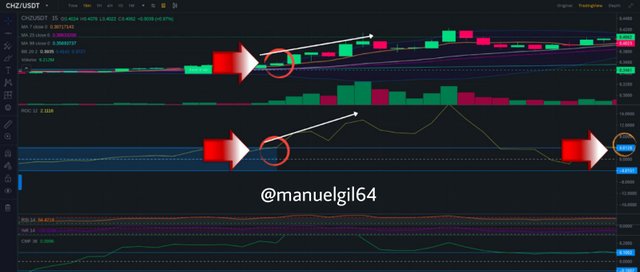
As the professor explains in his post, the price of CHZ is in a lateralization, where the price begins to oscillate between the zero line (rising and falling, but without giving signs of a strong rise or fall), just when the price seems to break the 7-day MA, the oscillator reaches 4%, however then it falls and rises strongly, surpassing the price of CHZ. We can also observe the increase in volume in line with the price and the ROC indicator.
After a period that seems to consolidate the price, we can expect after a strong rise in the ROC indicator, that the asset price will begin to behave in line with the indicator as a confirmation signal. In addition, we can rely on other indicators which will complement the signal or also the use of resistance or supports provided by the moving averages which are supposed to be interesting points at the time of trading.
This is for a case of a bullish breakout, we could use the analogous case for a bearish breakout, where for a period of lateralization or consolidation of the price, it can break down, then we would expect the ROC indicator to fall sharply, and the price by behaving in the same way, it could give us the signal of the breakout down.

Review the chart of any crypto pair and present the various signals giving by ROC trading strategy
We are going to analyze the chart of the Ethereum - USDT (ETH - USDT) pair. First we are going to observe buy signals just when the indicator crosses from negative to positive values. As they are marked in the following graph:
Now for the sell signals, it is just when the indicator crosses from positive values to negative value. As will be shown in the same graph:
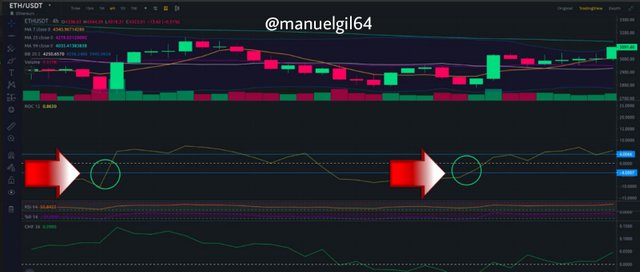
However, as the professor mentioned in the post, when the indicator rises above 4% it means that it enters an overbought zone, and when it falls below -4%, it is an oversold zone. One can interpret signals in the following way: For this first chart, when the indicator leaves the oversold zone, it indicates a buy signal.
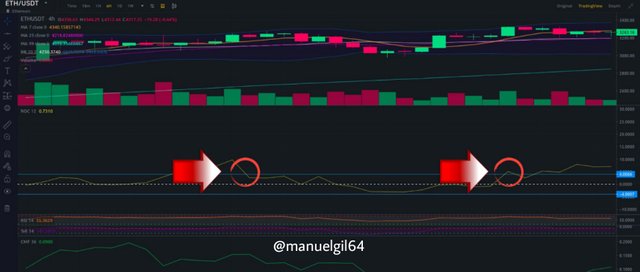
Now, for the other case, when, as can be seen in this other graph, when the indicator leaves the overbought zone, it is a sell signal.

Conclusions
As we have seen throughout this task, the ROC indicator is very easy to interpret in addition to being useful in many ways as it allows us to anticipate changes in trends, either from bullish to bearish or vice versa, through points far away and close to the zero line.
Likewise, it helps us to take the trading signals as well as the conditions of maximum overbought and oversold levels and the divergences that may occur, which can generate at the same time a combination between the ROC with the momentum and thus calculate the exact point to operate and foresee the change of direction.
On the other hand, the operators who are going to use this indicator need to be aware of the general trends in the prices of crypto assets because this tool focuses on confirming the decisions that we are going to make since, as I said before, it can indicate outdated points or either indicate values quickly around the center line as the price consolidates and during that period of time it can generate false signals for immediate operations. Therefore, it is advisable to mix and match different indicators together with the ROC, which generate favorable signals and, in turn, confirm the anticipated signals.

This is my Homework Post for Crypto Trading with Rate of Change (ROC) Indicator || Crypto Academy S4W8 || Professor @kouba01


That's really one truth I noticed when using ROC. I have really learnt a lot. Thanks @kouba01.
Downvoting a post can decrease pending rewards and make it less visible. Common reasons:
Submit
Hi @manuelgil64
Thanks for participating in the Steemit Crypto Academy
Feedback
Total| 8.5/10
This is good work. Thanks for demonstrating such a clear and well detailed understanding of trading using Rate of Change indicator.
Downvoting a post can decrease pending rewards and make it less visible. Common reasons:
Submit
Thanks!
Downvoting a post can decrease pending rewards and make it less visible. Common reasons:
Submit