Machine Learning Applied on Forex
In this article we will see how to apply machine learning algorithms on the forex market. We all know that the market is quite random but still it may behave the same way in the same conditions and yet we are just talking about the probability that it will behave the same way.
Classification:
The process of the classification is to find relevant patterns on the market and then try to figure out if the next bar will be a significant Bearish candle, a significant Bullish candle or a small one, the first step is to load Historical Market data then clean, transform and feed the training data, then we will calculate the X that will represent a set of data that will correspond to a Y (the next candle class).
Data Loading:
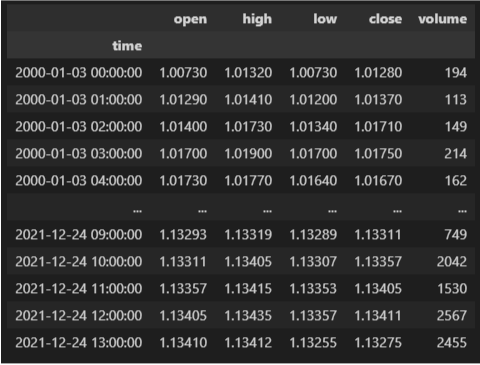
We will use OHLC V data of EURUSD based on a 1 hour timeframe, we can either download the data from a csv file or get this data directly from Metatrader 5.
Data Transformation:
Now that we have loaded the raw data each row consists on a candle in the chart, the first step is to identify the class of each candle, there is multiple way to classify candle but first we need to calculate the size of the candle that represents the difference between the Close price and the Open price:
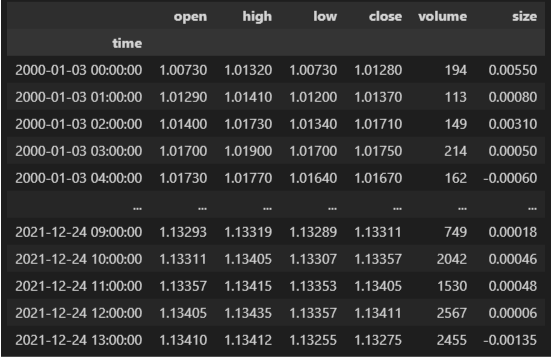
We can now classify or candles let’s describe the different ways to classify them:
Two Classes Candles:
- Bullish if size > 0
- Bearish if size < 0
Three Classes Candles:
- Significant Bullish if size > 0.0005
- Significant Bearish if size < -0.0005
- Insignificant if -0.0005 < size < 0.0005
I prefer the Three Classes Candles to remove noises the value 0.0005 represents in this case 5pips or 50points and can be modified. It's up to you to choose a prefered value for each timeframe and symbol.
we will feed the dataset with a new column called Cat the will contains the candle classification:
- 0: Significant Bullish
- 1: Significant Bearish
- 2: Insignificant
we can feed the data set by other indicators (Moving Average, RSI, Stochastics …)
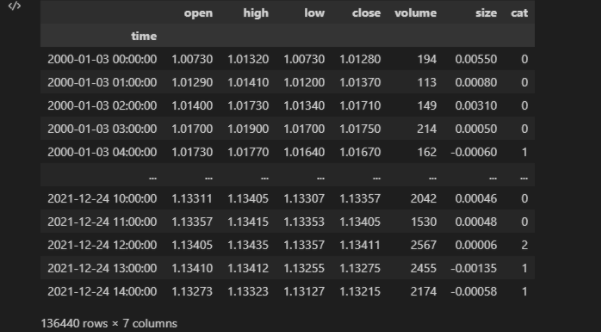
Let’s see the repartition of the classification on the records:

Windowing Data:
This step consists of mapping a set of historical data to the next candle classe we will build a list of previous data that will be the X and map it to our next Candle that will be the Y.
Let's pretend we will map the 3 previous market data to describe our current candle.
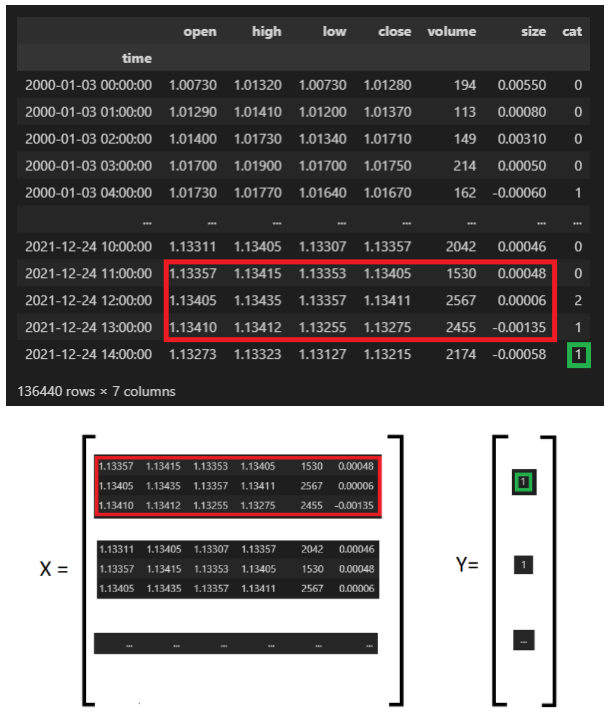
To understand this part we can assume we are classifying images where the X is the list of images and Y is the category of the images.
The hard work is done we can then split this data into train and test the run the classification model on different cases, but we can do better:
add more indicators
increase the historical data ex: 24 previous candles
Scaling Data
The previous data will be hard to detect patterns as we use market prices to make it better in detecting patterns. All we need is to scale each column to [0,1] to transform the data from prices to patterns.
So if the Open prices is [ 1, 5 , 10 , 0] it will be scaled to [0.1, 0.5, 1, 0]
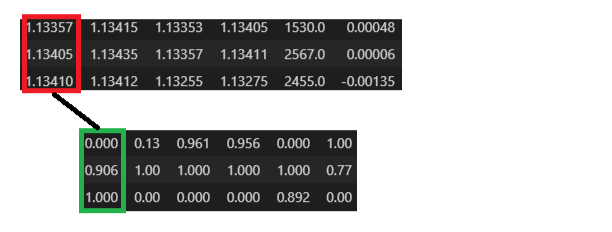
Note that not all features need to be scaled if we add an RSI indicator for example we need to scale it globally and not for each window.
now we can apply the classification model on this data.
Github Repository
You can refer to for the whole code.
https://github.com/Mrn4Ever/ml_classification_forex