THE MACD INDICATOR
In cryptocurrency trading, it is important that traders be able to predict the the behavior or trends of the articular market they intend to put their money into .
Even though the fact remains that the cryptocurrency market is volatile, there are still ways to forecast the behaviors of a particular market ; at least to a certain degree, and this can be done technically, fundamentally, or sentimentally.Technical analysis is the kind of analysis that uses the historical data of the market performance of an asset to predict its future behavior and this is done by the use of some special indicators.
Indicators are tools available on cryptocurrency exchanges which tries to summarize the historical behaviors of that coin and use the information that has been analysed to forecast the market behavior based on those past data.
Examples of indicators are RSI, MACD , etc.
WHAT IS THE MACD INDICATOR?
MACD is an acronym for "moving average convergence divergence " and it is made up of two lines, the MACD line and the signal line, and it displays a histogram either below ( bearish trend) or above (bullish trend), the zero line.
HOW GOOD AN INDICATOR IS THE MACD?
The MACD inficator is a momentum indicator and it tells us how strong a bullish or bearish trend is or is going to be. This indicator is primarily built on the convergence and divergence of the MACD line and its signal line.
So if a trader wants to verify how strong a bearish or bullish trend is going to be so as to sell for the best price or to know when best to sell to avoid great loses and to know the best time to buy more coins.
I DON'T HAVE MACD AS AN INDICATOR, HOW CAN I ADD IT?
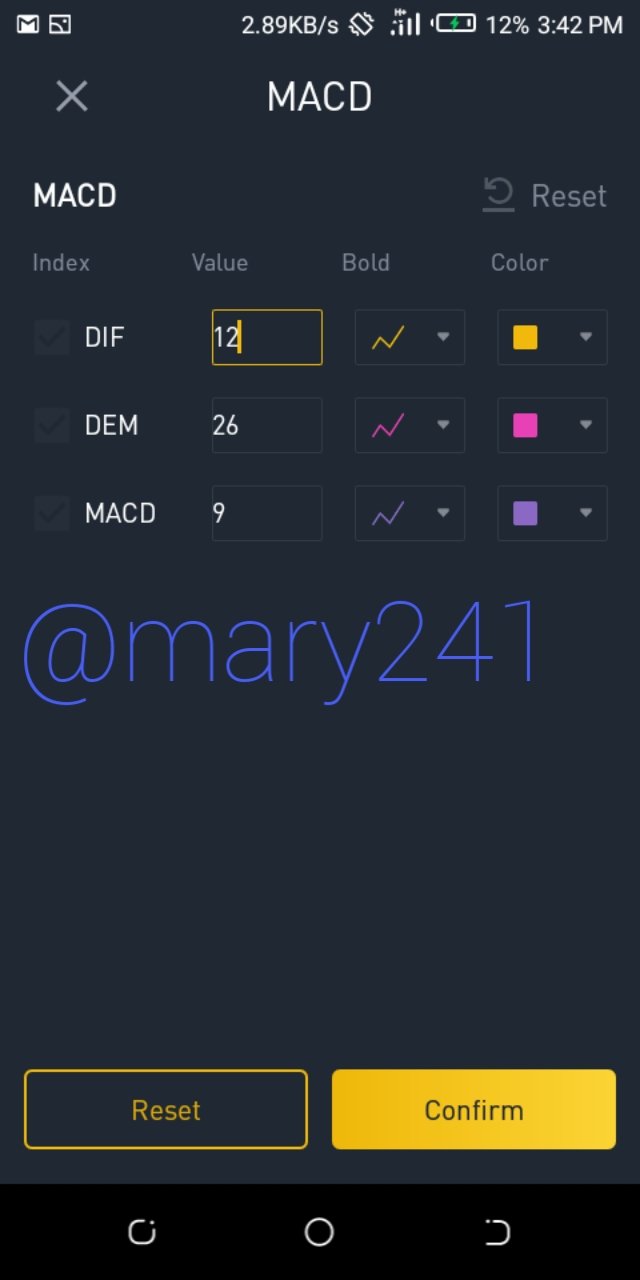
To add the MACD indicator on Binance, follow the steps below.
1 Download the binance App from your App store or use the online version .
2 Go to"market " and select a coin pair of your choice( BTC/ USDT in this case) and click on the llittle settings icon at the top right hand corner of the cAndle chart.
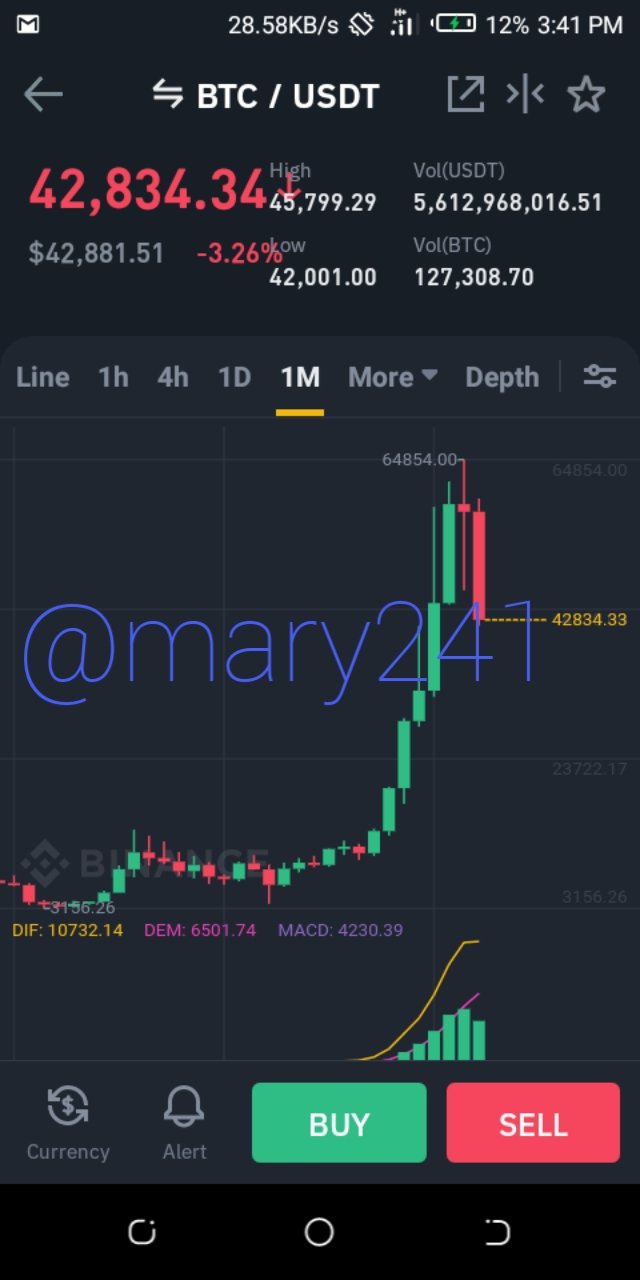
3 click on "settings " .
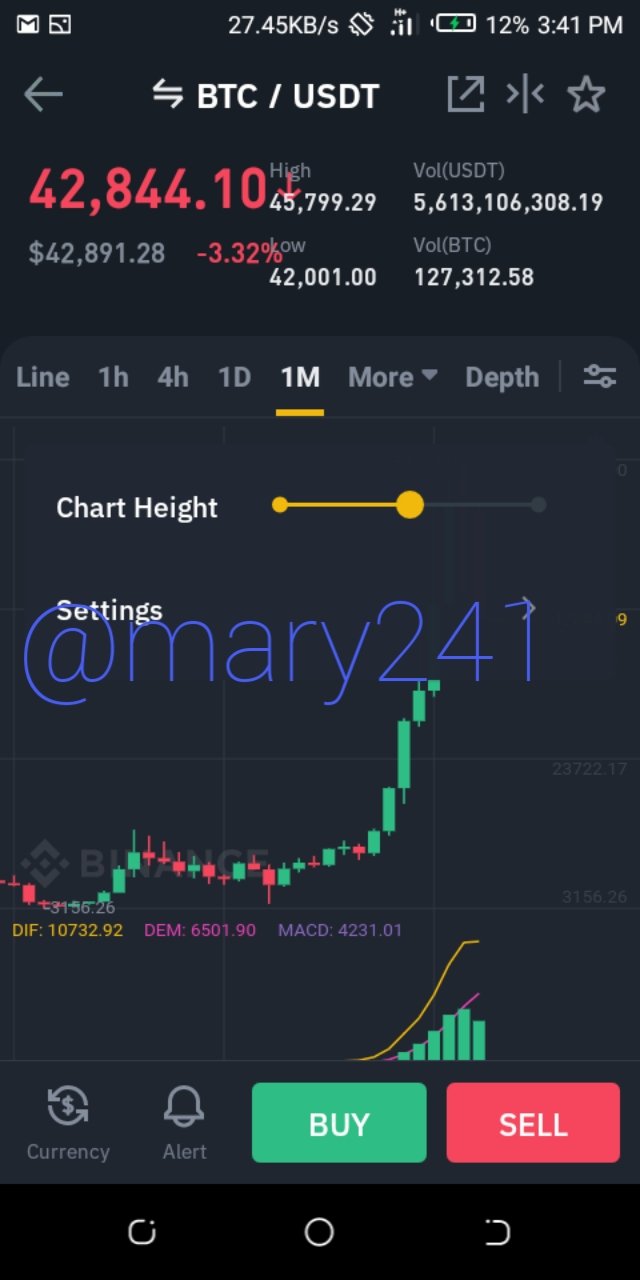
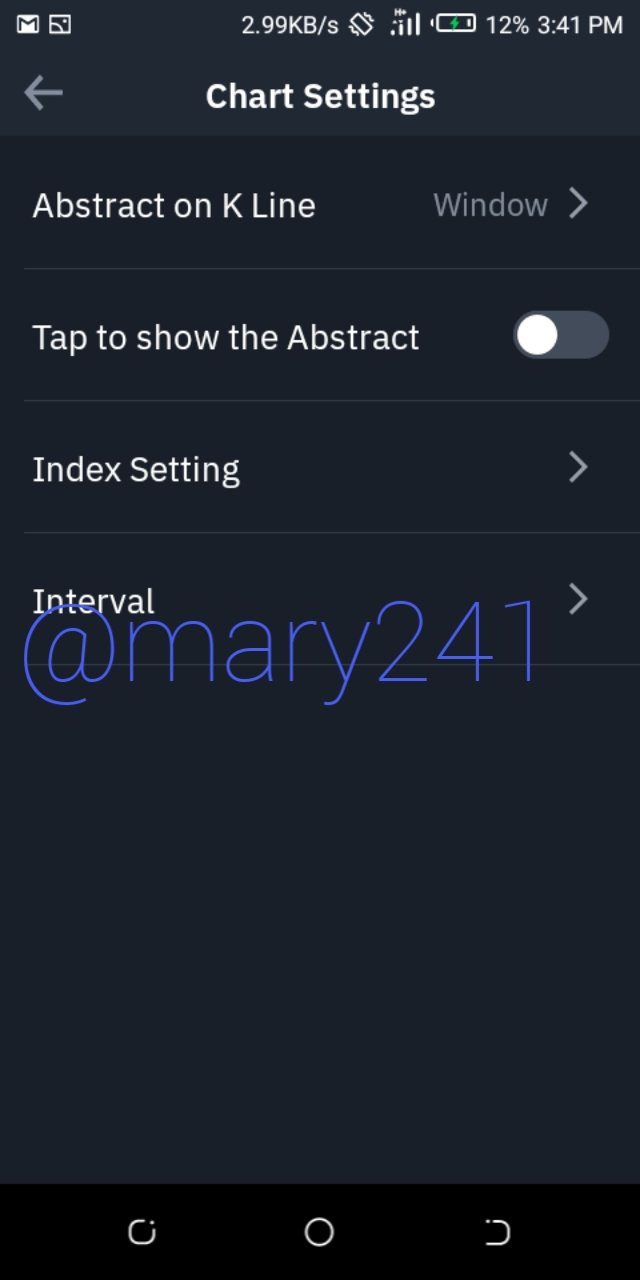
4 click on index settings
5 select MACD
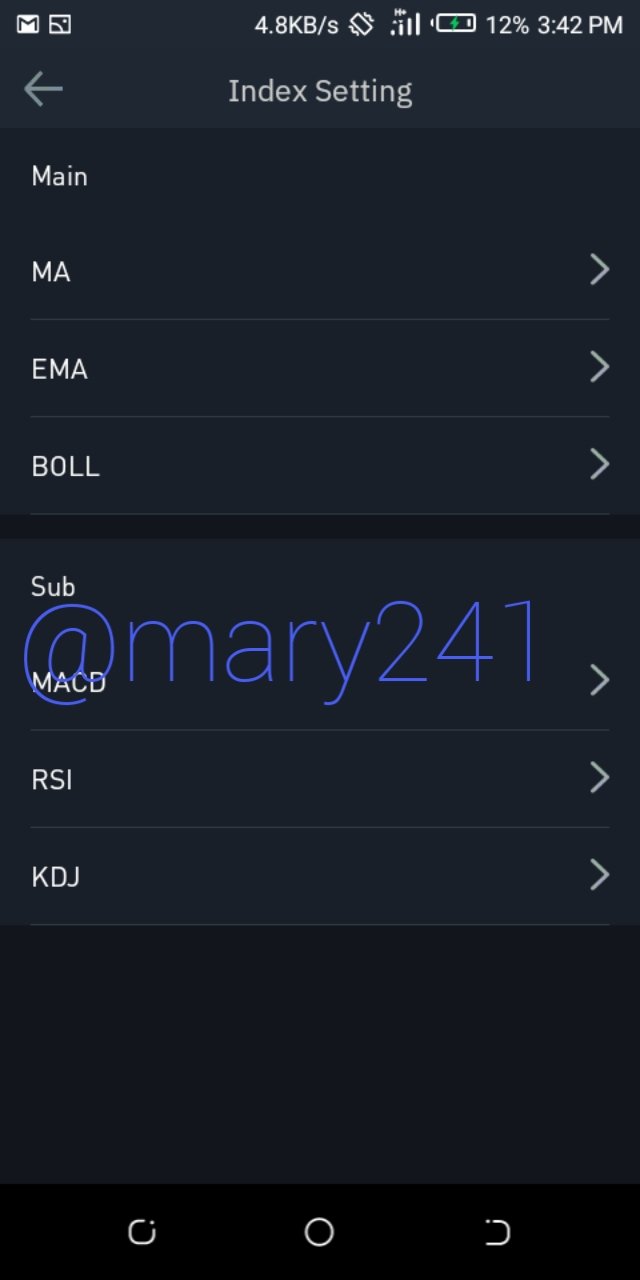
6 Adjust to the limits of your choice and click on confirm.
MACD OR RSI, WHICH IS BETTER?
Both indicators measure the momentum of a cryptocurrency market and are good in trend determination but they read different factors.
The RSI reads for overbought and oversold signals and how these factors affect the price of a cryptocurrency asset but the MACD reads for convergencies between the signal line ; an exponential moving average (EMA), and the MACD line ( another EMA) , and it uses these moving averages and a histogram to give more insight into the market.
The both of them are usually combined by professionals to give a very qualitative technical analysis , but if I am asked to choose one, I would go with the MACD indicator .
CROSSOVER MACD LINE
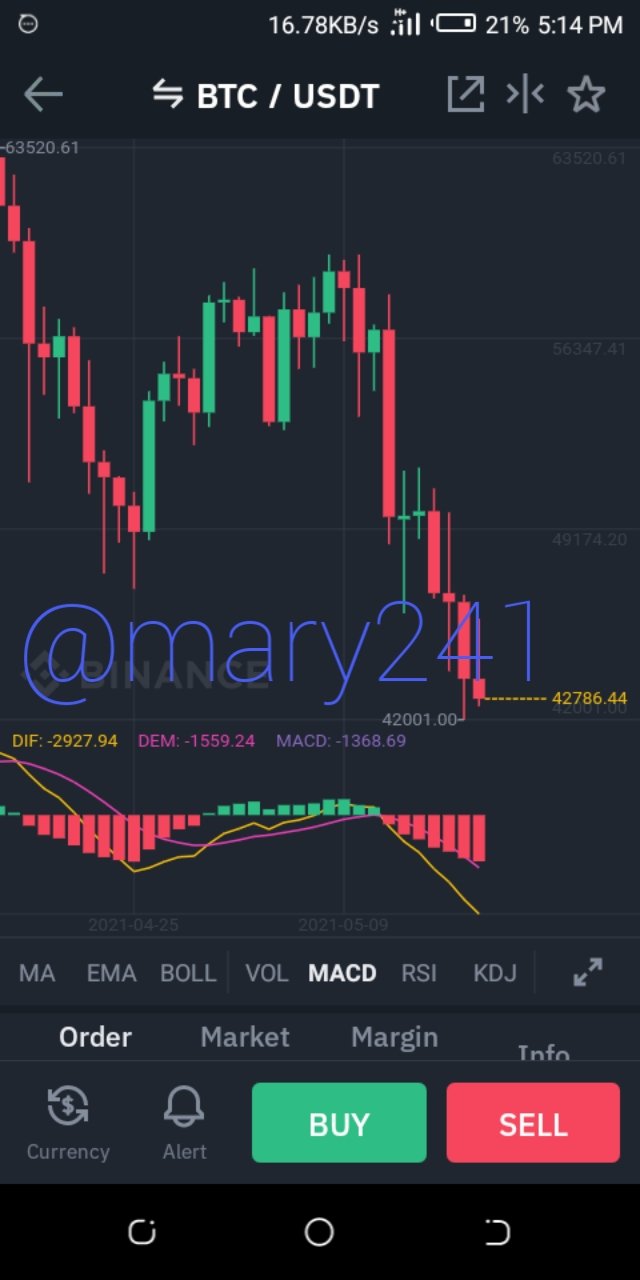
Thus is the unique feature of the MACD indicator. Whenever the main MACD line cuts the signal line(purple) and goes above it, it indicates a bullish trend and a histogram( green in colour) showing the strength of this bullish trend is indicated above the zero line and this gives the trader an insight into when best to enter the market as a bullish trend is Imminent
On the other hand, if the main MACD line( the yellow line) falls below the signal line, a historgam( in red colour) is shown below the Zero line and the height of the histogram corresponds to the momentum of the bearish trend and this indication tells the trader how serious the bearish trend is likely to be, and so , the trader know whether to sell to avoid great Loss or to not panic ( if the bearish trend is not serious , from the histogram reading).
Below is a screenshot showing the above description.
HOW TO DETECT A TREND USING THE MACD INDICATOR AND HOW TO FILTER OUT FALSE SIGNALS.
Whenever the MACD Line goes bellow the signal line twice; successively, and the later crossover is not bellow the first crossovers a point where the yellow line cuts the signal line) , it means that there is going to be bullish trend soonest.
Also, when the MACD line makes two successive highs( when it cuts the signal line and goes above it) and the first high is greater than the second high, it indicates a bearish trend coming up soonest.
HOW CAN THE MACD BE USED TO FILTER FALSE SIGNALS?
False signals can be filtered using the support lines. So if a support line is drawn at both the bullish and bearish trends, any signals above the bullish support or mellow the bearish support is a false signal.
HOW CAN THE MACD BE USED FOR FOR EXTRACTION OF SUPPORT AND RESISTANCE LEVELS?
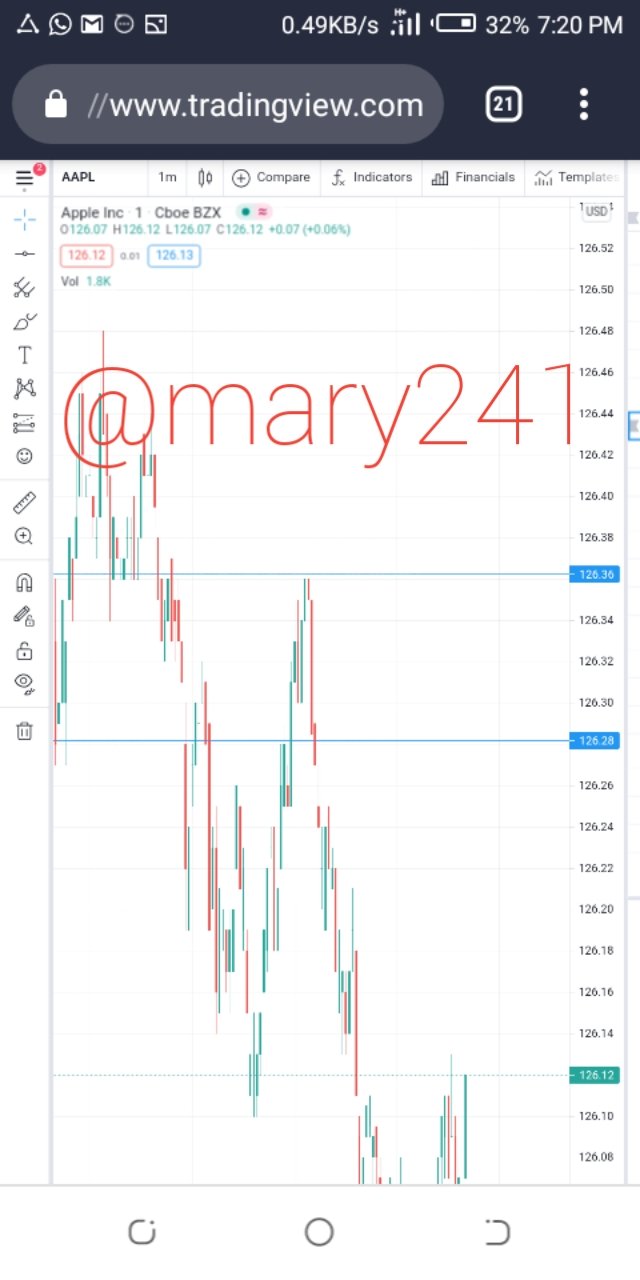
The support line is the low point of a downtrend and the resistance is thee high point of a downtrend . After the drawing of the support and resistance lines on an APPLE INC.
( using tradeview) it can be seen that the price was within the range of $126.28 and $126.36 , and a good analysis using the MACD indicator is needed so all that is left is to wait for a crossover to ensure a wise entry or when to sell .
THE VARIOUS SIGNALS FROM THE BTC/ USDT PAIR
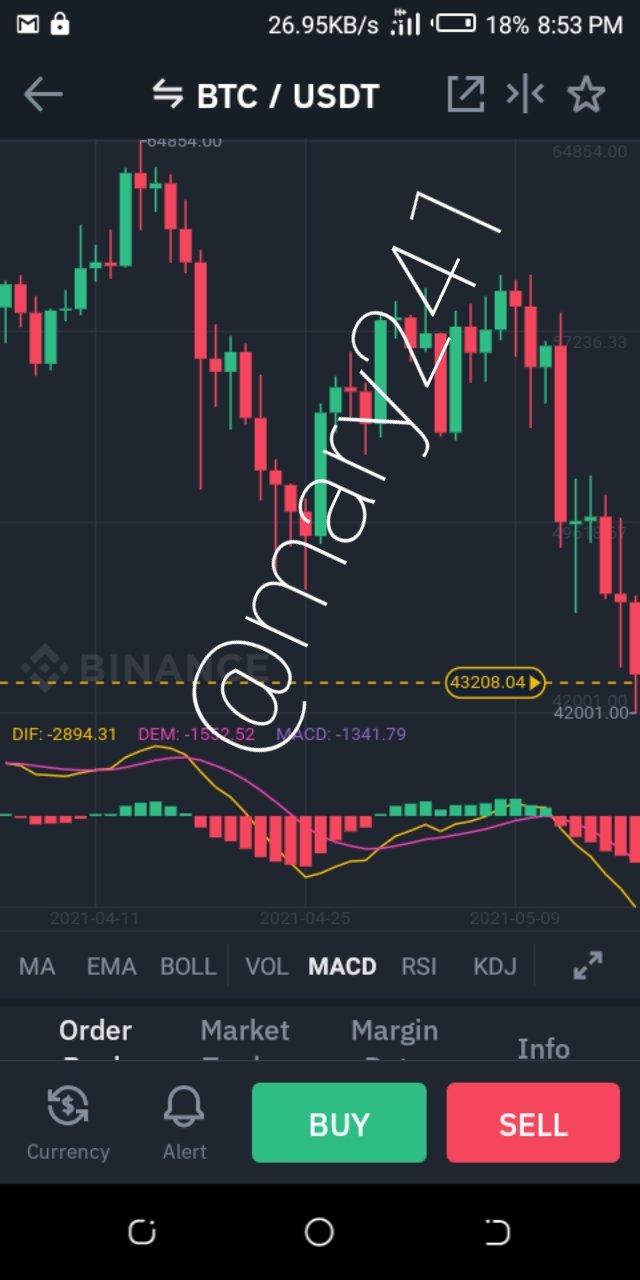
A careful observation of the successive peaks of the MACD line above the point of crossover ; from a higher to a lower high, was dollowed by a bearish trend as indicated in my above explanation, and from the histogram in can be seen that the bearish momentum is quite high.
So if I were holding this coin, i won't panic, all I will do is to wait for a second downward crossover and a bullish trend will follow.
Hi @mary241
Thanks for your participation in the Steemit Crypto Academy
Feedback
This is just average work done. Kindly put more effort into your work.
Homework task
5
Downvoting a post can decrease pending rewards and make it less visible. Common reasons:
Submit