Explain Your Understanding of Moving Average.
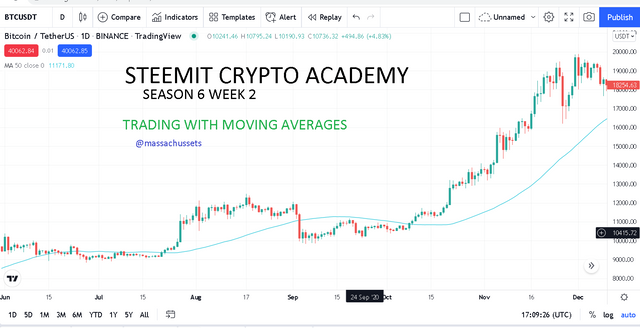
In crypto trading, technical analysis remains one of the strongest weapons available to the trader. There are a variety of technical indicators in the world that traders use during technical analysis. All the technical indicators are built on different ideas and metrics. MOVING AVERAGE is a type of technical indicator used by traders around the world. The moving average indicator is classified as a lagging indicator because it uses past prices to act. Moving averages are used to identify the direction or trend direction of a particular crypto asset. It is also use to know the resistance and support levels in the market. As the name suggest moving average calculates the average prices of an asset over certain periods and this creates a smooth price data which fiters out noise in the market. Moving average is an indicator that can be configured to any timeframe you want. The nature of a moving average gives clue to the market situation at a time. A rising moving average means the market is in a bullish run or uptrend whereas a falling moving average means the market is in a bearish trend or downtrend. On the chart the moving average is represented by a line that moves and changes as time moves.

What Are The Different Types of Moving Average? Differentiate Between Them.
Moving average has different types and this is based on how or the method used in its calculation. These types are;
- Simple moving average (SMA)
- Exponential Moving Average (EMA)
- Weighted Moving Average (WMA)
- Smoothed Moving Average (SMMA)
SIMPLE MOVING AVERAGE (SMA)
This is a type of moving average that is able to smooth out the market volatility of the asset and making it very easy to spot the trend of an asset. The simple moving average is the simplest amongst all moving averages and it can be used for different timeframes. It is calculated using the formula below;
SMA=nA1+A2+...+An
where:
An=the price of an asset at period n
n=the number of total periods..
EXPONENTIAL MOVING AVERAGE
This is a type of moving average that puts more value or weight to the most recent prices changes in its calculations. It is also used to identify the current trend of a market and also predict future price movements. It works best for traders who are short term traders. The calculation of exponential moving average is a bit complex. The formula is given as;
EMAt=[Vt×(1+ds)]+EMAy×[1−(1+ds)]
where:
EMAt=EMA today
Vt=Value today
EMAy=EMA yesterday
s=Smoothing
d=Number of days
WEIGHTED MOVING AVERAGE
This is a moving average that gives the most importance recent data points.
The weighted average is calculated by multiplying the price by its assigned weight factor and summing the values. The formula for the WMA is as follows:
WMA = P1n +P2 (n-1)+….Pn all divided by (n*(n+1))/2
Where:
n = time period
p =price
DIFFERENCES BETWEEN SIMPLE MOVING AVERAGE, EXPONENTIAL MOVING AVERAGE AND WEIGHTED MOVING AVERGE
| SIMPLE MOVING AVERAGE | EXPONENTIAL MOVING AVERAGE | WEIGHTED MOVING AVERAGE |
|---|---|---|
| The Simple Moving Average (SMA) indicator shows the average price of a given time period. | EMA assigns importance to the price of the current time than the previous price data. | WMA also gives more importance to current prices dat than the previous price data. |
| Comparatively SMA is the slowest amongst the 3 | EMA is faster than SMA | WMA reacts faster than SMA. |
| SMA works best for long term trades | EMA works best for short term trades | WMA suits any timeframe. |

Identify Entry and Exit Points Using Moving Average. (Demonstrate with Screenshots)
One of the advantages of using the Moving average is that it is able help traders or investor spot out good entry and exit points. Having discussed the various types of moving averages above.
ENTRY POINT
In finding the entry point I will be combining all 3 of them in order to avoid false signals. I will use a 30 day SMA, a 30 day WMA and a 30 day EMA to the chart of SOLUSDT pair.
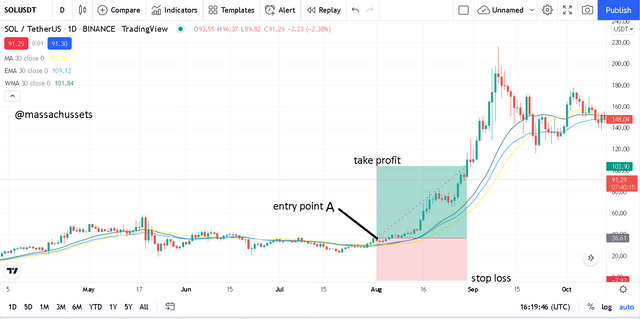
From the chart we can see that the market was in an indecisive state for some time, thus neither buyers nor sellers had control over the market. As a result you couldn’t state categorically whether the moving averages were below or above the price action. At point A we could clearly see the price action had gone above all three moving averages which is an indication of an uptrend. So point A becomes my entry point. With take profit and stop loss areas indicated on my chart.
EXIT POINT.
Just like finding the entry point I will use all three moving averages with the parameters in find the exit point.
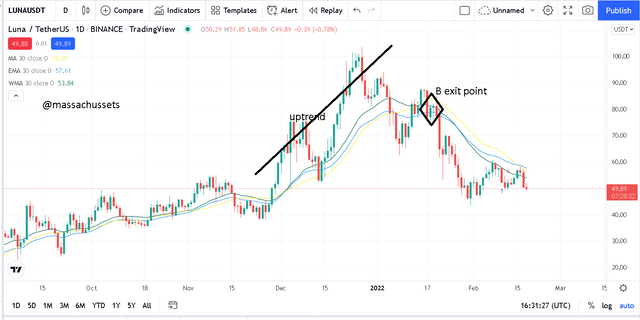
From the chart displayed below the area marked with the black straight line shows that the market was in an uptrend and so the moving averages were seen to moving below the market. But at point B we can see the all three moving averages moving above the price action. This is an indication of a trend reversal. So I will make point B my exit point in order to lose my investment.

What do you understand by Crossover? Explain in Your Own Words.
Crossover is a mechanism used in technical analysis using moving average indicator. In this mechanism or system you will need to combine two moving averages of the same kind or type. In combining the two moving averages you will need to configure the two different with one being the longer moving average which will have a longer timeframe say; 50 day SMA. And the other moving average being the shorter moving average which also has a shorter timeframe say 25 day SMA.
These two react different to the market because of the difference in timeframe. They will be a point where these two moving averages will move and cross each other. Depending on which moves above the other after intersecting a signal is generated.
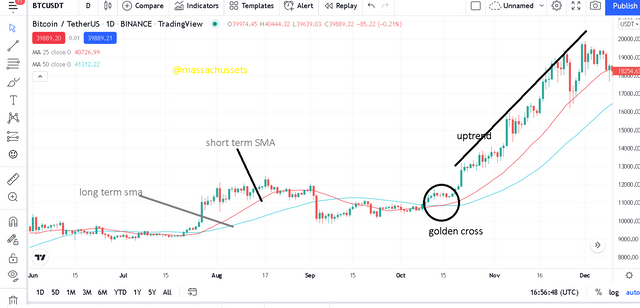
- When the shorter moving average moves above the longer moving average then a buy signal is issued. (GOLDEN CROSS)
- When the longer moving average moves above the shorter moving average then a sell signal is issued. (DEATH CROSS)
The two scenarios are demonstrated in the charts below.
GOLDEN CROSS
It is a long term indicator in the crypto market that predicts an uptrend or a bullish trend. The golden cross mostly happens during the accumulation phase of whales. It happens when the short term moving average moves above the long term moving average.
DEATH CROSS
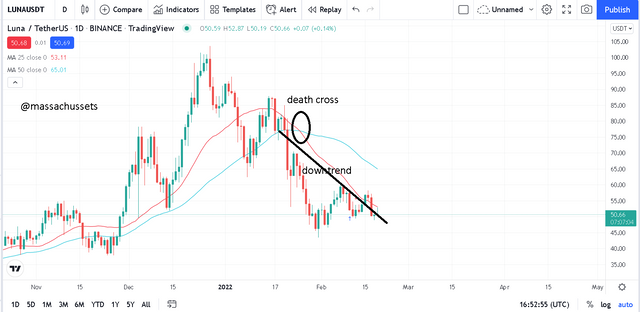
Death cross is a technique used in technical analysis of markets charts to predict a bearish trend. It normally occurs during the distribution phase. It occurs when the long term moving average moves above the short term moving average.

Explain The Limitations of Moving Average.
• It is very effective in trending markets but not effective in sideways.
• The moving average only relies on happenings within the average time but does not consider anything happening outside of the average time
• Trend reversals signals are always given late so mostly traders are trapped.
• It gives false signals in situation where there is price fluctuations.
.
• It is a lagging indicator so it fails to completely capture the current trend in a market.

Trading can be very profitable if you are using the rights strategies in your trading. The availability of a variety of technical indicators, decision making in crypto trades are now backed by signals generated. The moving average is one of the technical indicators that one can use. The moving averages are capable of identifying entry points and exit points for traders. The crossover technique is one of the easy to use strategies that yield positive results. Thanks to professor @shemul21 for the lecture.