Hi everyone, and many many thanks to Professor @stream4u for lecture on Chart Patterns. It is a very detailed lecture and I have learned many new things . Now I am submitting my homework task. So, let's move to the topic.
What is Chart Pattern
Chart pattern is basically the price movement of assets, commodities or currency. The price movement is indicated by candlesticks in a chart. These candlesticks represent the behavior of the market in a specified time period. Technical traders do their analysis on the basis of these charts. Different time frames can be used for analysis and every time frame has different results.
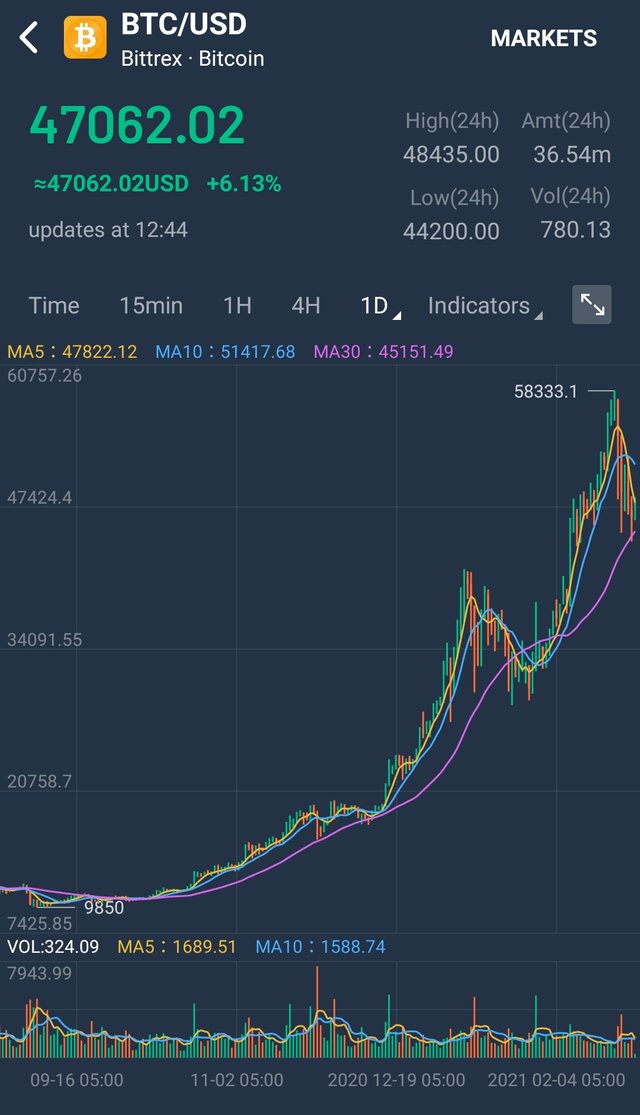
It is one day time frame and each candlestick refers to one day. Green candlestick is bullish candle and red candlestick is bearish candle.
Price Breakout
When price moves upward or downward and breaks a certain support level or resistance level. It is called price breakout.
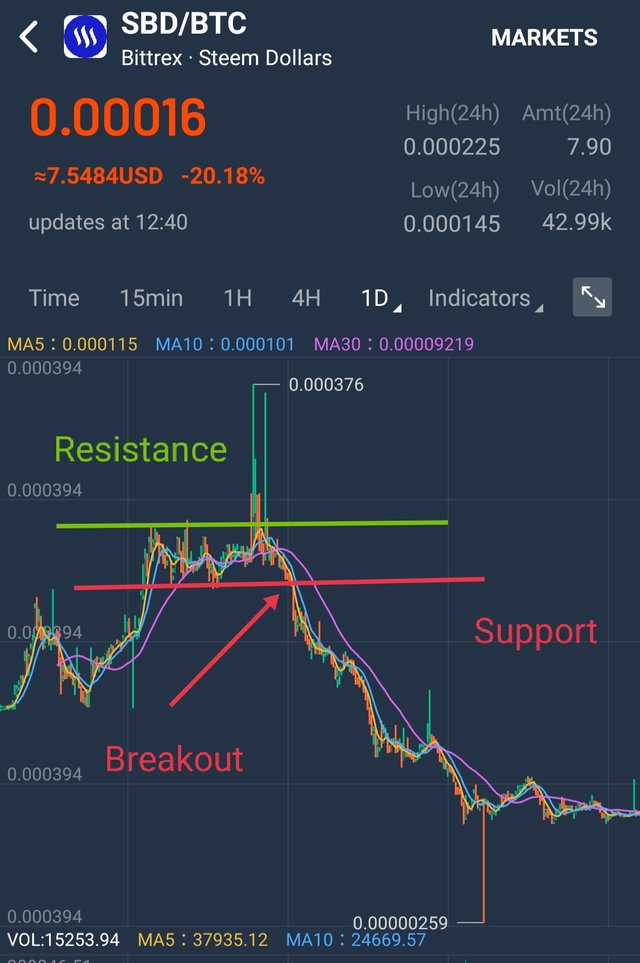
In the above picture, you can see support and resistance level. When price has broken support level successfully and then continue downward, it is called price breakout.
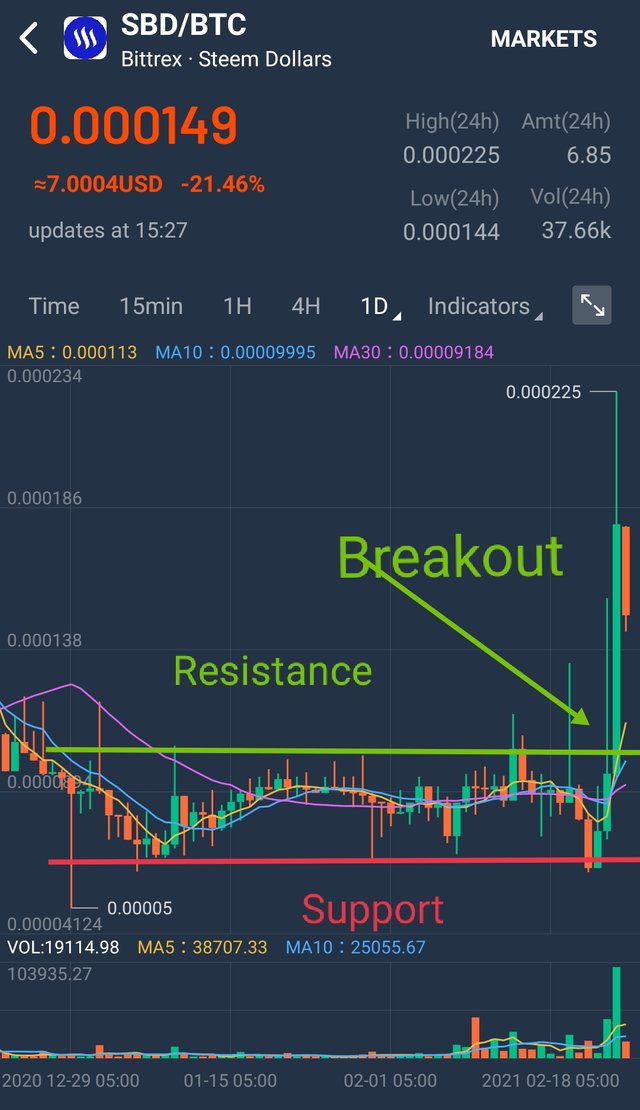
This picture illustrates price breakout to upward. In this picture, price has broken a resistance level and then continue upward. It is an upward breakout.
Continuation Pattern
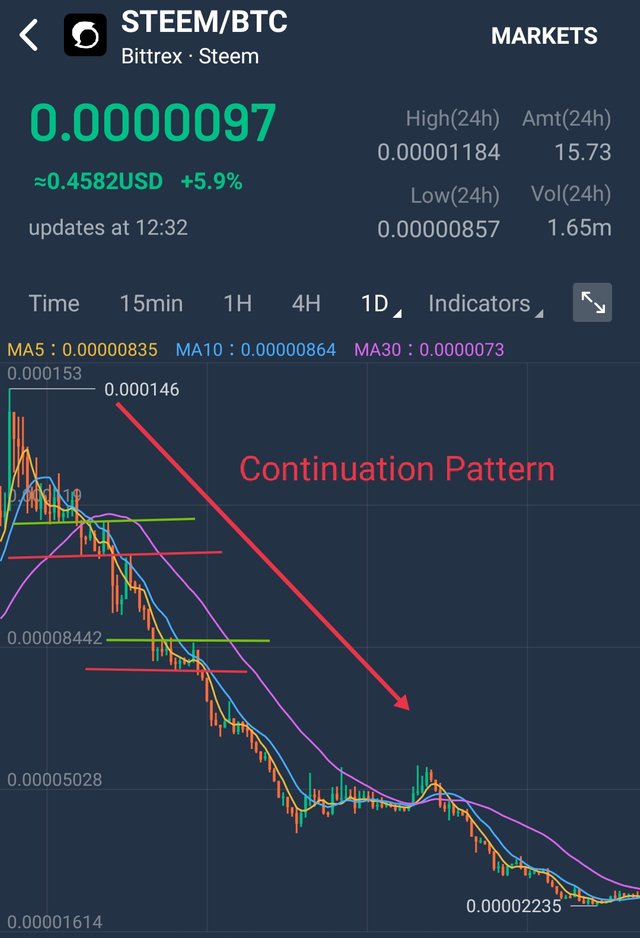
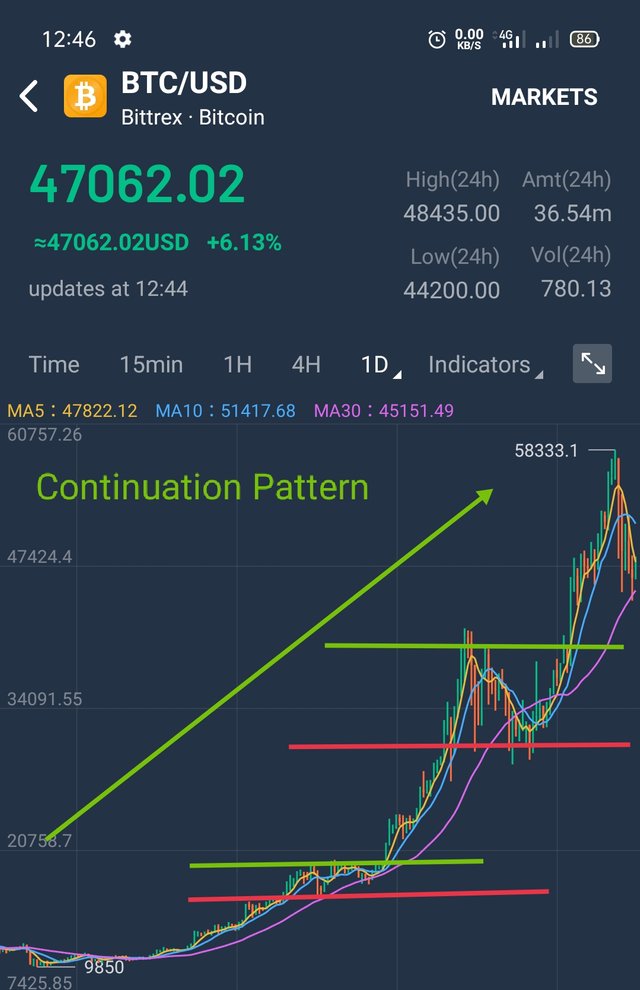
Continuation Pattern is a pattern in which market takes a pause and then continue in the same previous direction. In downtrend, when market remain in a support and resistance level for some time and then price breakout happens. Price moves down the support level and then continue its downtrend. This below picture shows the Continuation Pattern in downtrend.
In upward trend, price breakout happens and price moves upward by breaking resistance level. Below picture illustrates upward Continuation Pattern.
Higher Highs
Higher highs can be seen in upward trend. When price movement is in upward direction and it continues to make new highs, it is termed as higher highs. Below picture will help to understand it.
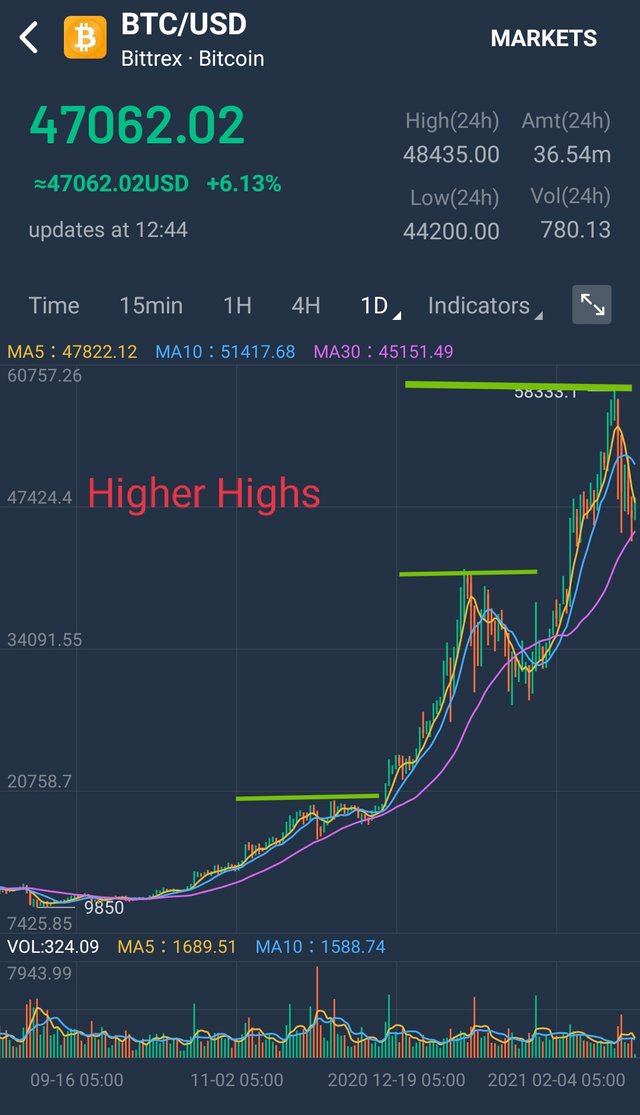
In this above picture, it can easily be noted that how market is making new highs every time.
Lower Lows
Lower lows are formed in downtrend. When market remains in an area and then moves downward and make new low. It is called low lows. It also indicates continuation of a trend.
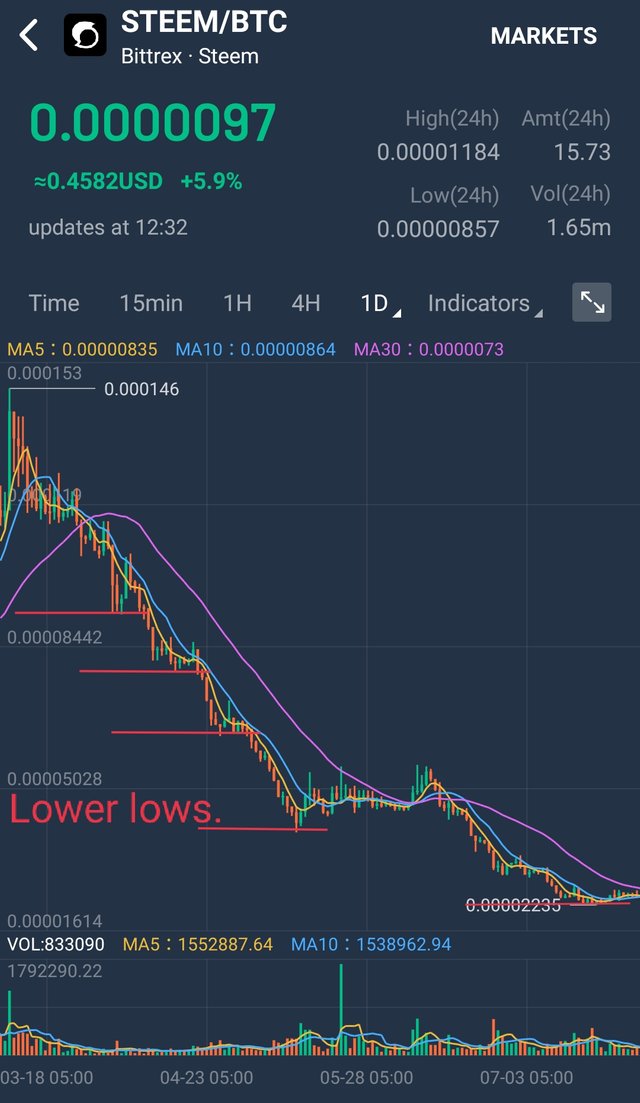
This above picture clearly shows how lower lows are formed.
Reversal Patterns
When market continue in one direction, then it remains range bound and then starts moving in opposite direction, it can be termed as reversal of market. There are patterns that identifies the reversal of market. These patterns are called reversal patterns. Double top or Double bottom are two patterns that indicates reversal of market.
1. Double Top.
Double top is a reversal pattern. When market is in uptrend and has been in this trend for quite some time, then it stops on a certain price and tested this price twice, but was unable to break the certain price level. It is called double top. Below picture will help to understand it easily.
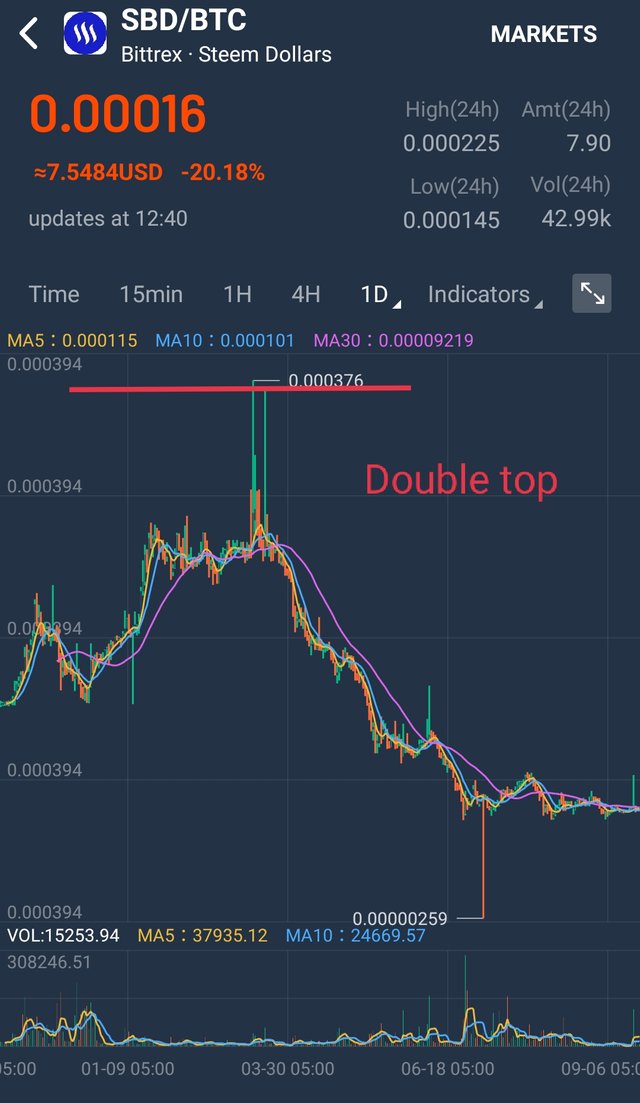
In this picture, market has tested a price level twice but was unable to break the price level. Then it moves to opposite direction of the previous trend. Now the trend has changed.
2. Double bottom.
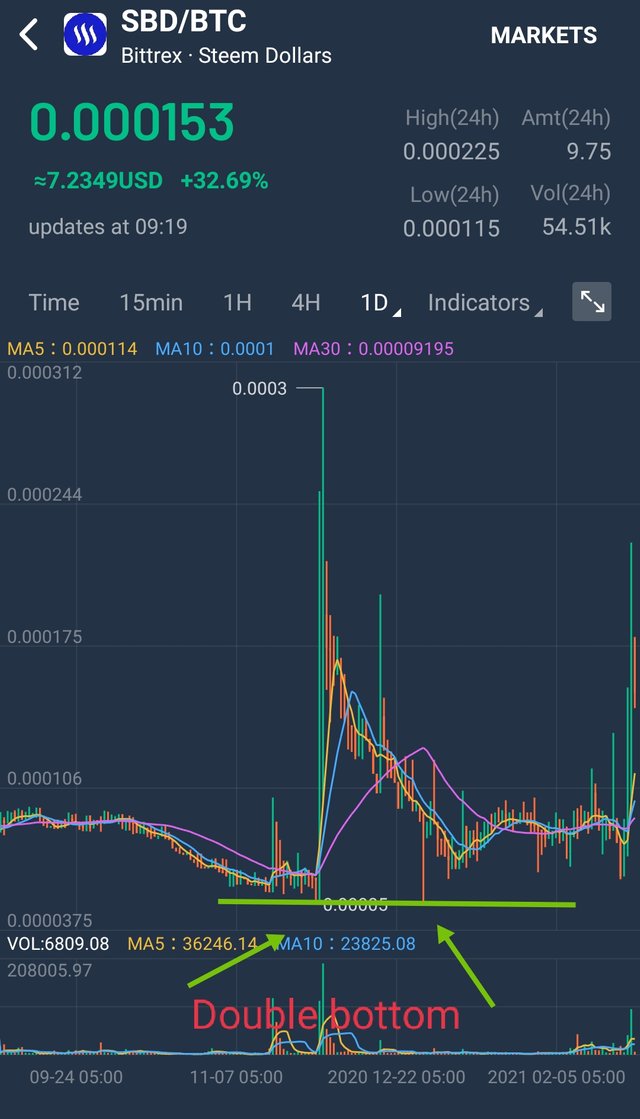
Double bottom is also a reversal pattern and it is formed at the end of a downtrend. It identifies the end of downtrend. When price tests a certain price level and was unable to break this support, it is called double bottom. Below picture illustrates the double bottom.
Stoploss
As the name explains itself, to stop the loss. When a trader enters the market by buying or selling any asset, and the market goes in opposite direction to his analysis direction. If no stoploss is placed, the whole account can be washed out. Stoploss has too much importance in trading world. Stoploss can save trader from huge losses. In other words, stoploss is essential in trading.
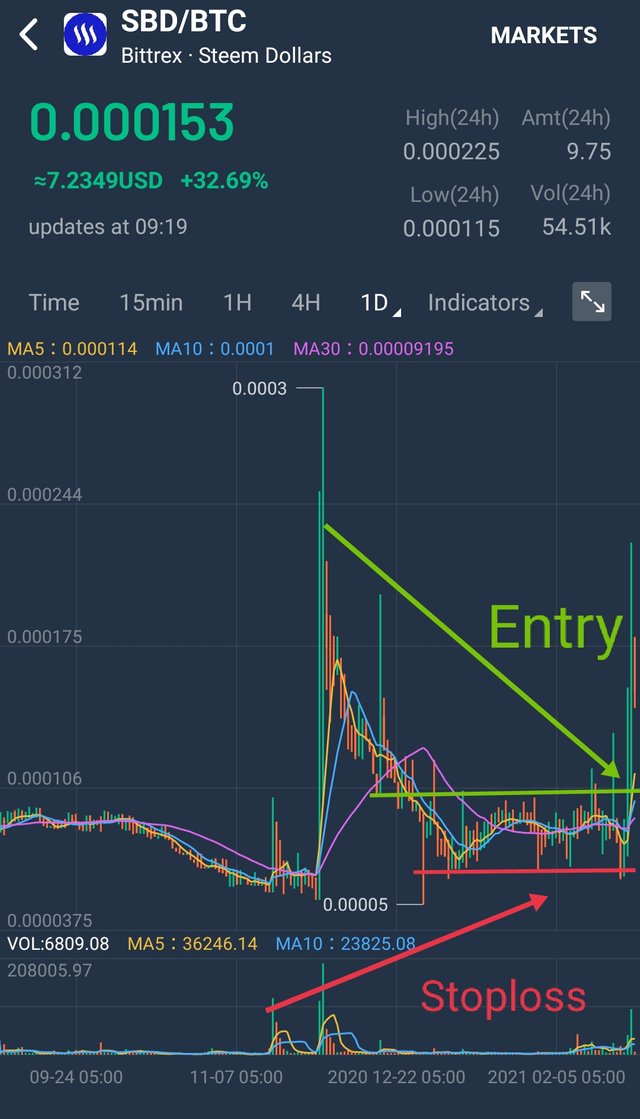
In this picture, it can easily be understood that the price has broken resistance level. Now this resistance level has become new support level. When price will test this new support level, it will be our entry point to place a buy trade. Now the previous support will be stoploss. If market is unable to hold new support and price goes down, then this stoploss will save us from further losses. It is better to exit a trade with small loss than huge loss or account washout.
In the same way, when market breaks support level and again tests the new resistance level (Old support has turned into new resistance), a sell trade should be entered on this point and stoploss should be the second resistance level.
Conclusion
In the end, I would like to conclude by thanking Professor @stream4u for this lecture. I have learned too many things from it. It has given me idea how to analyze the market. When to enter the market and when to exit. What is the trend of the market. Stoploss is very essential and every trade should have stoploss level set.
I have used my own screenshots in this post.
Hi @mawattoo8
Thank you for joining Steemit Crypto Academy and participated in the Homework Task 3.
Your Homework task 3 verification has been done by @Stream4u.
Thank You.
@stream4u
Crypto Professors : Steemit Crypto Academy
Downvoting a post can decrease pending rewards and make it less visible. Common reasons:
Submit
My post on twitter.
https://twitter.com/mawattoo8/status/1365715568054185984
Downvoting a post can decrease pending rewards and make it less visible. Common reasons:
Submit