Hello Everyone
This is @max-pro from, #Bangladesh
 Made by canva
Assalamu Alaikum steemian friends. Wishing everyone good health and enjoying participating in each of the new week's engagement competition. So I came today to take entries in this wonderful engagement contest organized by this SteemitCryptoAcademy community. Today's contest name is "Trading Steem with Fractals and Multi-Timeframe Strategies". So I will discuss this topic in detail, stay with me.
| Question 1: Explain Market Fractals |
|---|
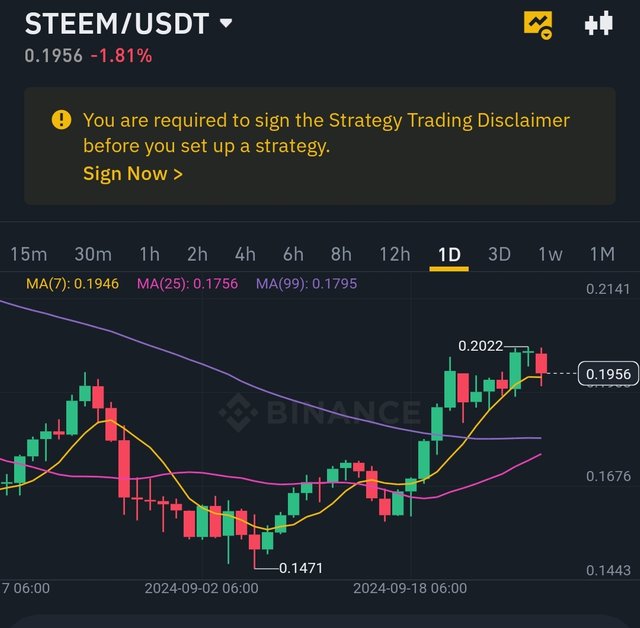 screenshot of my phone
What is a Market Fractal?
A market fractal is a concept used to explain patterns of financial market behavior. Fractals are repeating patterns that display the same structure in different forms or on different time scales.
So market fractals show recurring patterns in the price trends and formations of financial markets that are similar in short and long time periods.
Fractal Formation :
- Bullish Fractal : It is formed when there is a low candlestick in the middle and two candles on either side of it are high. This means that the market price has fallen and then may move upwards.
| Composition |
|---|
| Two descending candles on the left side |
| A minimum candle in the middle |
| Two successively higher candles on the right side |
- Bearish Fractal : This is the shape when there is a high candle in the middle and two low candles on either side of it. That means the market price has gone up and still has the potential to go down.
| Composition |
|---|
| Two progressively higher candles on the left side |
| A supreme candle in the middle |
| Two successively lower candles on the right side |
How are they used to identify trend changes?
So to identify trend changes using fractal patterns, investors look for repetition of higher highs or lower lows on the chart. When these patterns break, it signals a trend reversal. For example, breaking an uptrending fractal can indicate the beginning of a downtrend, and the reverse is also true.
Example of bullish and bearish fractal using STEEM/USDT trading pair.
- Bullish Fractal :-
For this let's say that the price of STEEM is gradually going down and forming a fractal pattern. So a bullish fractal is formed when the price reaches a downtrend at one point and after a downward movement in the next few candles, the price starts to move up. Hence it implies that the buyers pressure is increasing in the market and the trend may be upward.

- Bearish Fractal :-
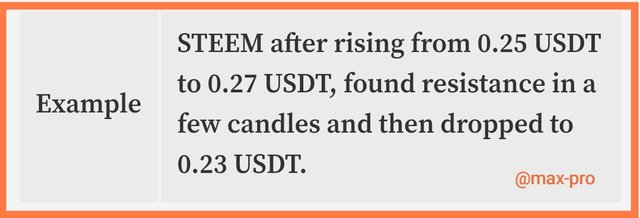
Basically bearish fractals are formed when a pattern is formed after an uptrend in which the price reaches a high point and then begins a downward trend. Hence it indicates that cellar pressure is increasing and the trend may be downward.
| Question 2: Combine Fractals with Other Indicators |
|---|
We can combine fractals with other technical indicators like RSI, moving averages and alligator to improve trend forecasting in a few ways below.
RSI :-
| How to use | RSI is used to detect overbought above 70 or oversold below 30 market conditions. When the RSI moves into an oversold state and a bullish fractal forms. But then it is a signal of an upward trend. On the other hand, when the RSI crosses overbought and crosses into a bearish fractal formation, it can signal a downtrend. |
|---|
Moving Averages :-
| How to use | Actually moving averages such as SMA or EMA are helpful in identifying trends when the price forms a bullish fractal and moves above the moving average. It then acts as a trend change indicator. A bearish fractal is when the price moves below the moving average. It then signals a downtrend. |
|---|
Alligator :-
| How to use | Basically the Alligator indicator consists of three moving averages. When the lines of the Alligator Jaw, Lip and Text cross each other and form a bullish fractal. It may then signal an upward change in trend. So for bearish fractals if the alligator lines drop down after a proper cross it signals a downtrend. |
|---|
Below is a practical example of using RSI, Moving Average and Alligator on a STEEM chart.
| Fractal Pattern | Originally STEEM was in a downtrend and formed a bullish fractal. So when the price started to rise from 0.20 USDT to 0.22 USDT. |
|---|---|
| RSI | RSI was below 30, then it started to rise above 35. So I think in this scenario the RSI has gradually increased and signaled an upward trend. |
| Moving Average | 50 day SMA chart showed an uptrend when the price reached 0.21 USDT. When the price moves above the SMA it acts as a bullish signal. |
| Alligator | Alligator's Jaw, Leap and Text lines were gradually expanding and the Alligator's Jaw Line was beginning to move upwards. Which was indicating strong bearish pressure in the market. |
| Question 3: Using Fractals Across Multiple Time Frames |
|---|
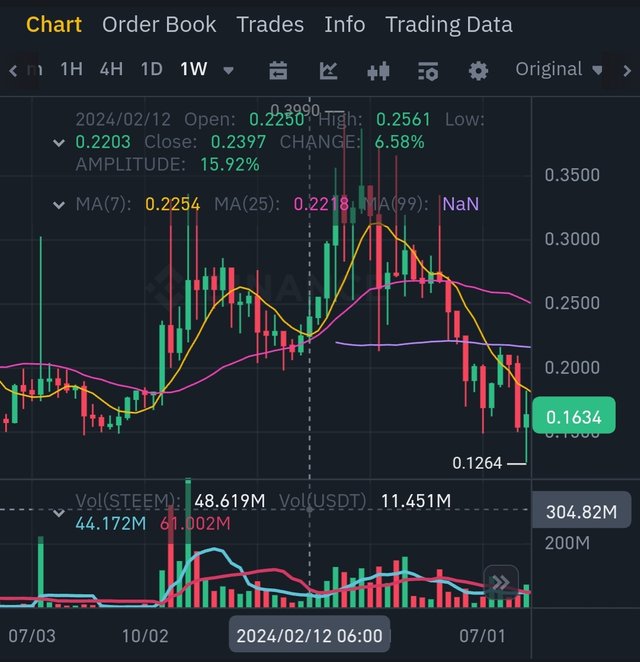 screenshot of my phone
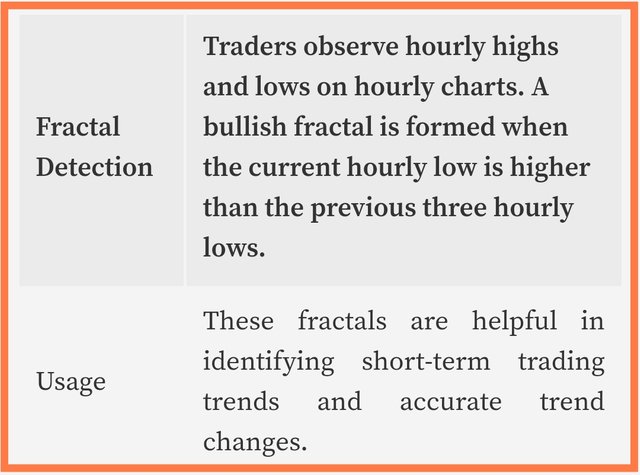
These fractals are helpful in understanding trends and market patterns using different time frames. Below I mention some ways to use fractals on daily, weekly and hourly charts.
1. Daily Chart :-
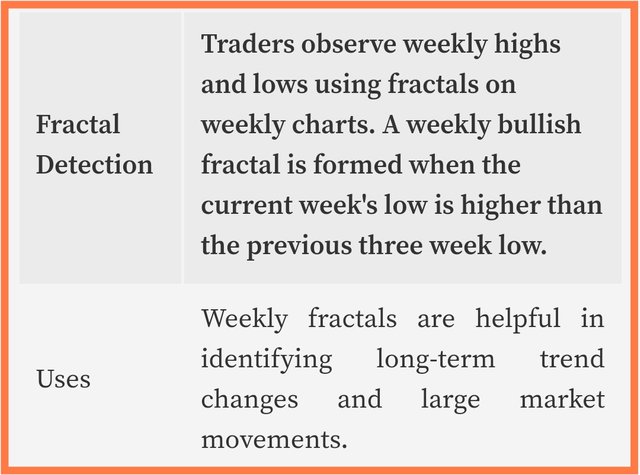
2. weekly Chart :-
3. Hourly Chart :-
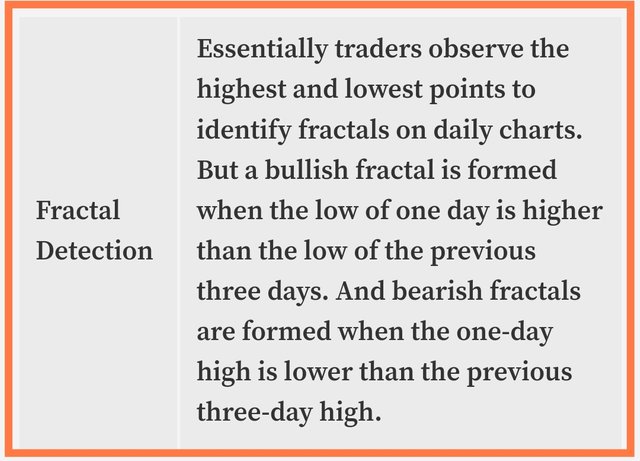
Fractal detection on daily charts.
Bullish Fractal : Assume that on the daily chart STEEM can detect three lows at 0.20 USDT with the next low moving to 0.21 USDT without going below 0.19 USDT. This indicates a bullish fractal.
Bearish Fractal : On the same chart if STEEM makes three high points at 0.25 USDT and the next high point comes at 0.24 USDT then this indicates a bearish fractal.
Identifying Fractals on Weekly Charts.
Bullish Fractal : If the weekly STEEM detects three lows at 0.15 USDT and the next low reaches 0.16 USDT, it indicates a strong bullish fractal.
Bearish Fractal : If STEEM detects three highs at 0.30 USDT on the weekly chart and the next high comes at 0.28 USDT then it indicates a bearish fractal.
Market view.
There is a possibility of price increase in short term and long term. Fractals analyzed together on daily and weekly time frames provide a clear idea of short term and long term market movements which are helpful in making trading decisions.
| Question 4: Develop a Trading Strategy Based on Fractals |
|---|
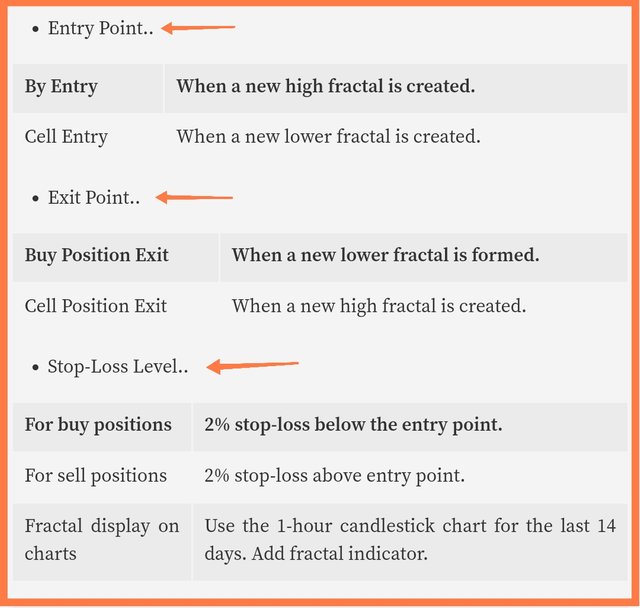
The objective of the strategy is to identify trend changes using fractal patterns and trade based on confirmation. The indicators and measures used are:
- Fractal Patterns
- Moving average
- RSI
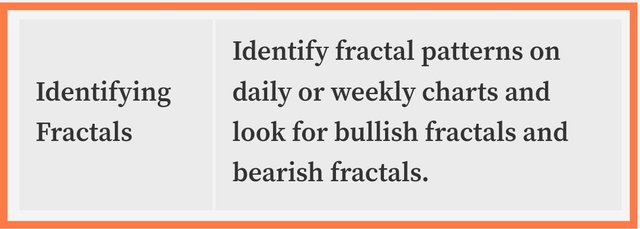
In a bullish position: Make sure the price moves above the 50 day SMA after the fractal is formed. If the RSI rises above 50 from below 30, it is a bullish signal.
In bearish position: Make sure the price moves below the 50 day SMA after the fractal is formed. If the RSI moves from above 70 to below 50 then it is a bearish signal.
| Question 5: Analyze Steem’s Current Market Trend with Fractals |
|---|
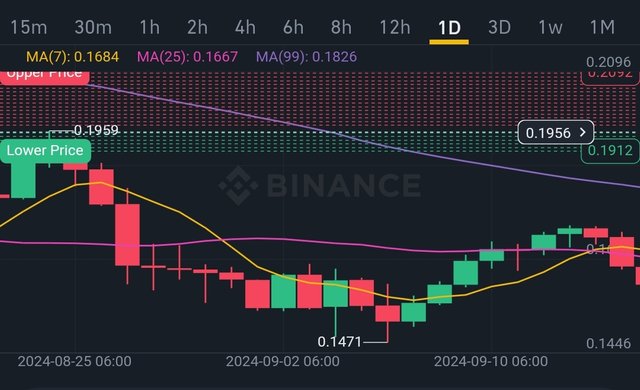
Currently, the STEEM Token market situation is quite stable. Currently its price is around $0.1956. Which has increased by about 0.34% in the last 24 hours. Its lowest price was $0.19 and highest price was $0.1956 in the last 24 hours. STEEM's current market cap is approximately $92.35 million, and its circulating supply is 472,308,839 STEEM tokens.
 screenshot of my phone
Possible Actions Bullish states that if the RSI is above 50 and the price moves above the SMA then the price of STEEM may rise. The next resistance level could be the previous high point such as 0.30 USDT.
Possible action Bearish states that if the RSI breaks below 50 and the price stays below the SMA then the price of STEEM may fall. A possible support level could be 0.20 USDT.
Other indicators..
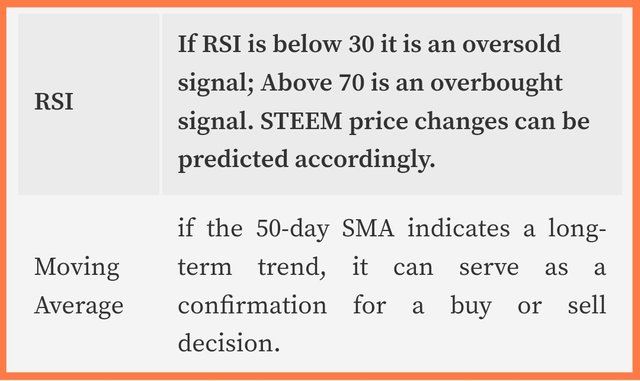
So I think traders need to make the right decisions based on these analyzes while taking possible actions based on the current fractal position of STEEM and other indicators. Only then will the price of the coin increase.

So I am Inviting my lovely Steemian friends @patjewell, @shohana1, @kouba01 to Participate in this Competition.
Twitter share link : https://x.com/Maxpro51412/status/1839972590863155530?t=xu4cpmXmmAXkFSB_8t3XtQ&s=19
Downvoting a post can decrease pending rewards and make it less visible. Common reasons:
Submit