
- Explain Wedge Pattern in your own word.

The Japanese candlestick pattern is a very important element that helps us to see and understand the price movement. When a trader performs technical analysis the main purpose behind the analysis is to understand the next movement of his market. We usually see different types of formations in the candlestick pattern. Which helps us to understand the movement of the market.
When a trader realizes the next movement of the market, he tries to make an entry there. Wedge Pattern is an example of such a pattern that a trader can make a good amount of profit if he understands it well. Since the pattern creates in the situation trading volume is low.
We can usually get this pattern if we draw two trend lines at support and resistance level. Actually, It's looking like Triangle shape but there has very thin or narrow end. There are two types of Wedge Pattern. First, one is rising wadge and another one is fall wedge. After such a pattern, uptrend or downtrend can be noticed in the market. Simply we can say after the wadge pattern trend reversal happen.

- Explain both types of Wedges and How to identify them in detail. (Screenshots required)

I have discussed earlier that what is wedge pattern. In the discussion, I have said there are two types of wedge pattern.
- Raising Wedge
- Falling Wedge.
Raising Wedge
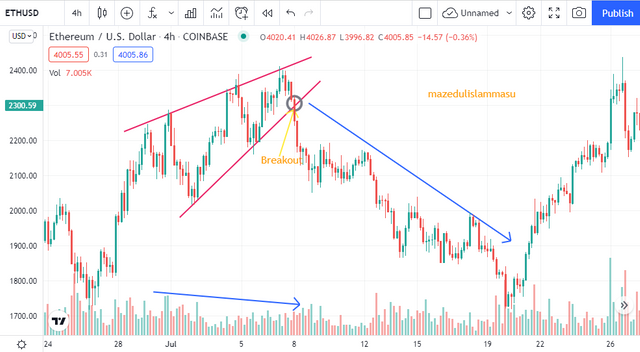
This is a kind of pattern when this pattern is created in the market then the next movement is bearish. In other words, such a pattern is like a curse to a crypto holder. When we will see this type of pattern in market another happen will occur which is the trading volume will decrease.
The raising wedge pattern form at the end of bullish trend that is why we can see trend reversal which results bearish trend. Let's see a screenshot for better understanding.
Some criteria of identification of rising wedge.
- Firstly we will see the chart into support and resistance trendlines.
- Secondly, the pattern must need to touch minimum 5 points. So the touch of support and resistance level more than two.
- Thirdly the lower volume will ensure you the rising wadge pattern.
- The result of the pattern is breakout of market which will happen.
Falling Wedge
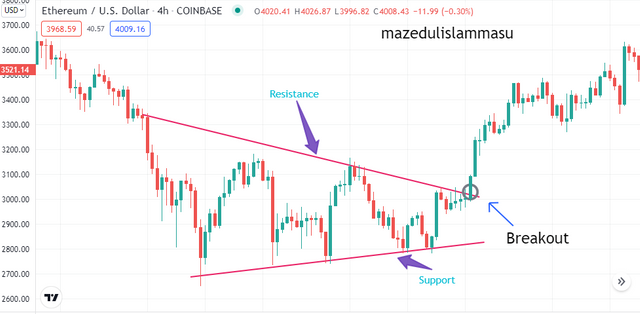
Falling wedge is another example of wedge pattern. Falling wedge pattern always opposite of rising wedge pattern. Generally, we found bullish trend reversal after the rising wedge on the other hand, bullish movement can be seen in the market after falling wedge. That's why, we can say falling wedge is blessed for crypto trader. A trader can make a good amount of profit if he can identify trends and make entries at the right time. A noticeable fact is that when the falling wedge will create at the same time volume will decrease. Let’s see a screenshot for better understand the falling wedge term.
Let's see some criteria to identify falling wedge.
- We need to draw two trendlines at the candle's support and resistance level. All candles will be in two trend lines. The shap will look like a triangle but not exactly triangle.
- We can call a chart pattern as a falling wadge when there are multiple touches on the trendline. There is a condition that must be touched in at least five places.
- Another important think is that at the same time volume will not increase. But when the market will break out the volume will higher than previous volume.

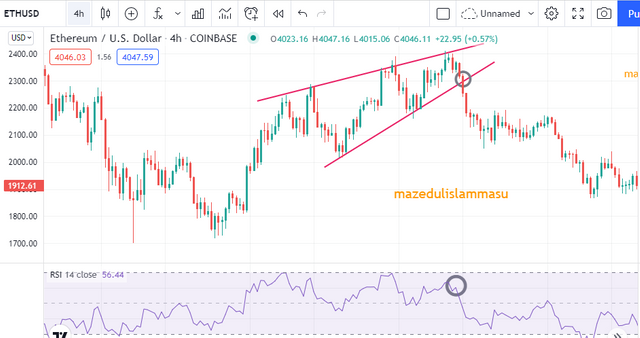
- Do the breakout of these Wedge Patterns produce False Signals sometimes? If yes, then Explain how to filter out these false signals.

I have said before that it is a technical analysis and technical analysis is never 100% successful work. Usually, when we find such a pattern in the candlestick chart, the next movement may bullish or bearish, but there is no guarantee that this will always happen. So I would say in answer to this question this pattern of course sometimes produces false signals.

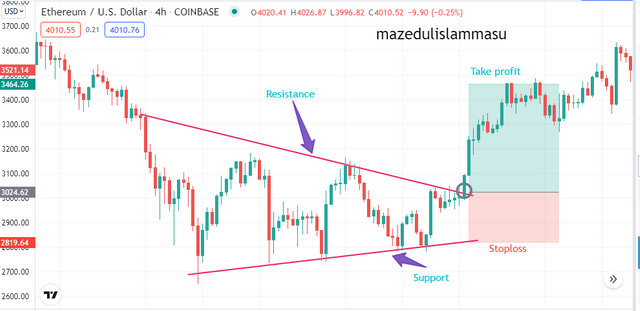
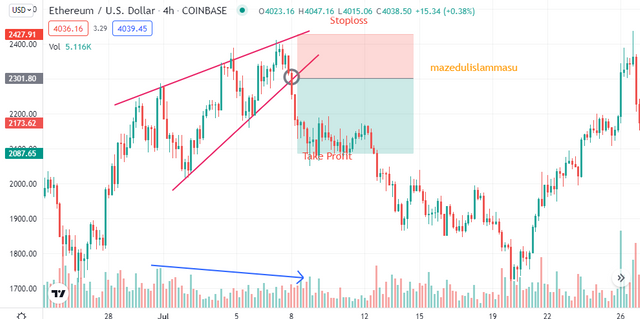
- Show full trade setup using this pattern for both types of Wedges.( Entry Point, Take Profit, Stop Loss, Breakout)

If this pattern appears then it is very important to determine the entry point, exit point, and take profit as well as where the stop loss should be set up. I want to show you a screenshot for a better understanding. Let's see,
I took a screenshot to answer this question from the Trading View website and the crypto pair was Eth/USD. As I said, after the rising wedge pattern we will see bearish movement. That's exactly what happened here. Let's look at the screenshot above very carefully

- Conclusion

This lesson was on technical analysis which is very important for every trader. Technical analysis plays an important role in trading. By the lesson I have learned about wedge pattern very beautifully. Many learning topics have been highlighted through this lesson. The first learning topic is the meaning of wedge pattern.
How to identify the pattern by two trendlines it was another learning topics in the lesson which is presented in the lecture. The main reason behind the lecture was next movement identification. I will say 'Yes' it is working. Screenshots are the proof of Wedge pattern. Full set up of the entry and exit from the pattern I have learnt with satisfaction. It was a really amusing and educative lesson. I want to thank professor @sachin08 for his beautiful lesson.

