What is your understanding of Sharkfin Patterns. Give Examples (Clear Charts Needed)
One thing is always certain in the trading market which is trend line formation it can be in the accumulation phase, uptrend phase, or the downtrend phase all these phase movements are a result of trend line phase movement formation due to trading price action from traders/investors.
On the other hand, traders watch out for this phase movement and take advantage of them base on these phase movements it's for certain traders must pay attention to this trend line phase change this will help them confirm when to enter or exit a trade.
The Trading Sharkfin Pattern is an important trend phase movement that can also be observed by traders it forms a reversal pattern that gives traders clear confirmation to either long or short a trade the sharkfin patterns form a V shape on the bear market and an inverted V on the bull market they are an important trend reversal point that tells a trader to get ready for a quick market turn over.
Scott Carney in 2011 discovered this trading pattern in addition to more confirmation when trading with sharkfin pattern trading indicators will be needed by traders which will help give more clarity when and how to enter a trade.
Some sharkfin pattern example
TRX/USDT bull and bear sharkfin pattern
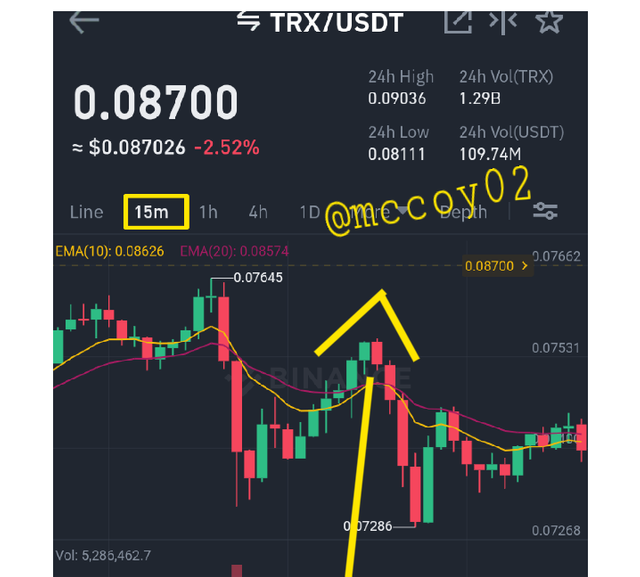
Below is a 15-minute TRX/USDT chart taken from my binance trading application it can be seen from the chart how TRX price respectively followed the market trend and made a reversal on reaching a high mark price.
From the chart below TRX was in a bullish trend as there was a clear breakout but as the price reached its peak traders began to take profit which caused a quick price reversal.
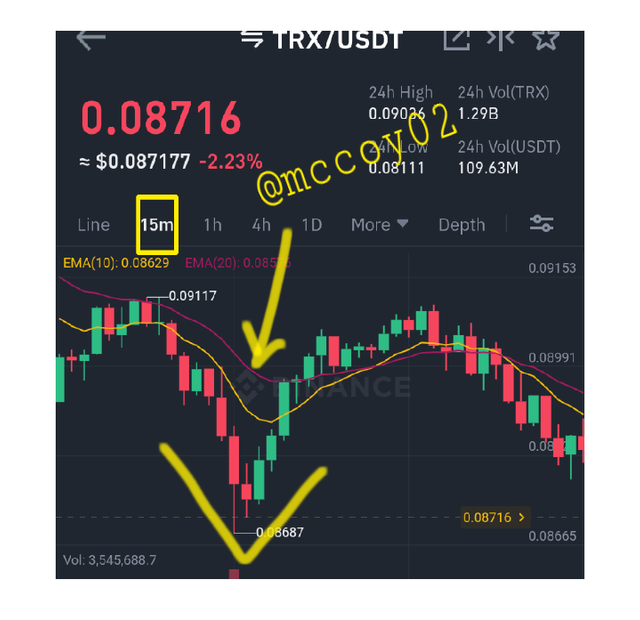
Below we can also see how the price of TRX/USDT followed a bearish pattern it can be seen how the price of TRX made a quick reversal on reaching the bottom it can always be confirmed after a long bear market there is a high possibility of market reversal which formed the sharkfin pattern.
ADA/USDT bull and bear sharkfin pattern
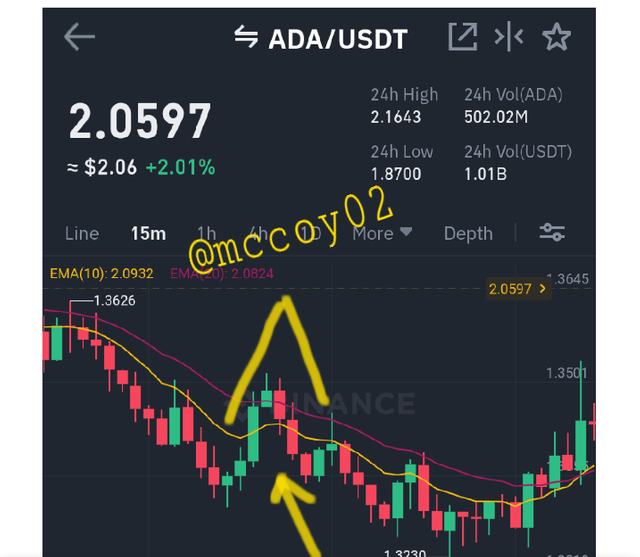
As can be seen also from a 15-minute ADA/USDT chart a V shape pattern is formed confirming price reversal in ADA when its price moved high due to high market volatility.
Below is ADA/USDT in a bullish market trend it made a quick market reversal on reaching its peak.
In the below bear market chart in 15 minutes timeframe of ADA/USDT, we saw a quick market change when ADA reached its bottom line.
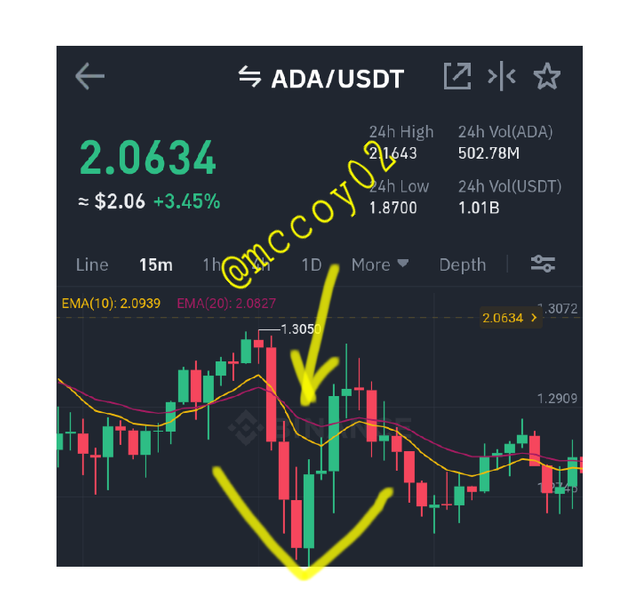
From the bull/bear charts, above it's can be obtained that sharkfin patterns can always be confirmed at the peak or bottom of the bull or bear market, it depends on the trader's trading strategy to determine when to enter or exit a trade.
Implement RSI indicator to spot sharkfin patterns. (Clear Charts Needed)
Trading indicators are tools that help traders in making decisive decisions when trading it guides them against making sentimental decisions on any trade.
With the RSI indicator and the sharkfin pattern when combined a trader can have more clarity on how and when to enter and exit a trade.
For traders to trade the sharkfin pattern with RSI the default settings of 30 and 70 should be set, a reading below 30 on RSI shows a weak trading signal while reading above 70 indicates a strong signal.
Bullish sharkfin pattern with RSI
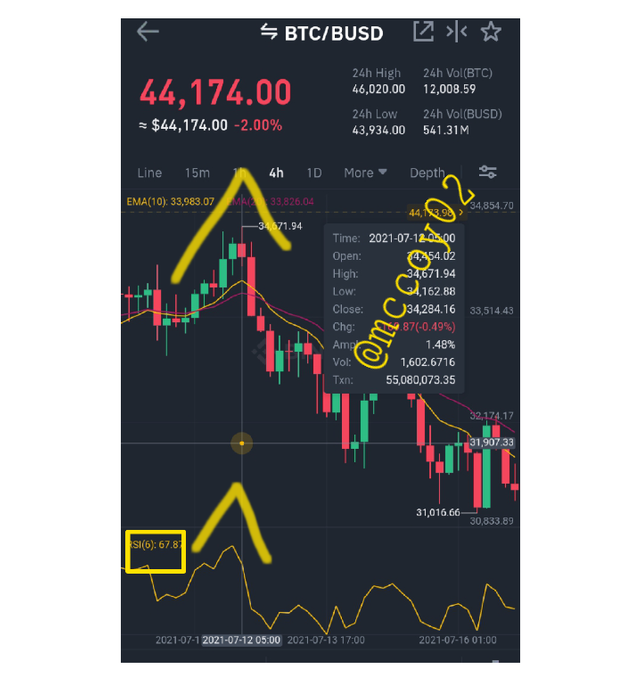
The chart below is a 4-hour timeframe chart of BTC/BUSD it can be obtained from the chart RSI is above 65 which means there has been a long bullish market where buyers were dominating the market as the price moves more upward it reaches its saturation point and here buyers begin to take profit at this point there will be a market reversal where the inverted V sharkfin pattern came into view.
Bearish sharkfin pattern with RSI
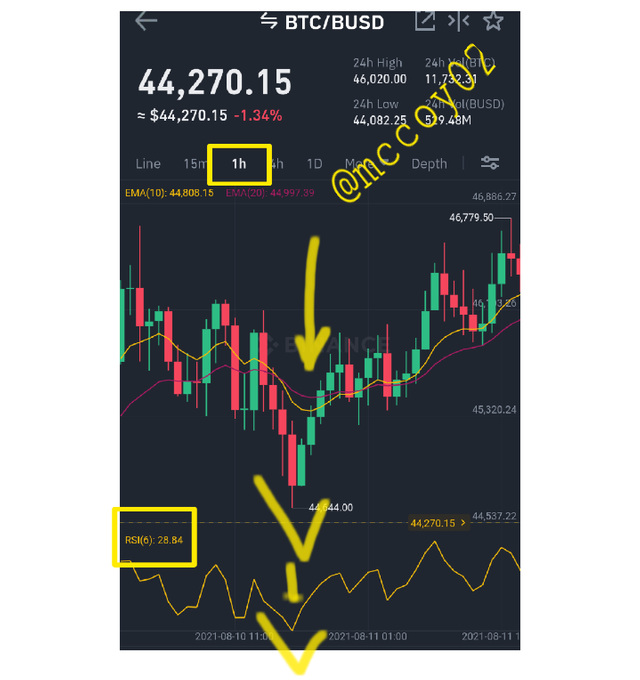
Below is 1-hour BTC/BUSD chart here sellers have been dominant in the market for a long and from the RSI indicator it can be seen it reading is below 28 which indicates a weak market trend making a V shape to be formed as the seller begin to book profit and exit the market a sharp upward market movement was seen.
An important point to note from the bullish sharkfin pattern with the RSI a valid uptrend must be made which confirms buyers have been dominant in the market making the RSI rise as buyers start booking profit we saw a quick price reversal forming the inverted V shape.
It also applies to the bearish sharkfin pattern as the sellers dominate the market the RSI falls below 30 which shows there is a weak price signal as sellers being to book a sharp V shape is formed.
Write the trade entry and exit criteria to trade sharkfin pattern (Clear Charts Needed)
Entry criteria for buy using sharkfin and RSI
First is for a trader to set RSI with 70 and 30 default settings a reading within the range of 70 shows price overbought or an uptrend move while reading with the range of 30 below shows selling pressure.
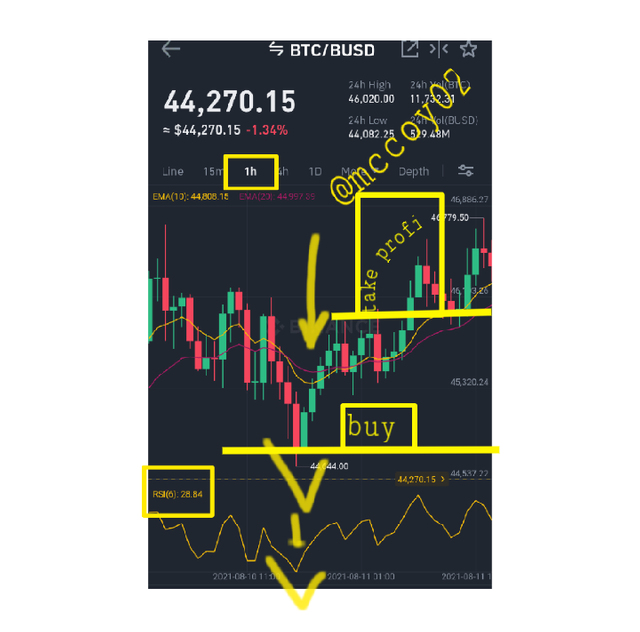
When there is a clear selling pressure showing a downward trend a trader should wait for more confirmation of price move down and an RSI reading of 30 below to make sure the selling pressure has started reducing. which will form the V shape.
A clear RSI reading below 30 should be observed by the trader
Once the above criteria have been met a trader can easily place a buy order or position below the 30 RSI reading range in a downward trend pattern.
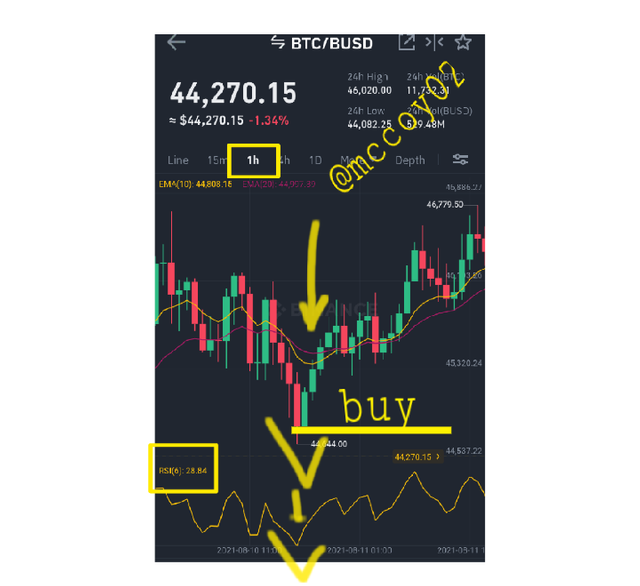
The chart above shows the BTC pair in a downtrend bearish move below 30 RSI showing price oversold as it made a bottom price below 44k a price reversal began making sellers to take profit and we saw a quick rise in the price of BTC.
Entry criteria for sell using sharkfin pattern and RSI
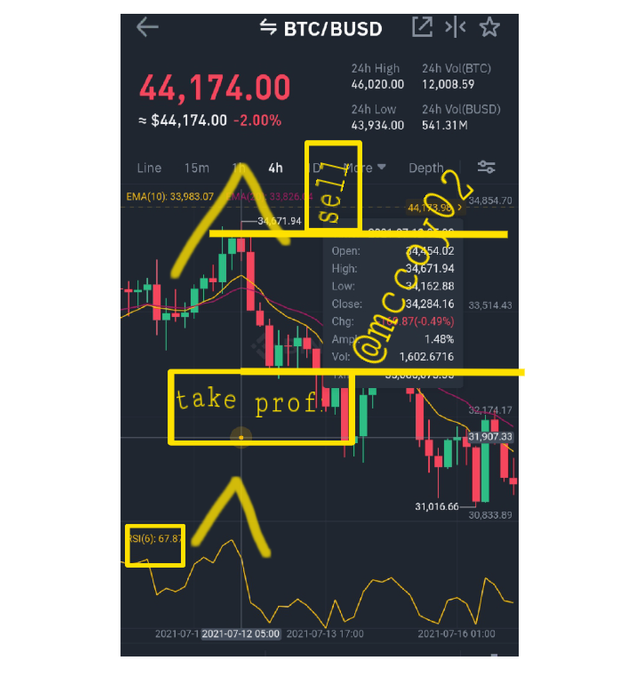
Here also the RSI setting should be looked out for reading within the range of 70 and above shows price overbought which shows buying pressure.
An uptrend move should be looked out for which means there must also be an upward trend move showing high price movement
RSI should be above 70 or within the range of 70
When the above criteria are observed a trader can place a sell position.
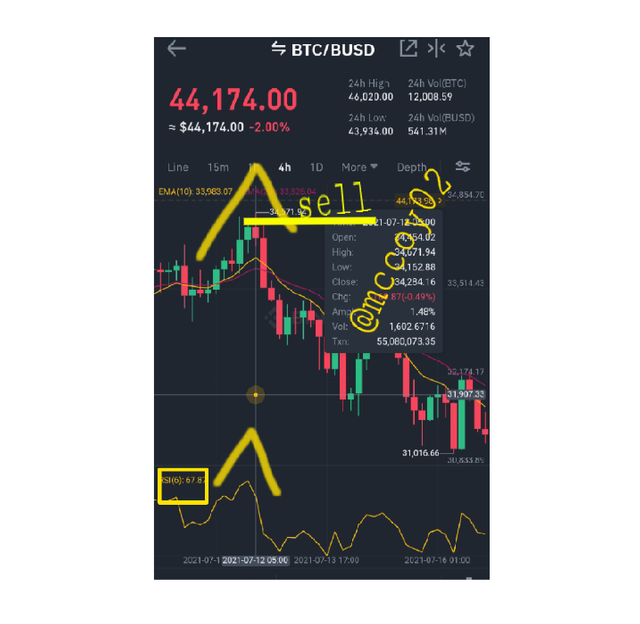
The BTC pair shows a bullish chart pattern which means buyers were dominating the market and RSI above 67 as the price makes peak we saw a quick price reversal.
Exit criteria for buy
traders need to set up a stop loss this will help prevent market liquidation
The stop loss should be placed below the bottom of the downtrend line.
Price trigger below the stop loss means the trade is invalid and trader should wait for another downtrend confirmation before entering a new position.
Take profit will hit automatically if the market price goes as expected.
- Risk Management of 1:1 should be considered.
Exit criteria for sell
Stop loss needs to be set up to prevent liquidation.
Stop loss should be placed above the uptrend price line.
Stop loss trigger above the uptrend line means the trade is invalid.
Proper risk management should be taken of 1:1.
Take profit will hit automatically if the market price goes as expected.
Place at least 2 trades based on sharkfin pattern strategy (Need to place trades in demo account along with Clear Charts)
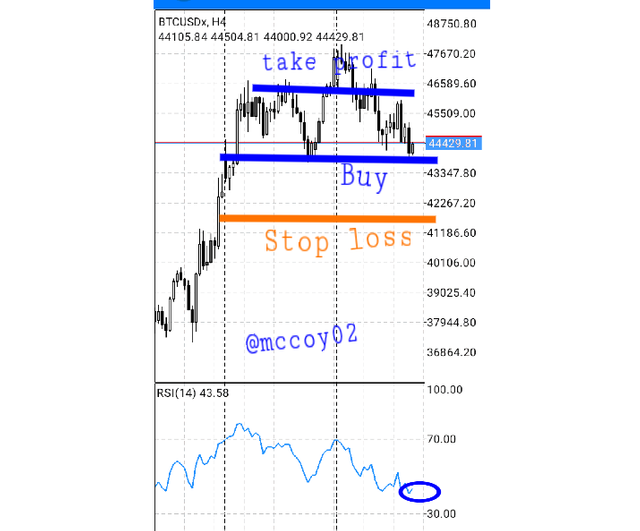
The chart below is taken from my Meta4 trading account BTC/USDx pair of 4hour timeframe shows that the RSI has started moving from the bottom line and start forming a strong buy signal above 30 RSI reading.
I placed a trade above 44k and the price of BTC has been respecting the trend line forming a good buy signal support.
I will also be placing my stop loss below the 44k price which will help prevent loss against a price reversal.
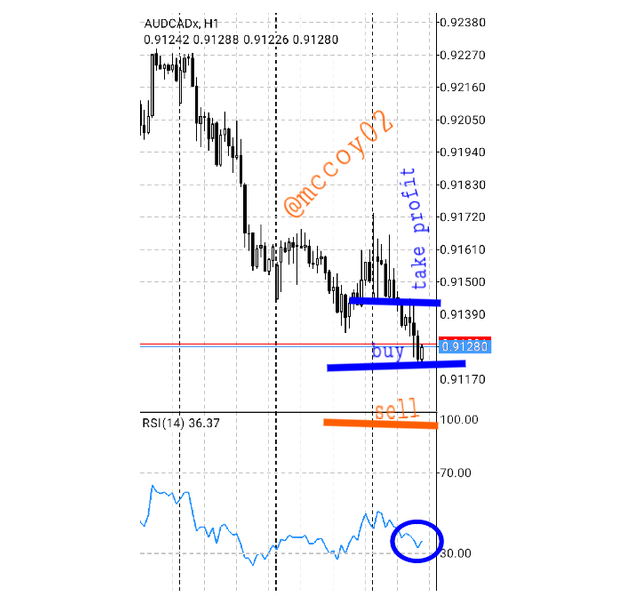
Below is a chart of AUD/CAD on a 4-hour timeframe it shows an RSI moving away from the 30 range this shows that the sellers are beginning to take profit and buyers have started dominating the market.
I placed my buy order as the market starts reversing with a take profit above my placed my order.
I placed a stop loss below my buy order.
Conclusion
Sharkfin trading pattern is a very good trading pattern that can be used for trading as most indicators need additional indicators for more confirmation the sharkfin patterns works with RSI with a default setting of range 30 and 70 a trader can easily determine when to enter or exit a trade with the help of RSI.