
1. Define and Explain in detail in your own words, what is the EMA Strategy + Breakout of the Trend line?

An exponential moving average (EMA)
is a moving average (MA) that provides the most recent data value giving them more weight and relevance in the analyzing of data. Another name for the exponential moving average it the “exponentially weighted moving average”. Simple moving average gives equal weight to all the available observations found in the period, but its reactions to recent data movements is less dominate to that of an EMA or exponentially weighted moving average (EWMA).
EMA Strategy + Breakout of the Trend line
The EMA is quite popular in forex trading, to the point where it is frequently used as the foundation of a trading strategy. Trading on a shorter term EMA while respecting the position of a longer term EMA is quite common among traders or in the crypto market. If when the short-term EMA crosses below the long-term EMA, a trader would enter a sell order, the short-term EMA crosses above the long-term EMA a trader would enter a buy order. When we talk about EMA figures like 10 EMA or 20 EMA, we are talking about the previous time period that the trader chose. This number is usually expressed in days, therefore, 20 EMA is equivalent to the last 20 days, a 50 EMA equivalent to the last 50 days, and so on. It important to use the EMA strategy along with trendlines which could be quite effective. First, identify the trend of the market, then draw trendlines that are opposite with the market trend, i.e. if the trend is a bullish trend, draw a bearish trend line and vice versa. If there is a breakout in the bearish trend line you draw then it’s time to sell.

2. Explain in detail the role of the 100-period EMA in the EMA + Trendline breakout strategy?

The 100-period EMA can be used as dynamic levels of support or resistance, but a crossover between it has important ramifications for the asset or currency pair you are looking at. Generally, the greater the timeframe, the more meaningful the signal tends to be, as with every signal in technical analysis. The 100-period EMA will assist us in determining which direction we should take operations, since we will only look for Purchases if the price is over the 100-period EMA. Now if there is a drop in price and price falls below the 100-period (EMA) exponential moving average, we will look for Sales. Investors can use the 100-period EMA to see how the stock has performed over the past 20 weeks and determine whether the price trend is upward or downward.

3. Explain in detail the role of the ‘Trend line’ in the EMA + Breakout Strategy

Trendlines are visible lines which are drawn on charts by traders connecting a sequence of prices to determine the best fit of the data. The line is then used to provide the trader the sense of which way an investment’s value might move in the near future. In each time frame, trendlines presents visual representations of support and resistance level in the market. They show the direction of price and its speed, as well as the patterns or behavior of price during moments contraction.
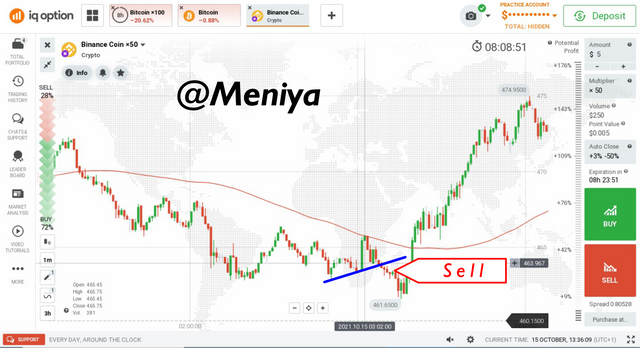
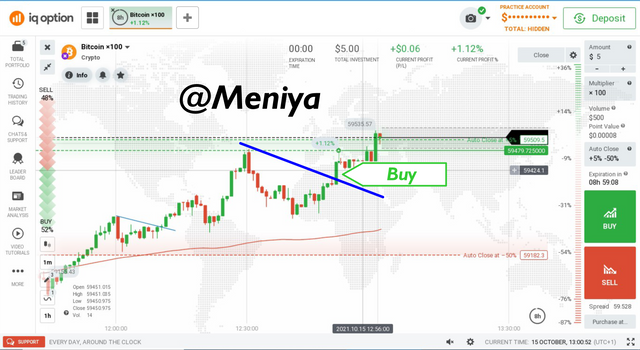
Investors use trend lines to spot or identify breakout in the dominate trend. when the trend is above a 100-period EMA you draw a trend line in the opposite direction of the original trend. If the trend is a bullish trend, drew a bearish trendline, if there is a breakout, then purchase. If the trend is below the 100-period EMA which is a bearish trend, draw a bullish trendline and wait for a breakout which will act as a ‘Sell’ signal.

4. Explain the step by step of what needs to be taken into account to execute the EMA + Trendline Breakout Strategy correctly?

EMA Period
Longer-term EMAs periods gives more reliable data or information than short-term EMAs, so a 100-period EMA is more effective than a 50, 20 or lesser EMAs. Use anyone that works best with your trading strategy. When using the 100-period EMA we should only check for Purchases if the price is above the 100-period EMA. Now, when the price drops or falls below the 100-period exponential moving average EMA, we will look for Sales.
Trendline
The use of trendlines are also very effective, trendlines helps the trader know the trend of the market, support and resistance levels. Trendlines also helps the trader identify breakouts and make good trading decisions. To identify a breakout, draw a trendline against the dominant trend e.g. if there is a bullish trend, draw a bearish trendline, a breakout will be a Purchase signal, if it is a bearish trend, draw a bullish trendline, a breakout will be a Sale signal.

5. What are the trade entry and exit criteria for the EMA + Trend line Breakout Strategy?

When the price is above or below the 100-period EMA (uptrend or downtrend) and is in harmony with the movement of price, draw a bullish or bearish trendline and wait for a breakout in order to place a sell or buy option. If the opposite happens, whereby price is not is harmony (if there is a Literalization) with the EMA it means this method is invalid and we must wait for the trend to emerge, whether bullish or bearish. When the price starts making a trend whether bullish or bearish then enter the market, drawing bullish or bearish trendlines and if there is a breakout i.e. if a candle closes above or below the trendline you buy or sell as the case may be.
Make 2 entries (one Bullish and one Bearish) in any pair of Cryptocurrencies using the EMA strategy + Trendline Break. (Use a Demo account, to be able to make your entry in real-time at any timeframe of your choice, preferably low temporalities).
Cc:@lenonmc21

