Hello Steemians, nice to be here on the 3rd week of Season 6 in the Steemit Crypto Academy. An interesting lesson we have here by professor @shemul21 on the identification of Support and Resistance, below is my homework task.

☆What is Support and Resistance.
The use of technical analysis tool in trading is an integral concept as it helps traders to understand, predict and make good trade decisions. One of the important technical analysis is the Support and Resistance zones or level, are pivotal areas that represents traders reaction to price in the market as it it marked as a zones of high buying or selling pressure and shows the level of demand and supply by traders in the market. Support and resistance are pivotal tool to traders as it can help in giving the direction of the market trend and price movement, although this is not always the case as breakout in price can occur cause a trend reversal or continuation in its original direction depending on the trader's momentum, that is the buying or selling strength. These levels are sometimes influenced by traders sentiments in the market. Wyckoff's method can better describe support and resistance zones as an accumulation and distribution phase in the market.
A support zone is an area that shows the level at which an asset price pause in a downtrend due to high level of demands and high buying pressure. support zone is the lowest point a price can get, the price can either continue in the present trend or move in a reverse direction (upwards). The more the price fails to cross or go below a support level indicated the strength of the support zone( a strong supportzone), support zone is seen as a distribution zone, as there are more active buyers within this area in the market.
A resistance zone is an area where the price of an asset is expected to take a pause during an uptrend movement due to the level or of supply or selling pressure in the market by traders. At this zone the asset price is believed to have increased due to high selling interest of traders, the price would either struggle to be in an uptrend direction or reverse of trend will occur, except in cases where momentum is high and the price breaksout of the resistance level and continues in an uptrend direction. Resistance zone is seen as an accumulation phase.
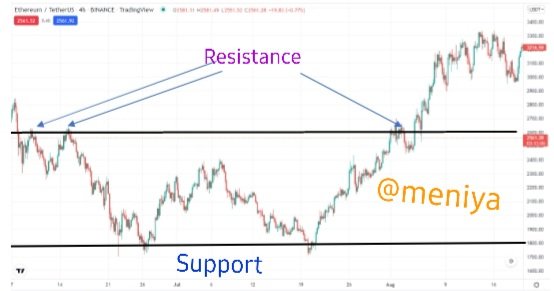
The chart above shows support and resistance levels represented in an horizontal line, which is one of the types of support and resistance levels.
The successful idenfication of a support or resistance zone and the way price reacts to these zones, it can serve as potential entry or exit trading points, because, at the instance a price approaches a support or resistance level, it will either pullback away from the support or resistance level to a reverse direction or alter the price level and continue in same direction before the pullback, till it hits the next support or resistance level in future.
☆Different types of Support and Resistance
There are different types of support and resistance that can be spotted on the chart. The most common is the horizontal support and resistance which can be drawn using horizontal lines. Below, I'll be describing 3 types of support and resistance.
•Horizontal Support and Resistance
This is the most common type of support and resistance level, used mostly by experienced traders for technical analysis. The support and resistance levels are drawn on a horizontal line, as series of previous data points are connected to current price data on a horizontal line. The horizontal resistance and support levels shows areas of price reaction and expresses the traders sentiments in the market, as such it acts as horizontal resistance and support. Normally, when a resistance or support level breakout the asset price tends to continue in it's present trend movement or a trend reversal occurs. When the resistance level breaks upwards it can also serve as a support level and support level below the line, it tend to act as a resistance.
A price break above horizontal resistance level during an uptrend, signals a possible trend continuation and when there's a break close to or below support it indicates a possible trend reversal. When a breakout occurs at the resistance level, the broken resistance level now becomes the new support level for the upward price movement, this helps in maintaining the bullish trend.when the price approaches horizontal resistance it indicates the high selling pressure in the market, as the traders at this pint us rejecting the price of assets.
A break in price below horizontal support during a downtrend, signals a possible trend continuation and when a break occurs close to or above resistance is signals a possible trend reversal from bearish to bullish trend. The broken support level now becomes the new resistance level for price movement in downwards direction. As the asset price approaches the horizontal support level, the price is expected to move upwards in an uptrend direction due to a higher buying pressure in the market.
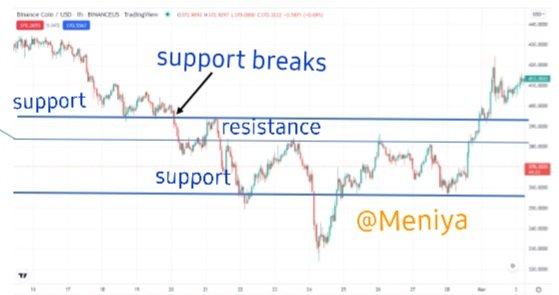
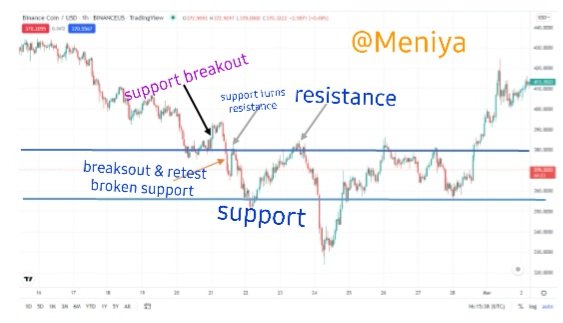
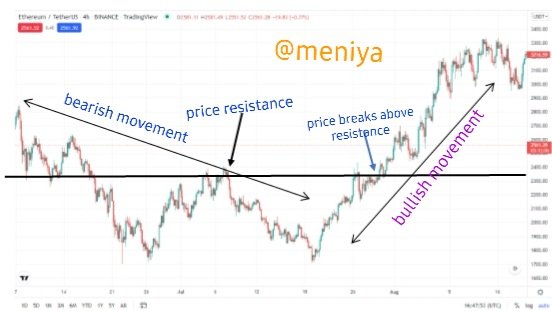
The charts above shows horizontal support and resistance levels and the price reactions by traders in the market. Also it shows what happens when a breakout occurs, as we can see the horizontal resistance turns to horizontal support when the price breaks above or below the level during a strong downtrend or uptrend.
•Slope resistance and support.
The slope level resistance and support is also a type of resistance and support level that connects at least two lower high price points drawn on a diagonal line known as Trendline. The diagonal line shows the various sensitive price points, highlighting the price reactions between the traders in the market. The slope resistance and support levels shows key spots of price reversal and also helps to determining the price direction of price, as the diagonal line can be drawn in both an uptrend and downtrend direction. Most traders take advantage slope resistance and support levels in making a decision for trading.
When in an uptrend the price reactions creates a higher high and high low points connected on the diagonal line to have a slope. It is plotted by connecting a relative low price point to the highest low price point.
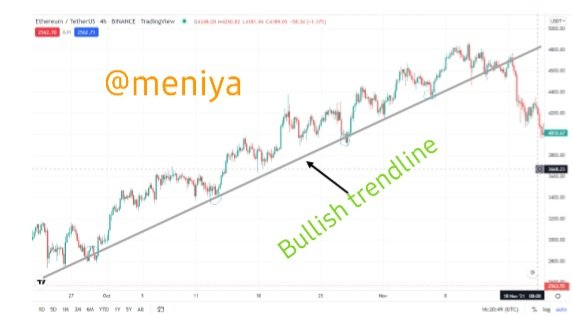
The chart above, shows a sloping level during an uptrend and how the price respects the level and reverses each time the price approaches the level. The uptrend movement serves as a slope support level here, a break of the level can be seen as a trend reversal, indicating the high selling in the market.
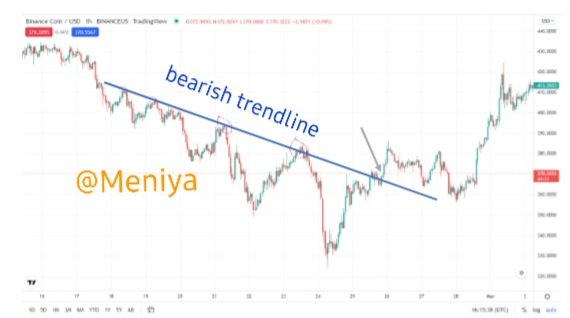
During a downtrend, the trendline depicts the various lower high points on the chart which are connected by a diagonal line. The slope level is plotted from a relatively high point to the lowest high point, by connecting at least two lower high points. This slope indicates the presence of diagonal resistance level and a price decrease in the market.
The chart above shows sloping resistance level in a downtrend, during this period, the price action is greater than lower highs and lower lows. The prices respects this level and reverses for the continuation of the downtrend, when a break occurs in downward trendline,it denotes a bullish reversal and presence of higher buying pressure in the market.
•Dynamic Support and Resistance.
Dynamic Support and Resistance is a unquie type of resistance and support level, as it doesn't involve a trader identifying the spots and connecting these levels on their own, rather the dynamic support and resistance automatically draws the support and resistance level on the chart as the price action moves continously into the future. This type of support and resistance level is determined by its proximity to price formation, hence these levels can be easily spotted with the combination of technical indicators like Heikin-Ashi, Moving Average, RSI etc indicators. For this section, I'll be using Moving average indicator to explain the dynamic resistance and support levels.
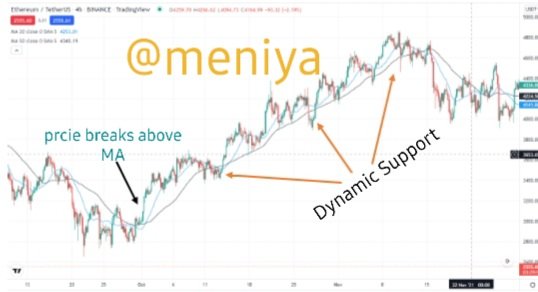
During an uptrend, asset price breaks above the moving average line, at this point the MA line serves as a dynamic support level in an upward movement, as we see the price bounces off above the MA and continuous its upward movement. I'll be using 20MA and 50MA periods to illustrate on the chart below.
From the chart above, we can see the MA lines served as dynamic support to the price upward movement, maintaining a bullish trend after each pullback plotting a chart with the consistent formation of higher highs and higher lows points.
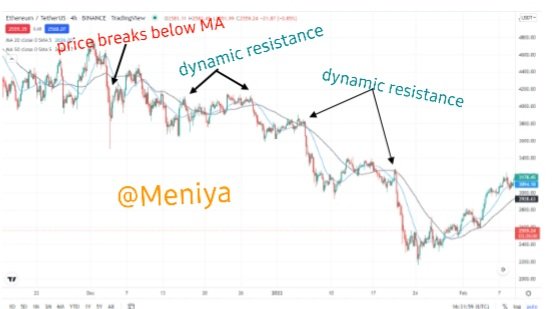
Again, when the price action breaks below the MA lines, a downtrend movement is observed as the price moves in a downward direction, here the MA indicator serves as a dynamic resistance level. This can be illustrated with 20MA and 50MA periods on a chart.
The chart above shows, MA line serving as dynamic resistance to downward movement of price, as price rejects the MA line and bounces off after each pullback thus maintaining a bearish trend and the continous formation of lower highs and lower lows points on the chart due to high selling pressure from traders in the market.
<3>Identifying False and Successful Breakouts.
Breakouts occur in trading when there is either high buying or selling pressure in the market. This phenomenon is usually observed after a strong trending market, as the price gradually reduces, traders begin to accumulate assets and momentum, just before a trend reversal occurs. When the price action crosses above or below a resistance or support level it indicates a trend continuation or the beginning of a trend reversal. Most traders take advantage of any breakout in the market to take an early enter position.
•Successful Breakouts
Breakout occurs mostly at support and resistance levels as they are key areas to note in trading. These denotes a high level of liquidity and depicts traders interest, as buyers and sellers tends to compete as to which participants will be in control of the price during this period. When there's a high demand than supply the price tends to breakout in an upwards direction. Also, when the supply is higher than demand the price tends to breakout downwards. A successful breakout is of two forms; Continuation breakouts and Reversal breakouts
Continuation breakouts
Continuation breakout usually occurs in the same direction as the overall trend. For instance, if the trading price is in a downtrend movement and a breakout occurs at a support level, the price can easily continue with bearish trend depending on the momentum of the traders. The continous downward price movement can now form a minor support level and retest the broken support level (now turned resistance level) and then continous to move downwards as the original trend(downtrend).
From the chart above, we can see a better illustration of a continuation breakout during a downtrend. Here, price broke below the horizontal support level which signals a change from bullish to a bearish trend, as the price maintained a continuous bearish trend movement, with the formation of consistent lower highs and lower lows. It is believed that the more the number of times a level is tested, the greater chance a price breaks out of that level.
•Reversal Breakouts
The reversal successful breakout is the reversal of continuation successful breakout. This breakout is characterized by a change in trends which leads to the beginning of a new trend. For instance, if a price is trading in a bearish trend and a breakout occurred above the latest lower high point (which is the new resistance level) and moves continuatiously in an upward direction, this simply signals the beginning of a new trend ( from bearish to bullish trend) due to break of resistance level, we can say a reversal breakout has occurred.
From the chart above, a reversal breakout is seen to have occured,as the price breaks above the horizontal resistance zone, which was furthet preceded by a trend reversal (bearish to bullish).
☆False Breakouts
A false breakout is the movement of price above support level or below resistance level that looked genuine but within a glimpse the price retraces back to it's previous level. False breakouta usually occurs in a ranging market as traders awaiting for the slightest opportunity to accumulating liquidity when a price break is false. Most atimes false breakouts are engineered by the whales in the market to generate more liquidity for their own interest and tricking other retail traders in opening a trade position in the market.
To further illustrate false breakout, I'll show a false breakout of the resistance level from the chart above. As we can see the price was trending upwards and a resistance level was formed, the resistance level was retested again until the price broke out above the resistance level, at this point is known as a false breakout point, as a price reversed downwards below the resistance level to a downtrend movement.
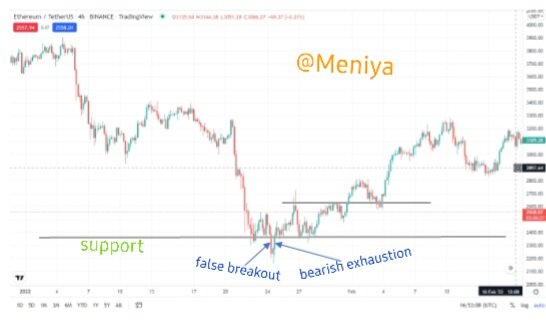
A false breakout of the support level on the chart above. Here, the price breaksout of support level for a continuous bearish movement. After a while a trend reversal is observed as the price retraces back to the support level and broke above it in an upward movement. This breakout is considered false as it didn't return to the overall trend. In order to identify a successful breakout and false breakout, more experienced and advance trading skills is required in order not to fall prey to false alarms in the market created by big traders.
Use Volume and RSI Indicator Combined with Breakouts & Identify the Entry Point. (demonstrate with screenshots).
The combination of breakout with Volume and RSI indicator to identify an entry in the market is a better trading strategy for traders, as it will help to reduce false breakouts and give a better confirmation in identifying a breakout. RSI indicators are momentum-based indicator that indicates when an asset is overbought or oversold in the market, this gives traders a signal to trend reversals in the market.
By default, when RSI is above 70, asset price is said to be overbought signals a potential bearish reversal is expected and when an asset price is below 30, it is said to be oversold and signals a potential bullish reversal is expected too. More importantly, the centerline of the RSI (50) serves as a support and resistance level to asset price, which is also marked as a signal spot in the market.
The volume indicator on it's own is useful technical analysis tool that shows the level of supply and demand of an asset in the market. The volume indicator shows the volatility of an asset price, when there is low volatility in the market a decline in volume with short red coloured bars on the chart signifying a bearish momentum. Also, when there's high volatility in the market, we can see higher volume with long green colour bars, signifying a bullish momentum in price. I'll be illustrating a Buy and Sell entry using the combination of breakout with Volume and RSI indicators on a chart below.
Buy Entry
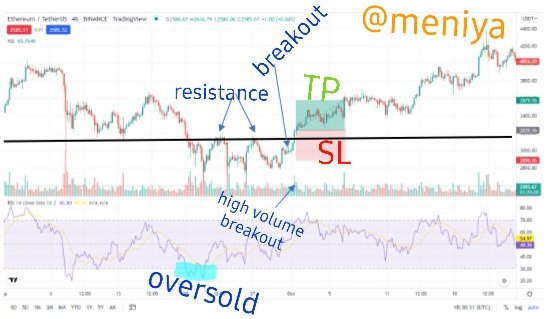
As we recall, a breakout can be a continuation or reversal breakout. From the chart below, we can observe a slow decline in price before the breakout, this is carefully indicated on the chart with the short bars volume indicator(red) signalling low volatility in price and the RSI line is above 50 signalling trend reversal from bearish to bullish and also serving as support to the price.
This chart above, shows a clear reversal breakout strategy on ETH/USD chart, which is confirmed with both the RSI and volume indicator. Once the breakout occured a change in price occured as a high volatility was observed with an increasing volume bars(green), at this point one can take an entry after the breakout candle, with the stop loss placed below the resistance level.
Take a Real Trade(crypto pair) on Your Account After a Successful Breakout. (transaction screenshot required).
Here, I will carry out a real transaction on a crypto pair if KNC/USDT after a breakout. This will be done on Tradingview.com platform and the trade will be executed on Binance exchange.
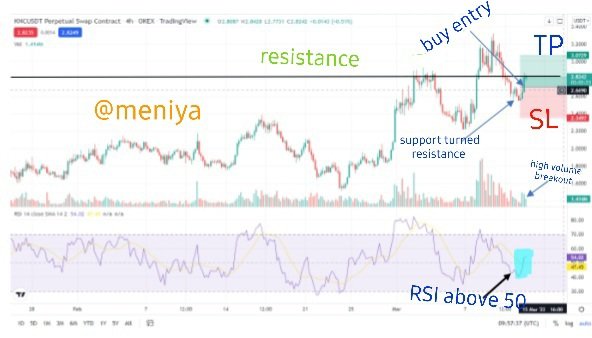
KNC/USDT 4h chart
From the KNC/USDT chart, I noticed that price found support above the RSI center line(50) which signals bullish interest in the market, and Looking at the volume indicator, I noticed an increasing volume with a long green bar which also signals a high buying pressure and volatility in price of KNC, so i opened a buy trade using the confluence from the RSI and the volume indicator as a technical analysis tool. Taking a risk-reward ratio of 1:2 the long position with stoploss placed below the new resistance level.
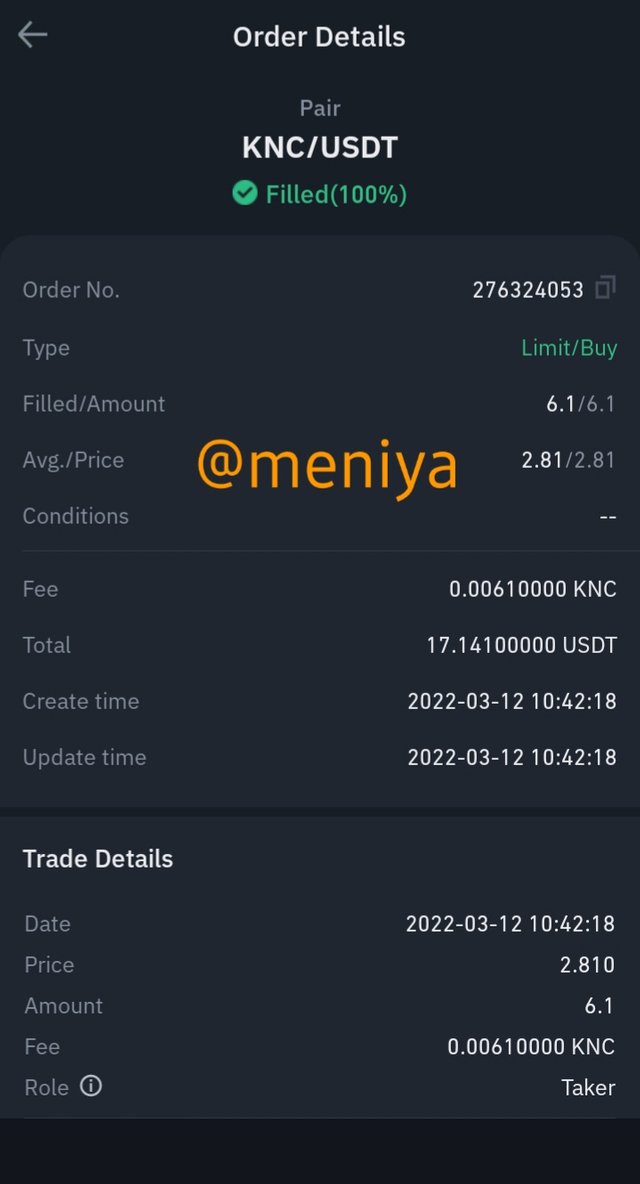
Image From Binance platform
Limitations of Support and Resistance.
Considering the fact that everything has it's own setbacks, so also support and resistance has some limitations that makes it a bit difficult for a trader to completely rely on alone while trading in order to avoid or reduce the risk of havig false breakouts or false signals in the market. One major limitation of Suppot and resistance level have seen so far is that of false breakout. The use of support and resistance level alone in trading can sometimes lead to loss to traders especially newbies, as sometimes support and resistance levels can create a false signal as the market due to the fact that the market highly volatile and very unpredictable, and can be manipulated by some big traders in the market to cause a false signal or breakout.
The identification of a successful breakout is usually difficult after a range occurs in the market, sometimes price breaks out of a level to create false breakout which can mislead traders into believing that the price will continue in the direction of the breakout, but when closely and carefully observed we tend to see price pullback below the level to hit a stop loss. This happens mostly after a breakout candle, thus causing a false breakout.
As a means to help filter false breakout, it is advisable for traders to use other technical analysis indicators in combination to support and resistance trading strategy, to have a better confirmation of a breakout before taking any trading decisions. As a control and checker, a trader should always be patient to see the price reactions and it retest the broken level and reverses back to get a good confirmation.
Conclusion
Support and resistance are key levels of tradding in financial and crypto markets which serve as a pivotal tool for technical analysis when making a trade decision. Support and resistance levels are created by the reaction of traders in the market around the sensitive price area, these levels can give a signal to a new trend or the continuation of a current trend or if there will be a trend reversal depending on the price momentum and volatility of asset in the market. There are different types of support and resistance levels but the widely used one is the horizontal support and resistance levels, although is a bit technical and requires more skill and knowledge while applying it for an analysis.
A breakout is ban to occur above or below the S & R areas during a strong trend, as the price can break these levels to either continue in its original trend or in a reversed trend. The breakout of S&R levels can serve as a signal to take an entry or exit in the market, although it is advisable for one to combine other technical analysis tools like volume indicator and RSI indicator in confirming a breakout before taking any trading decision.
Thank you professor @shemul21 for this educative and interesting lesson. Looking forward to your next lesson.
