Hello steemains, glad to be part of rhis week lesson by prof @shemul21 on "Crypto Trading using Moving Average Indicator." Below is my task.

Q.1). Explain Your Understanding of Moving Average.
Moving Average is a technical indicator tool used by crypto traders in carrying out technical analysis of the market. These technical indicators are principally of two types; lagging Indicator(these indicators move after there is a change in asset price) and Leading indicator(this indicator moves before a change in price occurs) of which Moving average indicator is classified as a Lagging indicator, as the MA indicator follows the price movement of an asset in the market to produce a trend signal or determine the direction of a trend or price data within a specific period. Moving Average indicator shows a trader the average data of the closing price of an asset which is represented on a chart, within a specific period of time.
Moving average indicator continously recalculates average price data with the use of the current price data in the market, this is done by adding up the price data of an asset over a specific period of time and then divide its total sum by the number of data points to get the average value of price of an asset in the market within a specific time period.
Moving average indicator is one of the most widely used and common indicator by many financial traders and crypto traders as it works with the current price data to predict the future price direction.The moving average indicators are seen on many trading platforms like TradingView, with different time length like 9, 20, 30, 50MA's and can be easily configured to a traders taste. Some unique benefits of Moving average Indicator are;
• It gives the average price data of an asset.
• It gives more information that helps traders determine the future direction of an asset price.
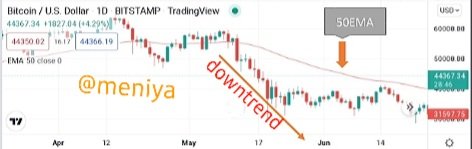
• It indicates trend directions and reversals in the market. The chart below shows a downtrend direction on the chart using Moving average exponential at 50period settings.
• It helps eliminate price fluctuations noise in the market, by effectively indicating entry and exit trade points.
• It indicates support and resistance levels on a chart
Q.2). What Are the Different types of Moving Average? differentiate Between Them.
From the lesson by professor @shemul21, there are three effective moving average indicators, which include;
Simple Moving Average (SMA) Indicator.
Exponential Moving Average (EMA) Indicator.
Weighted Moving Average (WMA) Indicator.
☆Simple Moving Average (SMA)
The SMA Indicator is the simplest form of moving average indicator, it gives the average price of assets within a specific time period, this is achieved by taking into consideration all the asset prices in order to help traders get the true average values of an asset price and which helps in indicating the direction of trends. Once a new candlestick is formed SMA indicator shifts it's position. When the asset price moves above SMA line on the chart it indicates a uptrend, and when the price is below it indicates a downtrend. SMA indicators are used by traders to help generate trading signals in th market, to know when to make an entry or exit trade.
The formula for calculating SMA Indicator is thus as follows;
SMA = (A1 + A2 +...+An) / n
Where:
•A= Average price data points over a specific time period.
•n = number of periods taken into consideration.
☆Exponential Moving Average (EMA)
EMA Indicator gives more weight to the recent price data in a recent trend. EMA Indicator takes more consideration on the current price changes, as opposed to simple moving average that considers equally all prices. EMA Indicator uses the current price data to calculate and show the direction of the trend, and gives a more better average data. When the EMA Indicator line rises above the price point it gives a bullish signal and it falls it indicates a bearish signal. Exponential Moving Average also gives an entry and exit trade points in the market. The formula for calculating EMA Indicator is given below.
EMAc = [ Cp × (s/1+n)] + EMAp × [1 - (s/1 + n)]
Where:
•EMAc is the, current EMA
•Cp is the, current price
•EMAp is the, previous day EMA
•s is the, smoothing factor
•n = period (that is number of days taken into account )
☆Weighted Moving Average (WMA)
Weighted moving average Indicator adds more weight to the current price data and less wight to the previous price data, as the recent data reacts faster to the current price. It helps traders effectively determine the direction of price movement and market trend by taking into consideration the recent price data than its previous data while calculating the average price data. The average price value is calculated by multiplying the current price data and sum up the resulting data to get the average value. Weighted Moving Average Indicator is more complex than the other moving average indicators and is more effective for traders who carryout short term trades.
The formula for calculating WMA is as follows:
WMA = (Price1 × n + Price2 × (n-1) +...Pricen)/ [ n × (n+1)/2]
Where:
•n is, the Period(number of days counted)
DIFFERENCE
| SMA | EMA | WMA |
|---|---|---|
| It weighs and considers all price data equally | It considers and weighs the most current price data than the previous data | It weighs and considers only the most current price data |
| It requires a longer time period to identify trends | It requires a short period to identify trend reversals | Both long and short periods are ideal for identifying trends and trend reversals. |
| SMA with high values are efficient and trustworthy | EMA with low values are more trustworthy | WMA with both high and low values are more efficient and trustworthy |
| SMA is basically simple and slow indicator | EMA an average indicator and faster than SMA | WMA is the fastest and more complex MA indicator and gives more detailed information |
Q. 3). Identify entry and exit Points Using Moving Average. (Demonstrate with Screenshots).
Moving average indicator is one of the most widely used technical indicator in identifying an entry and exit points in the market while trading, as such it is vital for all traders to be abe to understand and use it. One of the factors to look out when identifying an entry and exit point is to know the current trend in the market.
In this post, I'll be using two types of moving average indicators, SMA50 and EMA20 to illustrate how entry and exit positions can be identified in the market. I'll be using SMA50 as a control to determine the price direction and the EMA20 will be used too as it gives a clearer view of traders interaction to price, because it reacts faster than SMA to price data. When in a strong uptrend, the asset price trades above SMA and the EMA retraces downwards in search of a buy postion. Prices moves downwards to the moving average indicator to get support to secure a buy postion, after which price reversal occurs.
Entry point
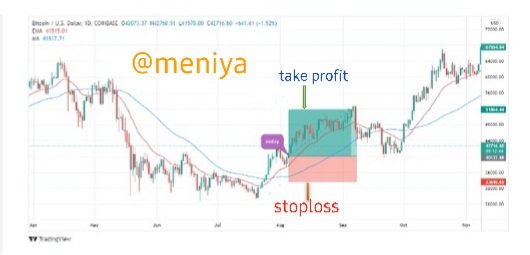
From the BTC/USD chart above, the market is in an uptrend direction with asset price action moving above 50SMA and 20EMA. Once the asset price breaks out above both the 50SMA and 20EMA, this point is called an entry point. Here the price falls on 20EMA for support.
Exit point
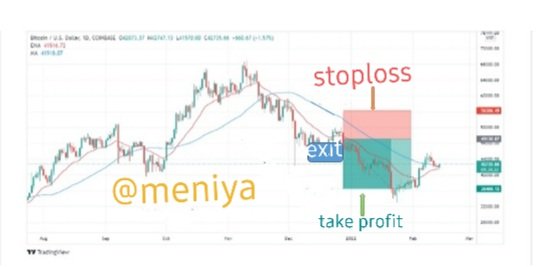
Source
Using same 50SMA and 20EMA on chart above to identify the exit trade point, first the currenct trend in the market is in downtrend. The price action is seen below both 50SMA and 20EMA, showing a price reversal from bullish to bearish trend, which indicates an exit point. The price reversal is due to the buyers pressure in the market. As the price breaks below 50SMA it served as a support to the price.
Q. 4). What do you understand by Crossover? Explain in Your Own Words.
Crossover in crypto trading an event that occurs when two corresponding indicators with different period cross or overlap each other on a chart. When a crossover occurs it gives a signal in identifying trend reversal, price reversal and the occurrence of price action breakouts. Moving Average Crossover involves the combination of two moving averages, a slow moving average and a faster moving average. The fast-moving average reacts to price faster and better than the slow, as it requires only a few data points when identifying a crossover unlike the slow moving averages that needs more data points for calculation.
The crossover strategy is a good technique used by traders to identify an entry during price reversal and this strategy works best in a trending market. The moving average crossover is not all effective in a sideways market, as it can lead to a false price information which will result to a trader lossing out. Traders are able to configure the slow and fast-moving average based on their market strategy, a scalp trader might choose to use EMA 9 and 20periods for some mintinues trade, while a day trader might use EMA 25 and 50period, but overall it is advisable for a long term trader to use EMA 50 and 200 periods.
Crossover is identified based on the these principles;
• When the faster-moving average crosses above the slow-moving average, it indicates a trend reversal from bearish to bullish which is a good signal to find buy position in the market.
• Also, when the faster-moving average crosses below the slower moving average, this indicates a bullish to bearish trend reversal and gives an opportunity to take a sell position in the market.
I'll be explaining moving average crossover with two types of Crossovers; Golden Cross and Death Cross.
☆Golden Cross
Golden cross is a bullish breakout crossover that occurs when a low or short period of a MA crosses above a high or long MA period thus signalling a potential bullish trend. For instance, I'll be using EMA50(low) and EMA200(high) on the chart below to illustrate a golden cross.
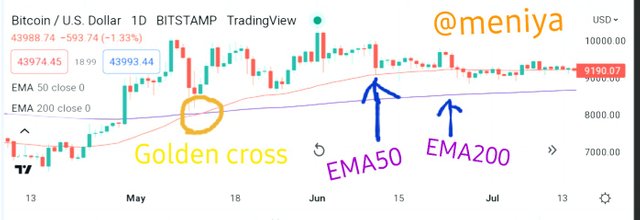
From the chart above, we can see the EMA50 cross above the EMA200 and the asset price breaking out over the resistance level, signalling a bullish trend at this point a golden cross has occurred.
☆Death Cross
Death cross occurs when the lower MA period crosses below the longer MA period, thus signalling a potential Bearish trend.
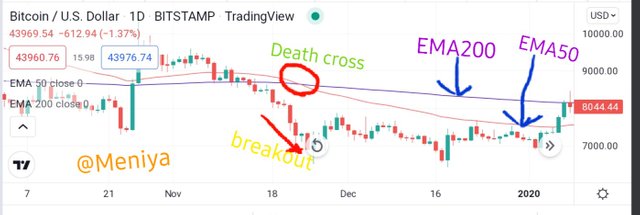
From the chart above using same EMA50(low) and EMA200(high), it is observed that the slow EMA50 crosses below the fast-high EMA200, indicating a potential price break below support level, thus signalling a Bearish trend, at this point a death cross is said to have occurred.
Q.5) Explain The Limitations of Moving Average.
Earlier in this post I outlined some benefits and usefulness of moving average, however it also important to note that technical indicators are not all that reliable when used as a standalone trading analysis. Moving average indicator also has some limitations to its use, some of the limitations are as follows;
•Moving average indicator majorly relies on previous price data points for its calculation and doesn't take into consideration other price details like open,high or low price data or factors that may affect the average price calculation.
•The moving average as a lagging indicator is more concerned about historical price data points, this can lead to false price information. A trader might be misled by the information into opening a buy or sell position, when a price reversal has long occurred.
•Moving average indicators calculates average price data based on different historical periods which gives different results, and can mislead a trader while making an entry or exit points. As no accurate period is observed when trading with MA, traders determine MA period on their own discretion and when a trader chooses a period in a wrong timeframe it can cause a false trading signal.
•The use of moving average indicator in sideways market is not effective, as MA is not able to identify useful price information. It is more effective in a trending market.
Conclusion
Moving Average indicator is one of the best technical analysis tool used by traders to identify trend reversals and price movement with ease. Moving Average indicator is a lagging technical indicator that shows more interest on historical price data in its calculation. There are different types of Moving Average indicator with varying periods which can also be combined to get a better price information. Although, to get the best information in the market, traders are advised to combine Moving Average indicator with other technical indicators to reduce any false signals from the indicator to prevent loss while trading. Moving average indicator as a Lagging indicator doesn't work perfectly well when used alone and this is one of its limitations.
Thank you professor @shemul21 for an interesting lecture this week.
@tipu curate
Good job
--
This is a manual curation from the @tipU Curation Project.
Downvoting a post can decrease pending rewards and make it less visible. Common reasons:
Submit
Upvoted 👌 (Mana: 3/6) Get profit votes with @tipU :)
Downvoting a post can decrease pending rewards and make it less visible. Common reasons:
Submit