Hello cryptoworld, I'm delighted to be part of the first week of season 6 cryptoacademy series. Quite an interesting and educative lesson by professor @dilchamo on "Effective Trading Strategies using Line Charts". Below is my task entry.

Q.1) Define Line charts in your own words and Identify the uses of Line charts.
Line Chart
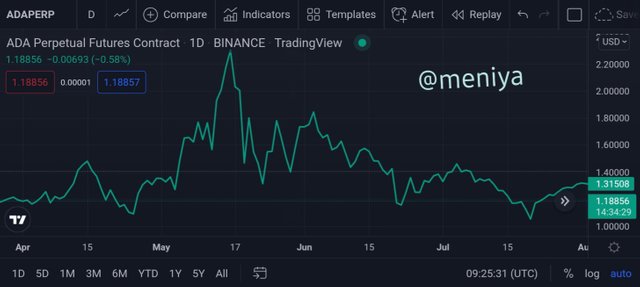
Line chart is a type of chart that shows the trend of price of an asset in the market over a period of time. These price are represented as data that are connected on a single line on the chart and hence the the name line chart. Line charts are the most common type technical analysis tool used by traders in making trading decisions. It is user friendly especially for beginners as it gives a simpler view of price movement in the market. Unlike other charts like Japanese candlestick or bar charts that are more complicated and a bit technical to understand the movement of price with its data representation.
The line chart are used to display historical price data of an asset in the market and connects these historical price data in a single line, which further connects with the present price to give more detailed information about the market. Lines charts are plotted with the closing prices of an asset connected in a simple oscillating line, which makes it much easier easy for traders to read and understand the market within a specific period of time, with the help historical price data and the closing price of an asset, in order to make a good decision while trading. The use of closing price of an asset in creating a line chart makes it easier for traders and also greatly reduce the amount of noise in the market, when traders becomes worried about knowing what the high, low or opening price of an asset in the market.
Uses of Line charts
•Gives a simpler insight of price movement;
Line chart are the most commonly used technical tools by traders because of it's simple representation of price movement in the market, which help traders especially beginners to easily identify the present price trend of an assets with the historial price data and gives an insight to the possible price movement of an asset to help make best trading decisions.
•Give key information like support and resistance levels and trends in the market;
Line charts are vital technical tools used by traders to get key information about the resistance and support levels in the market in order to understand the price movement and identify the level of supply and demand in the market. These information are easily identified with line charts, since the closing price of the asset is a vital aspect of price movement and is used in ploting a line chart. With this traders are able to easily get key details of price trends, support and resistance levels in the market, and thus greatly mitigate the noise in the market.
•Used to make better trading decisions:
Line charts in combination of other technical tools or indicators gives more trading information to traders, which helps in making better trading decisions and also gives more information of better trading opportunities to make more profits.
Q.2) How to Identify Support and Resistance levels using Line Charts (Demonstrate with screenshots)
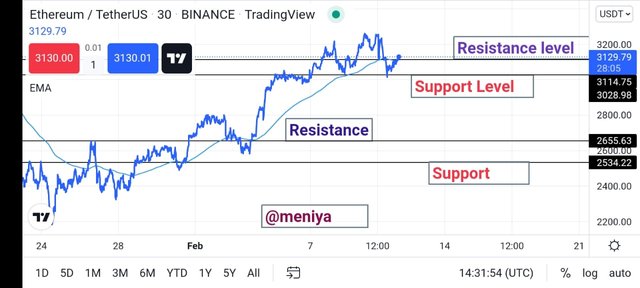
The use of line charts in identifying support and resistance levels are relatively easy and simple. Been that line charts uses the closing price of an asset historical price to connect to the present price, this clearly shows resistance and support areas in the market. Line charts are used in identifying support and resistance levels by simply connecting the high and low swing of previous prices on a straight line, this line is further connected to the present price and exceeded into the future. These statistics helps traders understand the market more. Resistance and support areas represent where there is a high selling and buying pressures in the market, once these areas are identified by a trader it helps in making better trading decisions, it also shows when there is is a price reversal in the market. When using line charts to identify resistance and support levels the price changes should be recorded up to three or more times in previous time and compliments the current price in the market.
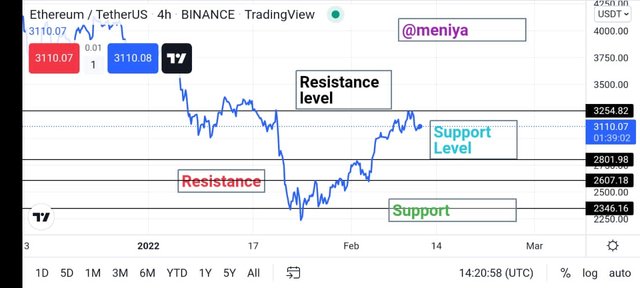
A line chart showing Resistance and support levels
•Resistance level using line chart
Resistance level is a point that where there is a high concentration of supply in price, which causes a break in price uptrend if an asset temporarily. This occurs due to the high selling of assets in the market in order for them to take their profits and leave, rather than incurring a loss. It is pertinent for traders to always note the time frame of when resistance level occurs, this helps in showing the strength of resistance in the market. Resistance levels of short time frames should be regarded as irrelevant compared to when resistance level is identified within a long time frame of days, weeks or months. Resistance level can lead to a trends reversal of from bullish trend to bearish trend.
•Support level using line chart
Support levels is an area of concentration of demand in the price is an asset. It is an were strong buying power is noticed as there are more buyers now and prices always reverses to the upwards. Traders uses support level as a benchmark or risk management tool, to know the profit positions in the market for a sell trade to occur. A break in support levels can occur to reduce the price of an asset, which can lead to a bearish trend. A support level with a long time frame is more effective for trading than a short timed support level.
Q.3) Differentiate between line charts and Candlestick charts. ( Demonstrate with screenshots)
1. Price data representation;
Line chart makes use of a single oscillating line plotted with the closing price of an asset at a specific period in data presentation of the market. Its data representation is relatively simple and easy to read.

Line chart
While, Candlestick chart makes use of candlesticks to represents price movement of an asset in the market, which is plotted using key data like opening price, closing price, high price, and low price of an asset within a specific period. Thus making its data relatively more detailed than with line charts.
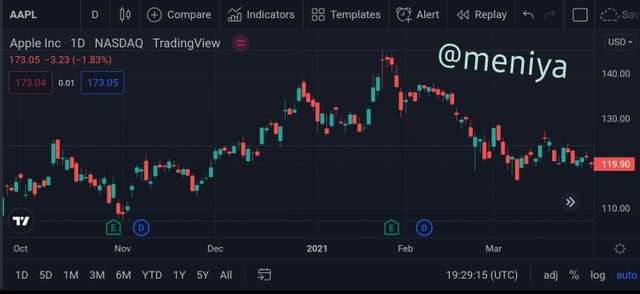
Candlestick chart
2. Simple to use and understand;
Line charts are very easy for traders especially beginners to understand the market and make profit when trading since it's simple to interpret. While, Candlestick charts are not beginners friendly as its a bit difficult to understand and read the price movement in the market, and this will make it difficult for beginners to make good profit while trading using the candlestick chart.
3. Market noise control;
The use of a single oscillating line to show the price movement of an asset in the market helps reduce noise in the market, as the single line data representation gives a simple and clear direction of what the price of an asset is and can also show its future price movement with much noise. While, the candlestick chart creates much noise and chaos in the market, due to the use of candlesticks with different colours representing different trends(bearish and bullish) in order to identify the price movement of an asset within a specific period.
4. Identification of key points in the market;
The identification of support and resistance level are easy with line charts, as key swing points showing resistance and support levels are easily identified. While with the use of candlestick chart in identifying resistance and support levels is a bit technical due to the pattern of data presentation, as such traders ought to critically study the wicks of the candlestick in order to easily identify the resistance and support levels.
Q.4) Explain the other Suitable indicators that can be used with Line charts. (Demonstrate with screenshots)
For this question, I will be combining Moving average indicator(MA) with a line chart. Moving average is an indicator that follows trend patterns represented with a single line on the chart, it looks similar to the line charts thus making it a good confirmatory tool to know the markets trends, give good trading signals and price movement when combined with line chart. It is also a unique indicator that can indicate support and resistance levels on the chart and can easily indicate trend reversals in the market.
When there is a break in price of an asset below or above MA indicator line a trend reversal is said to have occured. Because MA indicator in combination of line charts are easy to identify trend reversal, traders always used them as its creates better opportunities for traders to to take more profits and incur less loss by placing an early long buy trade or placing a short sell trade.
Illustrarting trend reversal with moving average on a line chart
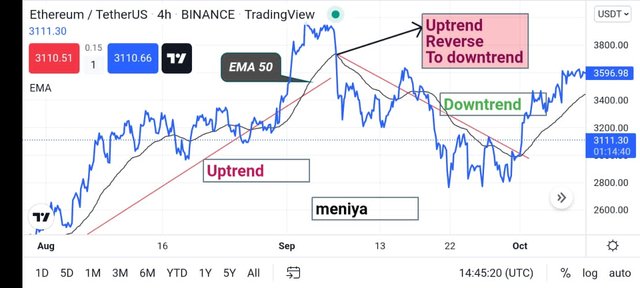
From the chart above, we can see a clear indication of trend reversal. From the left area of the chart we can see how asset price started trading below the MA line indicating a downtrend. Suddenly a break occured as the asset price moved above the MA line showing an uptrend movement indicating a trend reversal. When the break occurred traders usually utilize this opportunity to make an early long buy position to buy more asset at this point knowing there will soon be a reversal in price, to make more profits afterwards.
Illustrarting support and resistance level with Moving average on Line Chart
As earlier stated, to Identify support and resistance using MA indicator is relatively simple to know. The easiest way to Identify both levels is to observe when the MA line touches or crosses the asset price. When a strong trend is observed in the market, the asset price returns back to the MA line in order to find support and resistance levels before returning back to it's original trend, this is a great signal and opportunity for traders to enter a early trading position in its original trend direction following it's previous or initial trend.
From the chart above, we can see how the MA indicator serve as a indicator for support and resistance levels on the line chart. When the price is in a downtrend direction, the price moves above to find resistance at the moving average line. After which the price reverses in downwards in continuation of the downtrend movement. During an uptrend movement prices returns below the MA line to find support and then continue in uptrend direction.
Q. 5) Prove your Understanding of Bullish and Bearish Trading opportunities using Line charts. (Demonstrate with screenshots)
Trading opportunities using line chart
For a trader to be able to Identify trading opportunities using a line chart, the trader should be able to identify trade trends as this in conjunction with other trade indicators can help to better identify good trading opportunities to make good profits. For this question, I'll be illustrating my own understanding by using line charts in combination with moving average indicator.
Bullish trading opportunity using Moving average indicator
An uptrend movement of price is a significant signal for a bullish trading opportunity(that is when the asset price is in an uptrend direction above the moving average). Also, when the asset price breaks above the MA line, it gives a trader a trend reversal signal, showing a reversal in trend from a bearish to bullish trend.
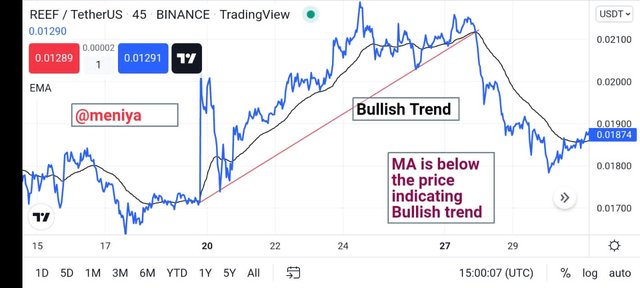
In the chart above, i have been able to identify a bullish trade opportunity using the moving average on a line chart. As you can see, there's a break in price, as the price moves above the MA line, signalling a shift in trends from bullish to bearish trend. From this point, trading opportunities are open for traders as there are more buyers in control of the market. Usually, the stop loss is placed below the previous low (MA line) and take profit above. Making a trade at this point will yield more profit as it has a risk-reward ratio of 1:3.
•Bearish trade opportunity using Moving average
In identifying bearish trading opportunity, the asset price is expected to be in a downtrend direction, as the trading prices moves below the MA line. When there is a break in price of an asset below the moving average line, it gives traders a signals to a trend reversal in the market, from bullish trend to bearish trend. With this information traders can be able to identify bearish trade opportunities, at this point there are more sellers who are willing to bring down the asset price.
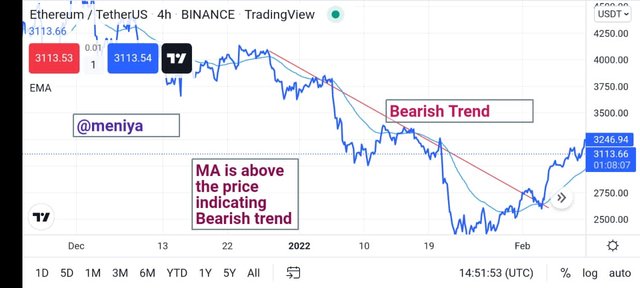
In the chart above, shows a bearish trade opportunity as identified using the moving average indicator on line chart. There is a break in price,as the asset price moves below the moving average line which gives a trend reversal signal, from bullish to bearish. After which, the price retraces back to find resistance on the moving average line, indicating a sell trade opportunity with the sellers in charge of price. Here, the stop loss is placed above the previous high(MA line), and take profit was placed below, after the trade was successful when a cross occured.
Q. 6) Investigate the Advantages and Disadvantages of Line charts according to your Knowledge.
Advantages
•It is simple and easy to use. Its data representation are relatively clear to understand, as it uses only one factor in plotting, by connecting the previous closing prices on a straight line, hence making it easy for traders to read the chart.
•The use of only the closing price data to plot the charts greatly reduce price fluctuations noise in the market and provides better smooth trading signals for traders especially to newbies.
•The line chart easily identifies key swings like resistance and support levels in the market. Unlike with the use of candlestick charts thwt is more complex and difficult to identify these levels due to also taking the candle wicks into consideration before been able to identify these levels.
•Line charts in conjunction with other indicators gives a clearer view for better trading opportunities. The integration of line charts and indicators like moving average and relative strength index improves trading signals and gives better trading opportunities, and enhance learnining process for newbies.
Disadvantages
•The line charts doesn't provide well detailed information about price movement for traders to make a good trading decision, as it use only the closing price of an asset in determining and predicting asset price movement in the market which is not enough. Unlike other charts that put into consideration the high, low and opening price of an asset in order to get a more detailed information of the market.
•The line chart are not suitable for short-term trading. The use of line charts for short timeframe can lead to chaos in the market due to price fluctuations and this can lead to a loss for traders.
•Line charts alone can't give good trading signals and opportunities, except in conjunction with other indicators.
Conclusion
Line charts are graphical representation of price data presented on a single line, in indicating the price direction of an asset over a specific perod. The representation of price movement with line charts are relatively simple, easy to read and understand. Traders gets clearer view of trading opportunities in the market with line charts and other indicators, are also able to identify key swing points and are able to predict future prices movement in order to make good trading decisions to make more profits.
Thank you professor @dilchamo for an interesting and broad lesson.
N/B: All screenshots were taken with my system and phone from my Tradingview account platform