Hello Steemians, glad to be part of this week's lesson by professor @abdu.navi03 on "Trading strategy with RSI and ICHIMOKU". Below is my task for this lesson.

Q.1) Put your understanding into words about the RSI+ichimoku strategy.
One integral aspect of crypto trading and financial systems is the use of technical indicators, these indicators are tools used in technical analysis of the market, which helps traders understand the market trends and make good decisions to make more profits rather then incurring losses when trading. However, the use of technical indicators are no doubt helpful technical analysis tools in crypto trading but if used alone fir an analysis could lead to a fallacy as it can give a false signal in the market, as such if is advisable to augment these technical indicators with other technical analysis tools to get a more effective trading analysis of the market and avoid any false signals. When they are combined they form a better trading strategy, just as we have seen from this lesson.
RSI (Relative Strenght Index)
The RSI, meaning Relative Strength Index is a technical indicator and momentum-based indicator that measures momentun of price movement to determine if an asset is overbought and oversold in the market.
RSI indicators are usually represented by with an oscillating line graph below the chart, with values range of 0-100. RSI values of 0-30 indicates an asset is oversold, and a value of 70 and above indicates an asset is overbought. RSI indicator are liable to give a false signal when used alone for a trend movement in the market as it only gives the range of assets in the market.
Ichimoku cloud indicator
The Ichimoku or Ichimoku Cloud indicator is also a technical indicators created by Goichi Hosoda in 1968, it is trend based indicator that gives a better understanding for traders to understand and determine price direction in the market, and also helps traders identify future dynamics of support and resistance levels, as well as trend direction in the market. The Ichimoku indicator uses price averages to create a graphical representation on the chart. One unique feature of Ichimoku indicator is the cloud it produces, which helps traders forecast where the support or resistance level is and gives signal strength in the market.
The Ichimoku indicator is made up of five lines (a 9 period average, twenty six period average, a mixture of the two averages, a 52 period average, and a lagging closing price line) that serves as the moving averages of previous price data points, and two of this line forms a cloud. The cloud is an integral part of this indicator. When the price action is below the cloud it indicates a downtrend and when the price action is above the cloud, it indicates an uptrend. A break above and below the clouds is an indication of a trend reversal and an opportunity to open a buy/sell position in the direction of the breakout. Also, the Ichimoku cloud serves as support and resistance levels in the future, that will help traders spot price reversals easily.
The combining of RSI and the Ichimoku indicator results in a more sophisticated trading strategy to help traders determine asset price movement and gives strong strength signals to know the trend movement in the market, so traders know when best to make an entry and exit the market, in order to minimize loss.
Q.2) Explain the flaws of RSI and Ichimoku cloud when worked individually.
As we know nothing is perfect, so all is RSI and Ichimoku cloud indicators have their own flaws that limits their efficiency.
RSI FLAWS
As earlier stated, relative strength index indicator is momentum based that only indicates the length of asset price by catergorizing them as either overbought or oversold conditions, and lacks vital factors necessary to evaluate whether these conditions signals a good trading opportunity in the market. RSI indicators reveals price distance and the strength of buyers and sellers in the market and helps traders understand which side is losing momentum or us in control of asset price in the market. Thus making RSI an ineffective technical analysis tool in confirming an entry or exit point before excuting any trade. It is bascially useful as a preliminary indicator for determining trade possibilities.
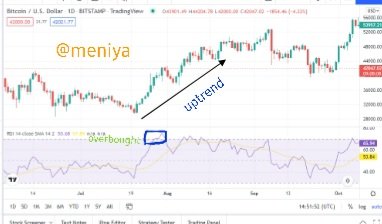
RSI indicators are also limited to trends in the market because of it's inability to reveal strength of strength. As I earlier said, that an RSI of 70 and above indicates a bearish movement, but it can give a false signals, as during a strong trend in the market, RSI can still be in the overbought region and won't show how far the trend can go.
As we can see from the chart above, RSI indicator is not able to measure the buying pressure in the market and how far the trend will go. Thus making RSI an ineffective and wrong choice when used alone in a trending market.
ICHIMOKU CLOUD FLAWS
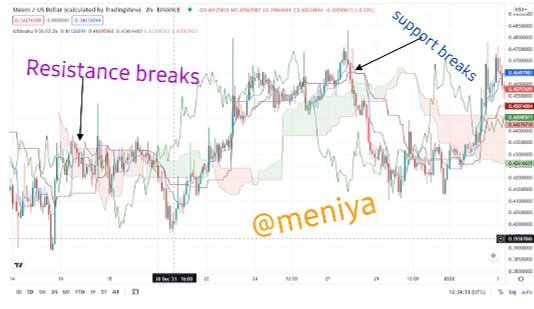
The Ichimoku indicator also has its flaws, despite the fact that it was designed to give several price informations like trend movement, momentum, trading signals, and support and resistance levels in the market. Ichimoku indicator is deficient in the aspect of giving accurate recent price data, due to the fact that it works based on historical data and making price data lag behind and thus gives a trade signal late when the price has moved. The lagging nature of this indicator can mislead traders and make them enter a trade at a high price while utilizing their stop loss. The Ichimoku indicator is time deficient since it is not able to identify the starting of a new trend on time.
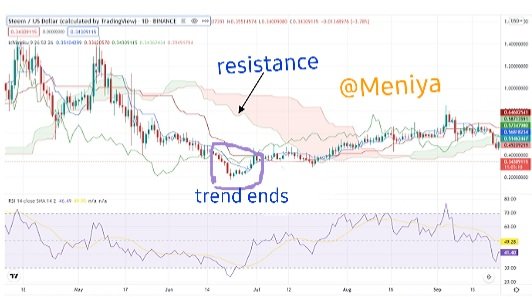
From the chart above, we can see that the asset price broke above and the cloud giving a price reversal signal, but if we look closer the asset price has already moved even before the Ichimoku cloud couod indicate the market is in a bullish trend. Another flaw is that, sometimes the Ichimoku cloud gives a trend signal when the trend has ended or is exhausted.
Q.3) Trend Identification Using RSI+Ichimoku Strategy
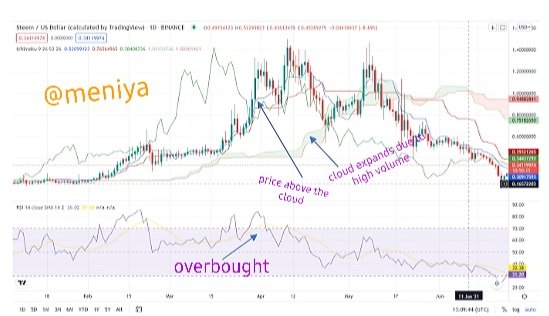
In this question, we will be looking at how to identify potential trends in the market using RSI+Ichimoku strategy. As we know, when the RSI is above 70, price is said to be in an overbought region, also when a strong bullish trend is observed RSI still remains in the overbought region. The strong buying pressure is noticed in price action, as the price continuously forms new highs.
Although, the RSI is not able to reveal the high buying volume which is causing the price action to be high, at this point the Ichimoku indicator comes into play, and so when asset price is above the Ichimoku indicator this indicates an uptrend and the high buying volume(momentum) causing the uptrend is seen in the expansion of the Ichimoku cloud. This illustration can be seen on the chart below.
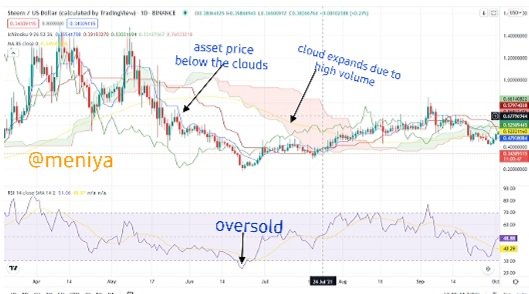
In a downtrend, when the RSI is below 30 value, it indicates that asset price is in an oversold region. When in an oversold region it can also signal a strong selling pressure in a downtrend or at the starting of a downtrend. However, the volume of asset price in the bearish market can be recognized from the Ichimoku cloud. If asset price trades below the Ichimoku cloud, it signals a downtrend subsequently the volume of the sellers is been determined using the size of the Ichimoku cloud. So the larger the cloud, the larger the selling volume.
Q.4) Using MA with RSI+Ichimoku Strategy
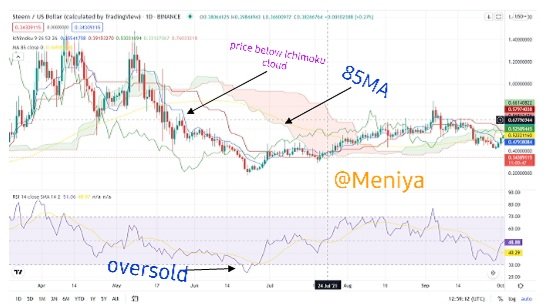
The MA indicator is also a trend based technical indicator that shows trends and trend reversals in the market, when combined with this strategy to further boasts the efficiency of the trading signal and relatively eliminate any false signals from the Ichimoku cloud. The MA period can be set based on the trader's strategy, for this section I'll be using 85MA period as discussed in the lesson, with the RSI+Ichimoku strategy.
From the chart above, 85MA period(yello line) is been added to the chart. Here, we can can see that MA indicator is in conflux with the Ichimoku cloud, as asset price is trading below the 85MA period. Hence, it gives a confirmation that asser price is in a downtrend. The combinaition of the 85MA have served as a confirmatory tool to eliminate false signals by this strategy.
Q.5) Support and Resistance with RSI + Ichimoku Strategy
Support and resistance levels are vital points on a chart, these levels represent areas of buying and selling pressures of asset price in the market. In this section, I'll be illustrating how we can identify support and resistance levels. For a trending market, the Ichimoku indcator will be used in identifying support and resistance levels, similarly RSI will be used to identify support and resistance levels in a sideways market.
•Trending Market
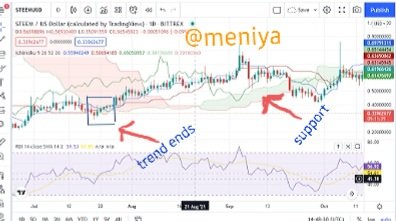
Here, the Ichimoku cloud will serves as a support and resistance level during a trending market. When the Ichimoku serves is green it indicates support and during an uptrend asset price finds support on the Ichimoku cloud. Also, when the Ichimoku cloud us red, it serves as a resistance and during a downtrend, the cloud serves as a resistance on the chart. Importantly, when asset price approaches the cloud, it indicates weakness in the current trend and signals a trend exhaustion, so also it is when price is far away from the cloud, it signals a strong trend and a breakout of cloud indicates a trend reversal. This is illustrated on the chart below.
•Sideways Market
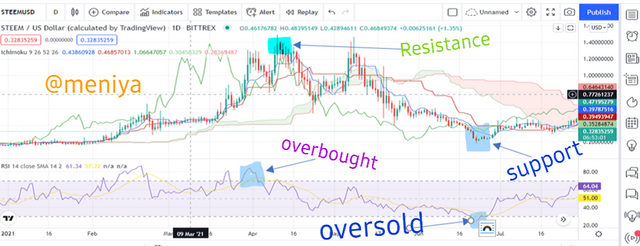
The RSI indicator will be used im a sideways market, since Ichimoku indicator doesn't give an accurate trading signal. Here, the RSI overbought and oversold regions will serve as support and resistance levels. Recall, that earlier I said, RSI reveals the price momentum which helps in spotting price reversals.
From the chart above, I'll be using RSI 30(oversold) and 70(overbought) to illustrate this. We will use RSI as support and resistance using the oversold and the overbought region. When asset price gets rejected it enters the overbought and oversold regions during a ranging market.
Q.7) Demo Trade Using RSI + Ichimoku Strategy
I'll be performing a demo trade using the strategy discussed in the lesson, I'll do a demo trade with trading view paper trading.
•XRP/USDT Buy Trade
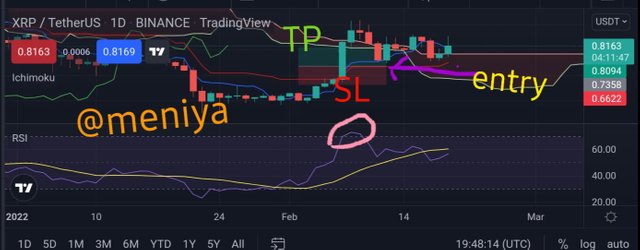
On opening the XRP/USDT chart, I noticed that the RSI has been in an overbought region within this 7days and is currently moving towards the overbought region as signals is increasing with high buying pressure. Looking at the Ichimoku cloud, the price action has broken above the cloud which signal a trend reversal from bearish to bullish. Then, I made an open on buy position.
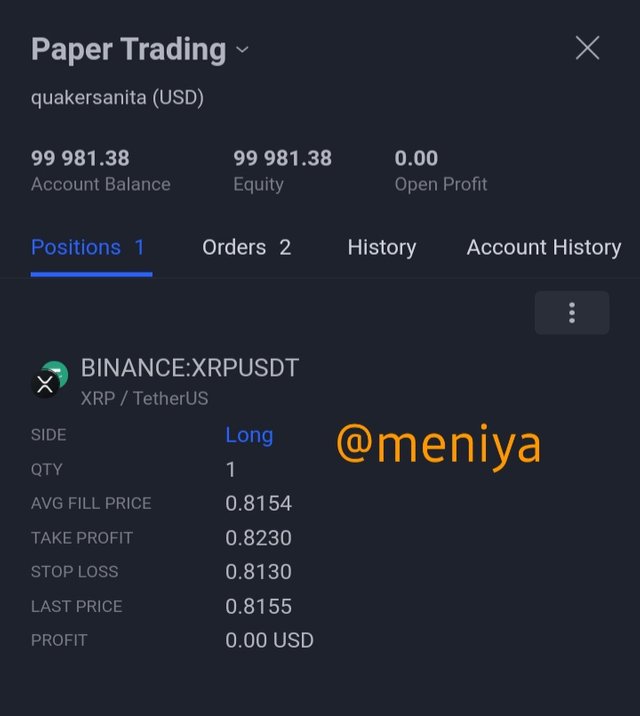
Image from paper trading view
•BTC/USD Sell Trade
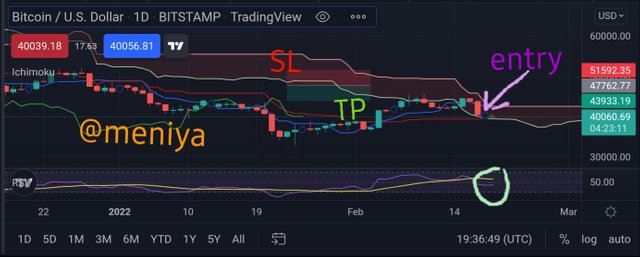
The chart above, we can see the RSI indicator line is crossed below the 60 line which shows there's bearish pressure in the market. Also from, the Ichimoku cloud, I observed that price action broke below the cloud signaling a change from a bullish trend to a bearish trend. I made a sell position with a stop loss placed above the cloud.
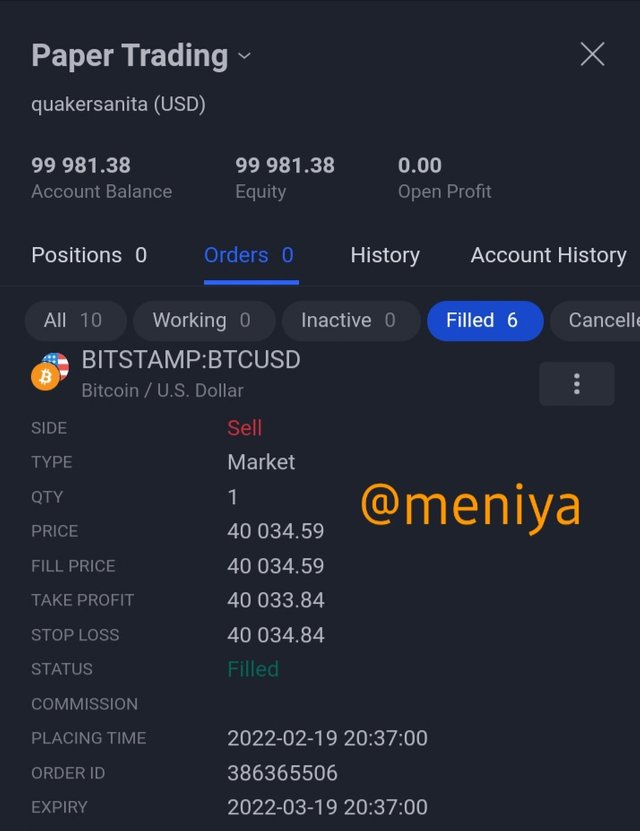
Image from paper trading view
Conclusion
RSI and Ichimoku indicators are great trading strategy that provides vital trading information doe crypto traders, the combination of these two indicators helps to filter out false-positive trading signals and gives a better view of trend reversals in the market, in order for traders to know when to makes an entry or cut trade in order to maximize more profits than losses. Although, they don't give as much details when used alone, to get the best results they are better when combined and with other technical indicators too. RSI and Ichimoku cloud trqding strategy are good risk management tools for traders, and its effectiveness is greatly dependent on a traders desired trading pattern and the setting of the indicators.
Thank you professor @abdu.navi03 for this interesting lesson this week, looking forward to your next class.
