Hello Friends, it's my pleasure to enroll into this week's academy lecture as taught by Professor @dilchamo, below is my take on the following underlying questions. Thanks for patiently going through.

1 Define Line charts in your own words and Identify the uses of Line charts.

Line chart as one of the basic charts used in securities and other assets trading is a graph that shows a continuous historical price movement of an asset which specifically spots the closing prices of different stocks.
Hence, the line chart can be used on any trading time frame without hitches. The need for the line chart arose as a result of the inconveniences or noise caused by some other trading charts like candle charts etc with their open, high, low and closing prices which seems highly confusing most times as it's being used in trades.
For instance a trader opens his trading interface and checking on the dashboard he/she is seeing different high and low positions of trade and finally is confused of either buying or selling for the day using candle charts because of the obvious noise of market fluctuations, but with the help of the line chart which shows the current and closing price of an asset, one can confidently enter or exit the market based on the current line chart position since the historical prices action has a better explanation of the market occurrences based on the current price.
There are numerous uses of the line chart which a trader can capitalize on, for profit maximization while trading.
It is used in identifying the present trend with different high and low market positions over time.
It can also be used in spotting Support and Resistance levels in the market trend
It is used in identifying trend reversals and continuations based on the current price action.
It is used in determining mutation or changes in price action based on the traded time frame.

2 How to Identify Support and Resistance levels using Line Charts (Demonstrate with screenshots)

We know that the market structure is based on three market scenarios which are bull trend, uptrend and a range market.
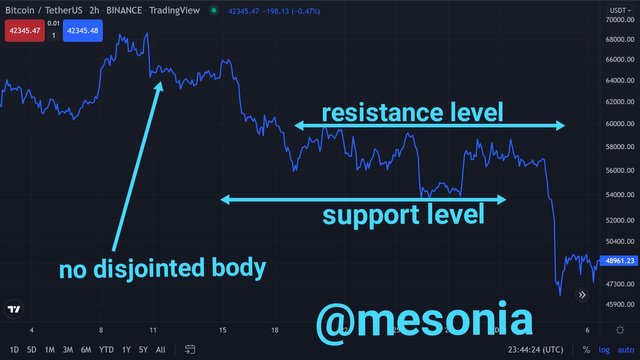
Hence using the line chart we can easily observe the current state of the market and further to visualize the support level we can draw a horizontal line possibly linking to the previous support or resistance level, that is if we are to scrutinize the market structure on a wider range but if on a short range we can observe the support and resistance levels based on the short Bullish and Bearish mounts and hollows as the small mounts represent resistance level while hollows represents levels of support but this may not always be the case as most support levels turns to resistance and vice versa, reasons being that the current market structure which could have either served as the support or resistance point had a further market break to further form another support or resistance level.
Finally the need for spotting the support and resistance levels is for a trade to easily enter or exit the market at the appropriate time.
Let's take a look at the screenshot below to properly envisage the support and resistance points using BTC/USDT price chart.
From the screenshot above we can observe the different support and resistance levels as the potential of this market can be capitalized by a CFD or future trader in taking short entry or exit positions with the help of the different support and resistance levels.

3 Differentiate between line charts and Candlestick charts.( Demonstrate with screenshots)l

As earlier explained above, line charts show the current price observation of an asset without any consideration of intermittent previous price actions, while candlestick charts shows the market price observations at different market intervals
Line charts are easier to be used and this makes it possible for even a beginner to trade with, while on the contrary, a beginner can accumulate many losses as a result of the noise generated from trades using the candlestick chart.
Levels of support and resistance can easily be spotted using the line chart due to its congruent and non high stochastic movement, while it may not be that easy to properly observe levels of support and resistance on candlestick charts due to its high volatility rate, as it can also create different fakeouts which can never be seen while trading with line chart.
Both a long and short term trader can use the line chart due to its easily spotted support and resistance points which vivifies real buy and sell positions, but contrarily, long-term investors benefits more than short term investors from the use of candlestick charts because of its fakeouts, non congruent and some other noise like high and low prices generated from trades.
Now let's take a real look into the theories above for a better understanding of my claims.
From the screenshot of this line chart, we can observe that there is no precise high and low price dictated from it on like the candlestick chart, we can also observe that there are no price fakeouts and the price movement looks congruent without much volatility, moreso it is not a disjointed chart as it shows different support and resistance points from its price movement.
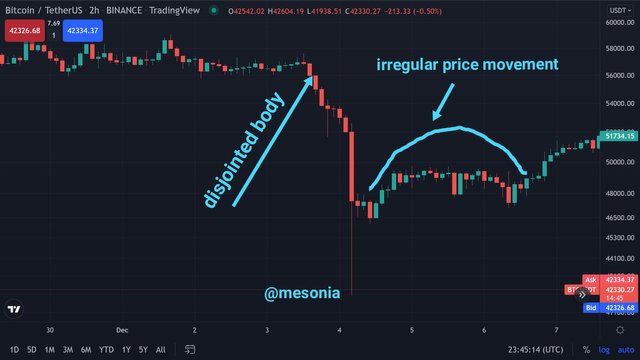
From the candlestick chart above, we can observe the non compatibility of the different candles which makes the trend line highly incongruent.
We can also observe the fake out position made by the candlestick chart which is never observed in a line chart.
Finally, these factors make it a bit difficult for a beginner to trade without good use of other Indicators.

4 Explain the other Suitable indicators that can be used with Line charts.(Demonstrate with screenshots)

There are many indicators that can be used in a more comparable way with the line chart like the EMA, MA, Supertrend, Bollinger bands etc but in this scenario, I will be using two compatible indicators that can be used effectively and proficiently with the line chart amongst others and these are MA and Supertrend indicators.
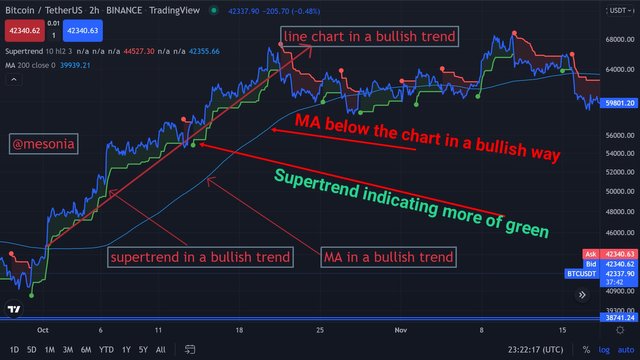
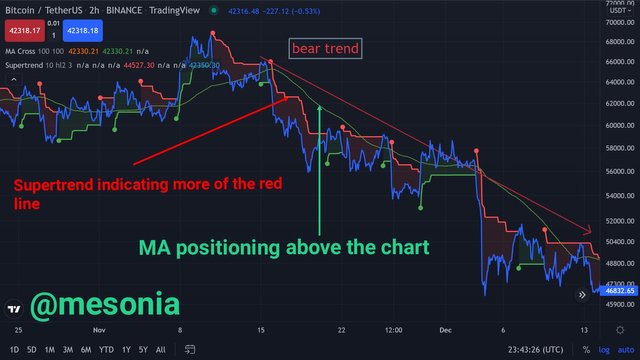
The MA for instance shows a more bullish strength when it moves below the line chart in an upwards movement and moreso in a downwards movement, the MA trends above the line chart in a bearish way for the confirmation of a down trend.
On the other hand, Supertrend indicator as one of the indicators that is compatible with the line chart is also another chart base Indicator that shows the a bullish strength when it's line turns green and during a bear reversal, it's line turns more red than green.
These indicators can be seen from the screenshots below using BTC/USDT price chart in a bullish and bearish trend. And this is just two amongst other indicators that is suitable with the line chart.
The suitability of these indicators on the line chart in a bullish scenario.
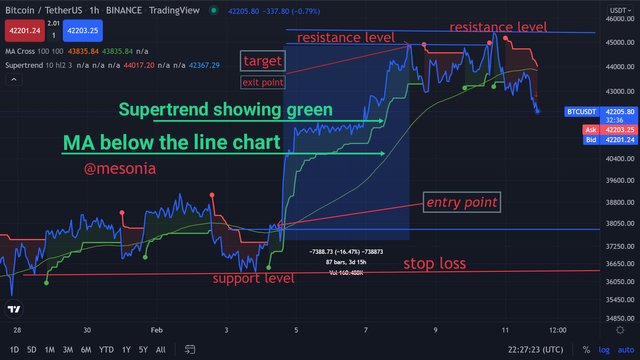
We can observe from the screenshot above that as the line chart took a bull trend, the MA trends below it while the Supertrend indicator shows more of its green line than the reddish line also below the line chart.
The suitability of these indicators on the line chart in a bearish scenario.
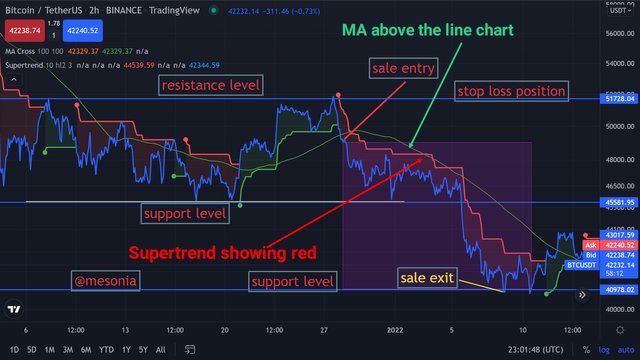
We can also observe from the screenshot that as the line chart took a bear trend, the MA positions above the chart while the Supertrend indicator shows more of its red line than the green line.

5 Prove your Understanding of Bullish and Bearish Trading opportunities using Line charts. (Demonstrate with screenshots)

In this regard, i will be demonstrating using the BTC/USDT price chart in bullish and bearish trend using Binance on trading view platform and also with the help of the MA and the Supertrend indicator as no trader can make good returns from trades without the help of efficient and well acquainted indicators.
Bullish Trading opportunity using the line chart with the help of the MA and Supertrend indicate.
From the BTC/USDT chart above, we can observe the entry point after identifying the real support level from the trend line at the higher low position of the line chart.
Hence,from the entry point, a stop loss was set little below the entry position and take profit on the other hand was set at the point the trend had the first resistance at the price consolidation area of the line chart where I tagged target or exit point and this position was placed with the assistance of the two indicators against trade loss.
Bearish Trading opportunity using the line chart with the help of the MA and Supertrend indicate.
Also from the BTC/USDT chart above, we can observe the sale entry after identifying the real resistance level at the first lower high position after the market structure break.
from the sale entry point, a stop loss was set above the entry position and take profit on the other hand was set at the down section of the price consolidation point where the support level of the market trend was placed and this is also with the help of the two indicators employed.

6 Investigate the Advantages and Disadvantages of Line charts according to your Knowledge.

- It can easily be used in identifying the different resistance and support levels in the market trend.
- It is compatible to trade with whether you are a beginner or even a professional
- It does not complicate the market by creating different illusions like market fakeouts.
- We believe that every bear trend is followed by a bull trend, so after the trend line has made a bull push, we should be expecting a bear entry by default using the line chart unless in cases where there is a further breakout which makes it an easy to use trading chart.
- The line chart is a good chart strategy which is also compatible with different chart base indicators like MA, Supertrend, Bollinger bands etc as their amalgamation into the line chart produces profitable results when effectively used.
As no one can efficiently and effectively trade without any indicator, this makes it less effective if solely utilized.
Since the line chart is a congruent and a disjointed trading chart, it makes it difficult for a trader to make some observations or lag estimates based on different points where specific prices had occurred.
- Long term investors may not proficiently benefit using this chart pattern, which makes it more suitable for short term traders.
- Each bull mount does not guarantee that the next observation will be a bearish trend as market structure breaks can occur at any period in the market trend.
- It is difficult to calculate and hence this also makes it nearly impossible for some market analysts to utilize future forecasts.
The line chart is one of the best charts to trade with as it shows less fake trends compared to some other indicators.
Nevertheless, it should not be used without the help of some other compatible and familiar indicators against trade losses as no chart has the sole strength of being used alone.
Finally my research into this chart pattern has also been added to my trading archive, thanks to Professor @dilchamo for this opportunity.
.png)
