INTRODUCTION
It is my pleasure to once again enter your class @stream4u as a student and have the privilege to write your examination. I have read through the lecture and understood as best as I can to the point of answering the questions accordingly. Here are my submissions below:
Homework Task(Topic 1): What Is The Meaning Of Support Can Become Resistance & Resistance Become Support, When and Where set Buy trade, Chart Example?
Resistance and Support are lines are drawn to show the movement of asset prices in the market. While Resistance refers to bullish market, Support refers to the bearish market.
Now a good trader patiently wait and monitor the movement of assets prices on his chart having already drawn and identify the zones of resistance and support. At the point where the price passes through resistance, and again moves back towards the level of resistance, there and then, Resistance have become support. Action should be taken immediately or the trader misses out.
On the other hand, as price pulls downward to the Support zone and cross the support zone, and turn up again upwards to break through the line, at that point support has now become resistance.
The above scenario happens as a result of demand and supply of assets in the market, that is why a patience and smartness is required.

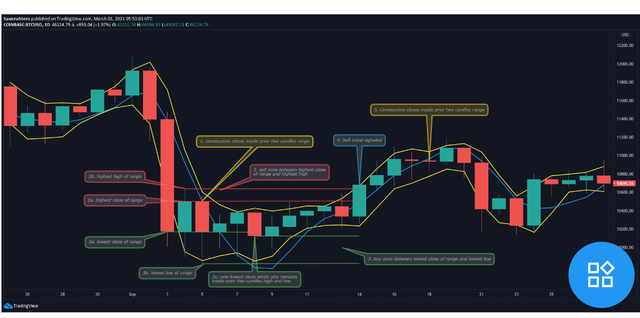
The chart from @stream4u lecture
From the chart above, notice that No 1 line is Support while No 2 is Resistance. You can see how price crosses through the support line and then move up again, at this point, Support is now acting as Resistance as shown on the number 3. Then look up to see points No 4 and No 5 where Resistance became Support as a result of the former high price makes a U-turn to cross the line of Resistance.
Topic 2: What Is A Technical Indicator?
These are mathematically calculated signals that trading experts have collected based on historical data of asset prices. Technical indicator helps to checkmate entry and exit points for traders.
There are different types of technical indicators and roles they play but for want of time and space, two are hereunder discussed:
- Momentum Indicator: This type of indicator measures the strength, speed and the volume at which prices change from at one point to another. So it is the difference with which a price changes from the previous point.

Momentum Trade Indicator
- Trend Trade Indicators: Since there are only two things that happen on the trade chart which are movement of prices upward and downward. Trend line indicators are useful tools that help to identify and confirm such movements. With them a trader can predict zones of support and resistance.
Task Topic 3: Provide your view and explore Trading View
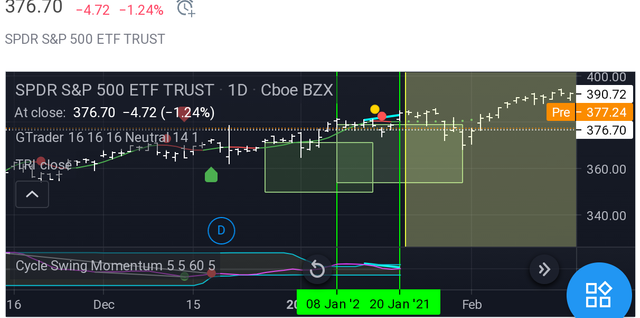
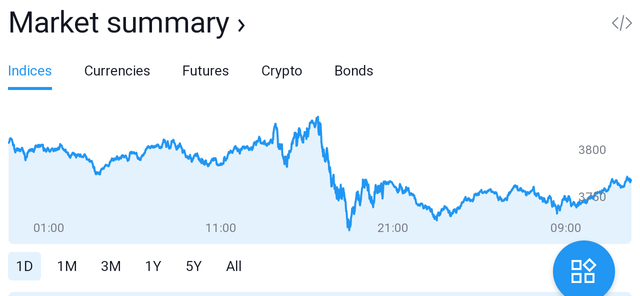
Below is my trading view screenshots minutes ago:

Trading view is one of the largest charting communities where trading experts and analysts come together to provide free technical indicators and strategies for public usages. Those outstanding contributors in Trading View are called Pine Wizards, pine is the language of creating indicators and strategies on TradeView. These wizards are seasoned script writers, they write for free. Their mission is provide everyone with better tools to make trading successful. They provide chat rooms that make it possible for traders to get connected to outstanding analysts globally.
Task Topic 4: What is 200 Moving Average, how and when we can trade/invest with the help of 200 Moving Average? Show different price reactions towards 200 Moving Average
It is a technical indicator used to confirm the trending closing price in the last 200 days. It can be used as a support and resistance measurement as prices often move up and bounce back. It can also be used as a trend filter to make analysis of the price trend in the market and will be enabled to trade in the direction of trending price.
How to use 200 Moving Average: Most trade analysts advise plotting a two type moving average to a chart - one should be longer term and the other, a shorter trend. This enables the trader to monitor closely the direction of the trend.
When to Invest/trade with 200 Moving Average: As you monitor the application of both the shorter and the longer moving average, you notice that the shorter term crosses above the longer term, then it is time to go for a buy.
But when the shorter term crosses below the longer term, the trader go for a sell.
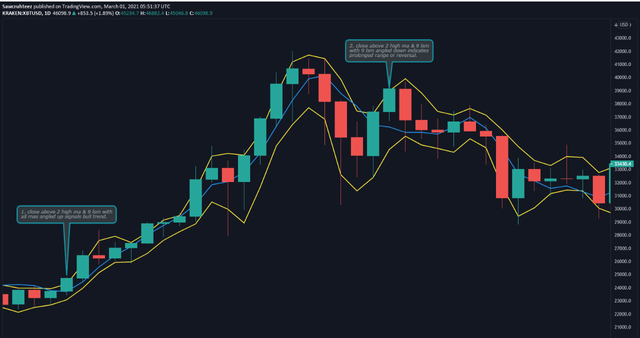
The chart below depicts different prices of when 200 moving average is applied:


I sincerely appreciate you my crypto prof @stream4u for your indept knowledge of crypto trading with its numerous technicalities. I hereby invite @trafalgar to appraise this task and do the needful. This is to show my esteemed participation of homework tasks and thank @steemitblog for this opportunity. My special thanks goes @bright-obias and @whitestallion for making us proud @steemalive.
My warmest regards to every student @cryptoacademy
Hi @meymeyshops
Thank you for joining Steemit Crypto Academy and participating in the Homework Task 4.
Your Homework task 4 verification has been done by @Stream4u.
Thank You.
@stream4u
Crypto Professors : Steemit Crypto Academy
Downvoting a post can decrease pending rewards and make it less visible. Common reasons:
Submit
Thank you for verifying my post, suggestion well noted. @stream for you
Downvoting a post can decrease pending rewards and make it less visible. Common reasons:
Submit