.jpg)
Introduction
Hello for everyone, I hope all is well with you? It's another beautiful day, and today I went to a lecture by one of my favorite professors, @reminiscence01, who lectured on Candlestick Patterns and then gave us a homework assignment on the topic.
1a) Explain the Japanese candlestick chart? (Original screenshot required).
b) In your own words, explain why the Japanese Candlestick chart is the most used in the financial market.
c) Describe a bullish and a bearish candle. Also, explain its anatomy. (Original screenshot required)
EXPLAIN THE JAPANESE CANDLESTICK CHART?
Japanese candlestick chart was called that name because it was invented in Japan by Munehisa Homma in 1700. The Japanese candlestick chart is used as a graphical representation for assessing a variety of market assets, such as stocks, futures, and, of course, cryptocurrency. Japanese candles are formed by buyers and/or sellers in the market when trading in these marketplaces, and patterns are established that can express a number of signals.
When it comes to selecting who will dominate the trend, Japanese Candles are important when it comes to the psychology or attitudes of buyers and sellers.
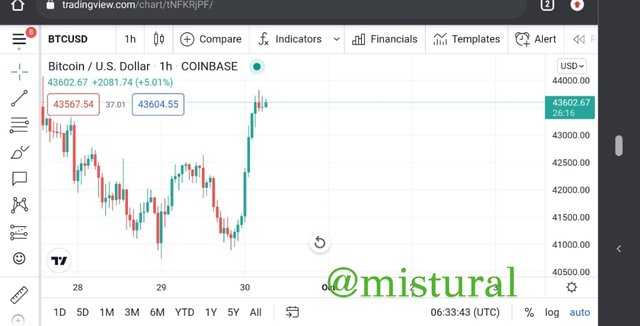
The screenshot below shows a "Japanese Candle" on BTC/USD Chart, which shows the price of the crypto asset (BTC).

As a cryptocurrency trader It is extremely important to understand how Japanese candles operate in technical analysis, this will help to have a better knowledge when buying or selling an asset.
JAPANESE CANDLESTICK'S IMPORTANT ELEMENTS
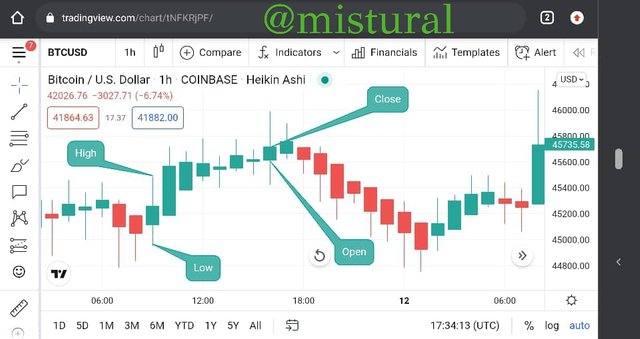
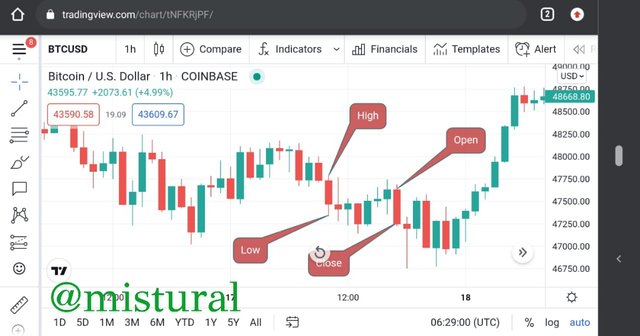
The Japanese candlesticks are made of some important elements, this elements make it unique they include;.
- OPEN: This is the price at the start of the asset.
- LOW: This is when the price of the asset had reached it's lowest point.
- HIGH: This is when the price of the asset had reached it's highest point.
- CLOSE: This is the final price of the asset candle.
IN YOUR OWN WORDS, EXPLAIN WHY THE JAPANESE CANDLESTICK CHART IS THE MOST USED IN THE FINANCIAL MARKET
The Japanese candlestick is an useful tool that allows market indicators accurately predict the direction of the crypto market. It can help a trader distinguish whether the market is in a bullish or bearish phase in various time frames, and as a result, technical analysts all over the world rely on candlesticks to conduct accurate deep analysis on the financial market.
Because of how the candlestick assists traders in providing a detailed analysis of the financial market with very little risk of errors, I believe it is unsurprising that it is one of the most commonly used in the financial market; indeed, it is a powerful indicator that no technical analyst or traders can't do without.
In summary, the candlestick assists us in maintaining a precise study of supply and demand and how they affect the financial market.
BULLISH CANDLESTICKS
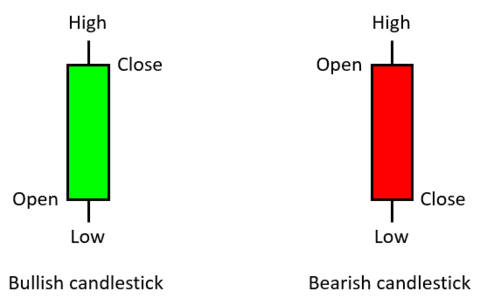
A bullish candlestick's price opening point is always lower than the price closing point, which is a very early indication of possible upward movement. Depending on the sort of trading setup, bullish candlesticks appear in a variety of colors, including green and white.
A Bullish Candle's Anatomy
The bullish has main components: a high, a low, an open, and a close.
HIGH: The high is also a component of the candlestick that represents the current highest price.
LOW: The low is also a component that shows the lowest price that is currently available.
OPEN: This is another component that determines when any price differences begin.
CLOSE: This part includes details such as when the candle will go down out in a certain amount of time and your current cost.

BEARISH CANDLESTICK
This is a type of candlestick pattern that develops during an uptrend and indicates a reversal in the direction of movement. It means that the seller now owns all of the prices that the buyer was unable to acquire.
A Bearish Candle's Anatomy
There are four basic components that make up the bearish. High, low, open, and close.
HIGH: the high is the highest tip that the price has been able to accomplish during the time period is usually the highest tip that the price has been able to achieve.
LOW: the low, the price has typically reached its maximum peak throughout the time span. The low price shows that the market has been bearish for the period of time.
OPEN: This refers to a position at the start of time.
As a result, the initial price of the bearish candle is greater than its closing price.
CLOSE: in this case, we're referring to the point at which the price was set at the end of the time period.
As a result, the close price of the bearish candle is lower than the open price.

Conclusion
The Japanese candlestick has been used in the market for a long time. Its popularity among traders and analysts arises from its usefulness in predicting market price changes.
Due to its simplicity and self-explanatory form, it was also the most popular among newbies to the financial market. The Japanese candlestick chart, on the other hand, isn't just for market analysis; it's also applied in conjunction with other technical analysis tools like the moving average (MA) and many other indicators to ensure accurate trend forecast and assist traders to make intelligent trading decisions.
Thank you for taking the time to read this and thanks to Professor @reminiscence01 for this insightful lecture, stay blessed

